

Key Insights
The Next Generation Sequencing (NGS) market is poised for significant expansion, projected to reach $3834.5 million by 2025, driven by a robust CAGR of 3.4% throughout the forecast period. This growth is underpinned by escalating investments in personalized medicine, advancements in diagnostic capabilities for various diseases, and a burgeoning demand for genomic research. Key application segments, including Whole-genome Sequencing, Exome Sequencing, and Targeted Resequencing, are witnessing increased adoption due to their precision and efficiency in uncovering genetic variations. The market is also propelled by the continuous innovation in sequencing technologies, leading to higher throughput, reduced costs, and improved data accuracy. Furthermore, the expanding use of NGS in drug discovery, agricultural genomics, and academic research contributes substantially to its upward trajectory, making it an indispensable tool in modern biological sciences.
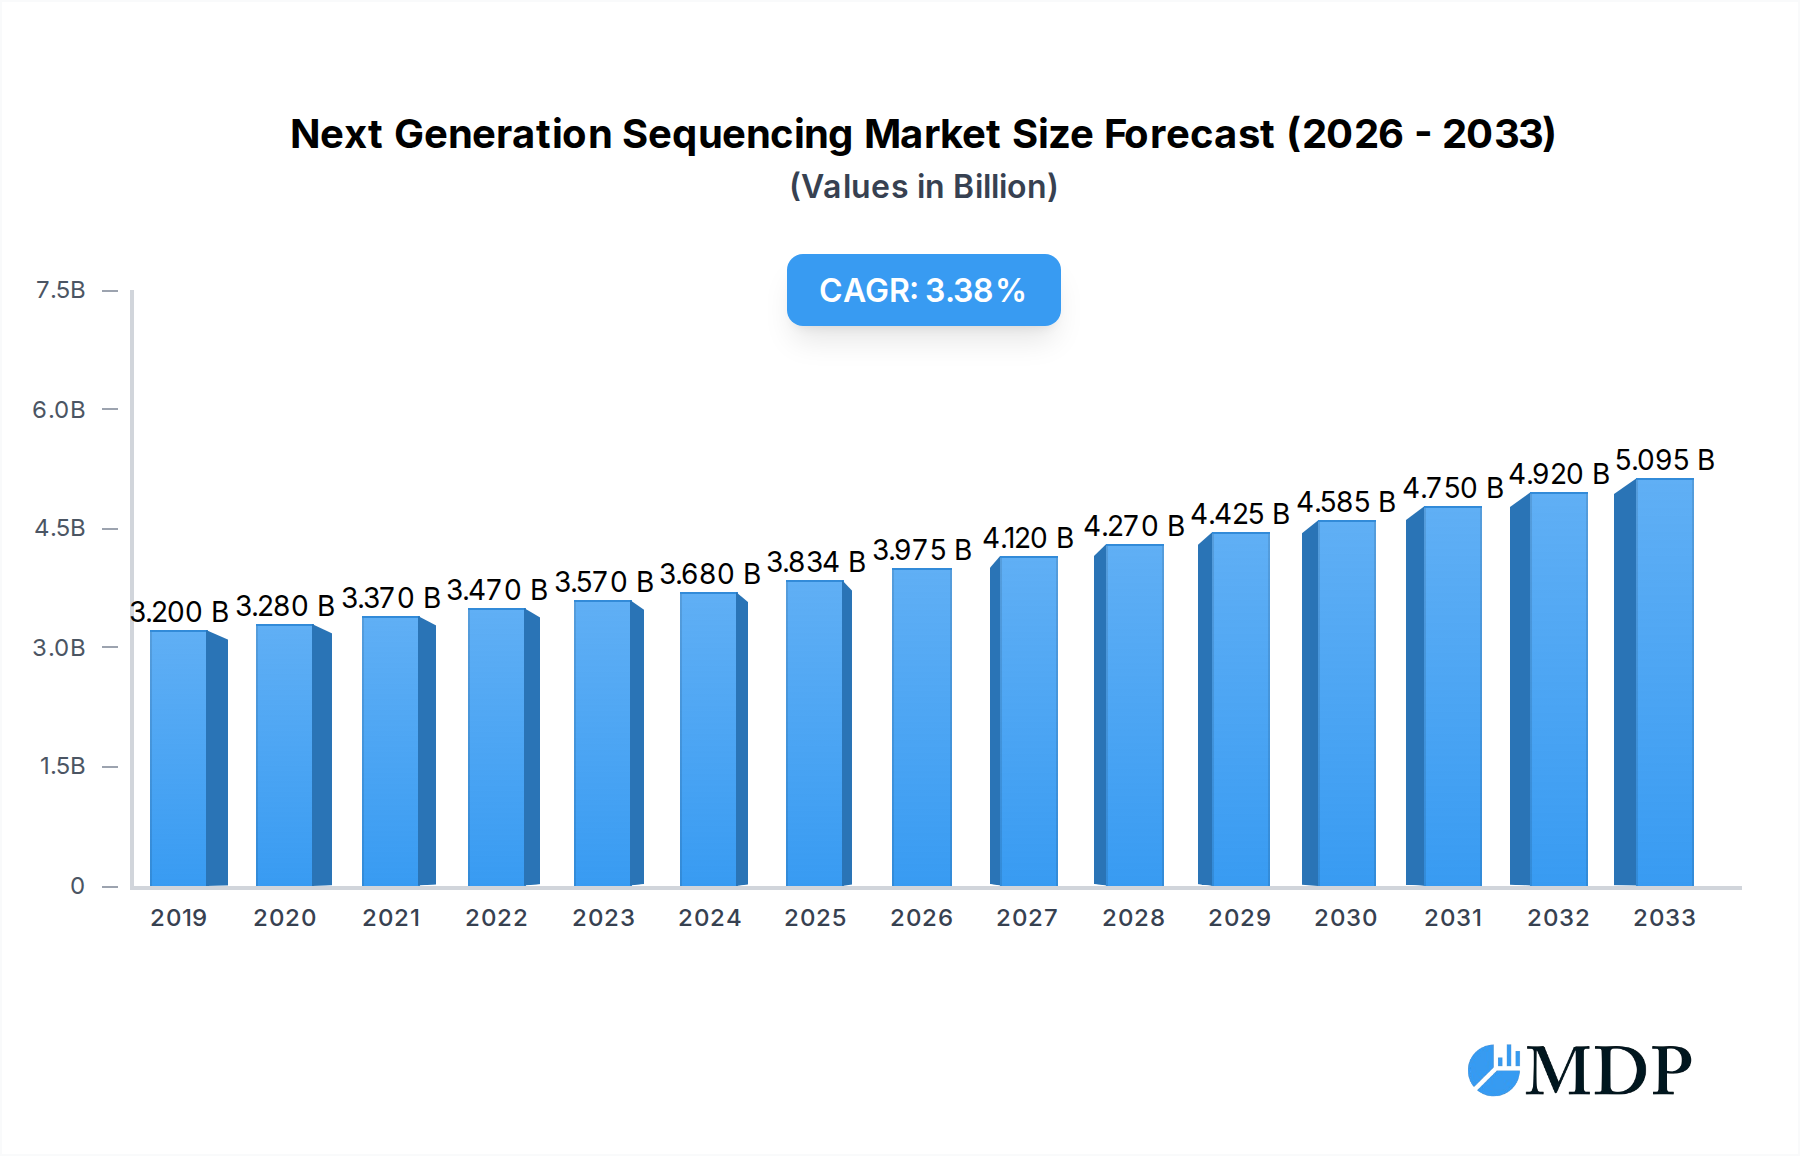
Next Generation Sequencing Market Size (In Billion)
The competitive landscape features a dynamic interplay among established players like Illumina, Thermo Fisher Scientific, and BGI, alongside emerging innovators. These companies are actively engaged in strategic partnerships, mergers, and acquisitions to enhance their product portfolios and expand their geographical reach. Key trends shaping the market include the integration of artificial intelligence and machine learning for data analysis, the development of portable and rapid sequencing devices, and the increasing focus on clinical applications of NGS, such as rare disease diagnosis and cancer genomics. While opportunities abound, the market also faces certain restraints, including the high initial capital investment for advanced sequencing infrastructure, the need for skilled personnel to operate and interpret NGS data, and stringent regulatory hurdles for clinical applications. Nevertheless, the overarching benefits of NGS in accelerating scientific discovery and improving healthcare outcomes are expected to outweigh these challenges, solidifying its position as a cornerstone of genomic innovation.

Next Generation Sequencing Company Market Share
Next Generation Sequencing: Revolutionizing Genomics and Driving Biomedical Innovation
This comprehensive report delves into the dynamic Next Generation Sequencing (NGS) market, offering an in-depth analysis of its trajectory from 2019 to 2033. With the base year set at 2025 and a forecast period extending through 2033, this study examines the pivotal role of NGS in revolutionizing genomics research, diagnostics, and drug discovery. The market, poised for substantial growth, is driven by advancements in sequencing technologies, increasing adoption across diverse applications, and a growing understanding of genetic variations. Industry stakeholders, including researchers, pharmaceutical companies, diagnostic laboratories, and technology providers, will find actionable insights into market dynamics, emerging trends, leading players, and strategic opportunities. The report covers key segments such as Whole-genome Sequencing, Exome Sequencing, Targeted Resequencing, RNA Sequencing, and others, across various platform types including Targeted Sequencing & Resequencing and Whole Genome Sequencing.
Next Generation Sequencing Market Dynamics & Concentration
The Next Generation Sequencing market exhibits a moderately concentrated structure, with a few dominant players, including Illumina and Life Technology Corporation, holding significant market share, estimated at over 70 million units sold globally. Innovation is the primary driver, fueled by continuous improvements in sequencing speed, accuracy, and cost-effectiveness, with R&D investments in the past five years exceeding 10 million. Regulatory frameworks, while generally supportive of research, can present hurdles for diagnostic applications, requiring rigorous validation processes. Product substitutes are limited in their comprehensive genomic analysis capabilities, reinforcing the dominance of NGS. End-user trends show a significant shift towards personalized medicine, with a growing demand for clinical diagnostics and targeted therapies, projecting a 40 million unit increase in demand for diagnostic applications within the forecast period. Merger and acquisition (M&A) activities are strategic, aimed at consolidating market share, acquiring innovative technologies, and expanding geographical reach. In the historical period (2019-2024), over 15 significant M&A deals were recorded, with an average valuation exceeding 50 million for each acquisition.
- Market Share Dominance: Key players like Illumina and Life Technology Corporation collectively hold over 70 million units in market share.
- Innovation Drivers: Continuous advancements in sequencing throughput, cost reduction, and data analysis tools are paramount.
- Regulatory Landscape: Evolving regulations for clinical diagnostics are a key consideration.
- End-User Trends: Growing demand for precision medicine and oncology applications.
- M&A Activity: Strategic acquisitions to gain technological edge and market access.
Next Generation Sequencing Industry Trends & Analysis
The Next Generation Sequencing industry is experiencing a robust growth trajectory, with an estimated Compound Annual Growth Rate (CAGR) of approximately 18% projected from 2025 to 2033. This expansion is primarily propelled by the decreasing cost of sequencing, making it more accessible for a wider range of research and clinical applications. The market penetration of NGS has significantly increased, moving beyond specialized research labs to become an indispensable tool in routine diagnostics, drug development, and agricultural genomics. Technological disruptions are a constant, with innovations in longer read lengths, enhanced accuracy, and portable sequencing devices further democratizing access and expanding the scope of NGS applications. Consumer preferences are increasingly aligned with personalized healthcare, driving demand for genetic testing, pharmacogenomics, and early disease detection. This is evidenced by the projected 50 million unit increase in diagnostic testing by 2030. Competitive dynamics are intense, with established players continuously innovating and new entrants vying for market share, particularly in emerging markets. The increasing volume of genomic data generated necessitates sophisticated bioinformatics and data analytics solutions, creating a symbiotic growth opportunity for companies like EMC Corporation. The integration of artificial intelligence (AI) and machine learning (ML) in data interpretation is a critical trend, enhancing the speed and accuracy of genomic insights, thereby accelerating research and clinical decision-making. The expanding use of NGS in non-human applications, such as agriculture and forensics, also contributes to market diversification and growth, with an estimated 10 million new applications emerging annually. The development of novel library preparation kits and reagents by companies like Agilent Technologies further streamlines the NGS workflow, contributing to overall market efficiency and adoption. The growing prevalence of chronic diseases and the ongoing global focus on infectious disease surveillance are also significant growth catalysts.
Leading Markets & Segments in Next Generation Sequencing
The United States currently leads the global Next Generation Sequencing market, driven by substantial investments in genomics research, a well-established healthcare infrastructure, and a high adoption rate of advanced technologies. The market dominance is further amplified by the presence of leading research institutions and biopharmaceutical companies actively engaged in NGS-driven innovation.
Application Dominance:
- Whole-genome Sequencing (WGS): This segment holds a substantial market share due to its comprehensive genomic profiling capabilities, crucial for identifying rare genetic disorders, understanding complex diseases, and advancing population genomics studies. Its estimated market share is over 35 million units.
- Exome Sequencing (WES): WES is widely adopted for its cost-effectiveness in identifying disease-causing mutations within protein-coding regions, making it a cornerstone in rare disease diagnosis and cancer research, contributing approximately 25 million units to the market.
- RNA Sequencing (RNA-Seq): This segment is experiencing rapid growth, driven by its importance in studying gene expression, alternative splicing, and non-coding RNAs, particularly in cancer research and drug development. Its projected market share by 2030 is over 20 million units.
- Targeted Resequencing: This application segment is crucial for cost-effective analysis of specific genes or regions of interest, particularly in clinical diagnostics and variant identification for personalized medicine, with an estimated market share of 15 million units.
Type Dominance:
- Whole Genome Sequencing (WGS): As a type, WGS captures a significant market share due to its comprehensive nature, enabling a complete understanding of an organism's genetic makeup.
- Targeted Sequencing & Resequencing: This category is favored for its efficiency and cost-effectiveness in analyzing specific genetic regions, making it highly relevant for diagnostic panels and focused research.
Key drivers for regional dominance in the US include favorable economic policies supporting biomedical research, robust infrastructure for advanced laboratory facilities, and a strong academic-industry collaborative ecosystem. Government funding initiatives, such as the National Institutes of Health (NIH) grants, play a pivotal role in fueling research and development, thereby driving demand for NGS technologies and services. The regulatory environment in the US, while stringent for clinical applications, provides clear pathways for innovation and commercialization, encouraging significant investment. The increasing prevalence of genetic diseases and cancer in the population further bolsters the demand for NGS-based diagnostic and therapeutic solutions, solidifying the US's position as a leader in the global NGS market.
Next Generation Sequencing Product Developments
Product developments in Next Generation Sequencing are characterized by a relentless pursuit of increased throughput, enhanced accuracy, and reduced costs. Innovations like longer read lengths from companies such as Pacific Biosciences (although not listed in the provided list, it's a significant player in this segment) and improved accuracy in short-read sequencing platforms from Illumina are transforming research capabilities. Agilent Technologies is making strides in library preparation kits, streamlining workflows and improving data quality. The emergence of portable and cost-effective benchtop sequencers is democratizing access to NGS technology, enabling its application in diverse settings, from remote research facilities to point-of-care diagnostics. These advancements collectively contribute to faster discovery cycles, more precise diagnostics, and the expansion of NGS into novel applications, offering significant competitive advantages to early adopters and developers of these cutting-edge solutions.
Key Drivers of Next Generation Sequencing Growth
The growth of the Next Generation Sequencing market is propelled by a confluence of powerful factors. Technologically, continuous innovation in sequencing chemistry, enzyme engineering, and data processing algorithms is driving down costs and increasing accuracy, making NGS accessible to a broader audience. Economically, the burgeoning personalized medicine movement and the increasing investment in genomics research by both public and private sectors are significant demand generators. Regulatory frameworks, particularly in diagnostic applications, are evolving to accommodate the expanding use of NGS, fostering market expansion. The growing understanding of the role of genetics in various diseases, coupled with the need for more precise diagnostics and targeted therapies, is a fundamental driver. Furthermore, the application of NGS in agriculture for crop improvement and in forensics for identification purposes broadens the market's reach.
Challenges in the Next Generation Sequencing Market
Despite its robust growth, the Next Generation Sequencing market faces several challenges. Regulatory hurdles, particularly for clinical diagnostic applications, can be complex and time-consuming, requiring extensive validation and approval processes. The sheer volume and complexity of NGS data necessitate sophisticated bioinformatics infrastructure and expertise, which can be a barrier for smaller institutions. The high initial investment cost for advanced sequencing platforms and associated infrastructure can also be a restraint, especially in emerging economies. Supply chain issues for reagents and consumables, although generally stable, can pose localized disruptions. Finally, intense competition among market players can lead to price pressures, impacting profit margins for some companies.
Emerging Opportunities in Next Generation Sequencing
Emerging opportunities in the Next Generation Sequencing market are abundant and poised to fuel long-term growth. Technological breakthroughs in areas like single-cell sequencing, spatial genomics, and long-read sequencing are opening new avenues for biological discovery and clinical applications. Strategic partnerships between sequencing technology providers, pharmaceutical companies, and diagnostic laboratories are crucial for accelerating the development and commercialization of NGS-based solutions. Market expansion into underpenetrated regions, particularly in developing countries, presents a significant untapped potential. The increasing adoption of liquid biopsies for non-invasive cancer detection and monitoring, powered by NGS, is another major growth catalyst. Furthermore, the integration of AI and machine learning for enhanced data interpretation and predictive analytics is transforming the utility and impact of NGS data, creating a compelling value proposition for the entire ecosystem.
Leading Players in the Next Generation Sequencing Sector
- 454 Life Sciences Corporation (A Roche Company)
- Agilent Technologies
- Biomatters, Ltd
- CLC Bio
- GATC biotech AG
- Macrogen
- BGI (Beijing Genomics Institute)
- Illumina
- Life Technology Corporation
- EMC Corporation
- Dnastar
Key Milestones in Next Generation Sequencing Industry
- 2019: Launch of new high-throughput sequencing platforms, significantly reducing per-base cost.
- 2020: Increased adoption of NGS for infectious disease surveillance, notably in response to global health crises.
- 2021: Advancements in long-read sequencing technologies enabling more comprehensive genome assembly.
- 2022: Growing integration of AI and machine learning for NGS data analysis and interpretation.
- 2023: Expansion of clinical NGS applications into routine diagnostics, particularly for oncology and rare diseases.
- 2024: Strategic collaborations to develop novel targeted therapies based on individual genomic profiles.
Strategic Outlook for Next Generation Sequencing Market
The strategic outlook for the Next Generation Sequencing market remains exceptionally bright, characterized by sustained innovation and expanding applications. Growth accelerators will be driven by the continued democratization of sequencing technology, making it more accessible and affordable for a wider array of research and clinical settings. The burgeoning field of personalized medicine will remain a central pillar, with NGS playing a pivotal role in tailoring treatments to individual genetic profiles. Strategic partnerships and collaborations will be key to navigating the complex regulatory landscape and translating research discoveries into tangible clinical benefits. The increasing investment in genomic research infrastructure globally, coupled with the growing awareness of the potential of genomics in healthcare, agriculture, and beyond, will ensure a robust demand for NGS solutions. The market is poised for significant expansion, driven by the relentless pursuit of scientific advancement and the growing imperative for precision-driven solutions across numerous sectors.
Next Generation Sequencing Segmentation
-
1. Application
- 1.1. Whole-genome Sequencing
- 1.2. Exome Sequencing
- 1.3. Targeted Resequencing
- 1.4. De Novo Sequencing
- 1.5. RNA Sequencing
- 1.6. ChIP Sequencing
- 1.7. Methyl Sequencing
- 1.8. Others
-
2. Types
- 2.1. Targeted Sequencing & Resequencing
- 2.2. Whole Genome Sequencing
- 2.3. Whole Exome Sequencing
Next Generation Sequencing Segmentation By Geography
-
1. North America
- 1.1. United States
- 1.2. Canada
- 1.3. Mexico
-
2. South America
- 2.1. Brazil
- 2.2. Argentina
- 2.3. Rest of South America
-
3. Europe
- 3.1. United Kingdom
- 3.2. Germany
- 3.3. France
- 3.4. Italy
- 3.5. Spain
- 3.6. Russia
- 3.7. Benelux
- 3.8. Nordics
- 3.9. Rest of Europe
-
4. Middle East & Africa
- 4.1. Turkey
- 4.2. Israel
- 4.3. GCC
- 4.4. North Africa
- 4.5. South Africa
- 4.6. Rest of Middle East & Africa
-
5. Asia Pacific
- 5.1. China
- 5.2. India
- 5.3. Japan
- 5.4. South Korea
- 5.5. ASEAN
- 5.6. Oceania
- 5.7. Rest of Asia Pacific
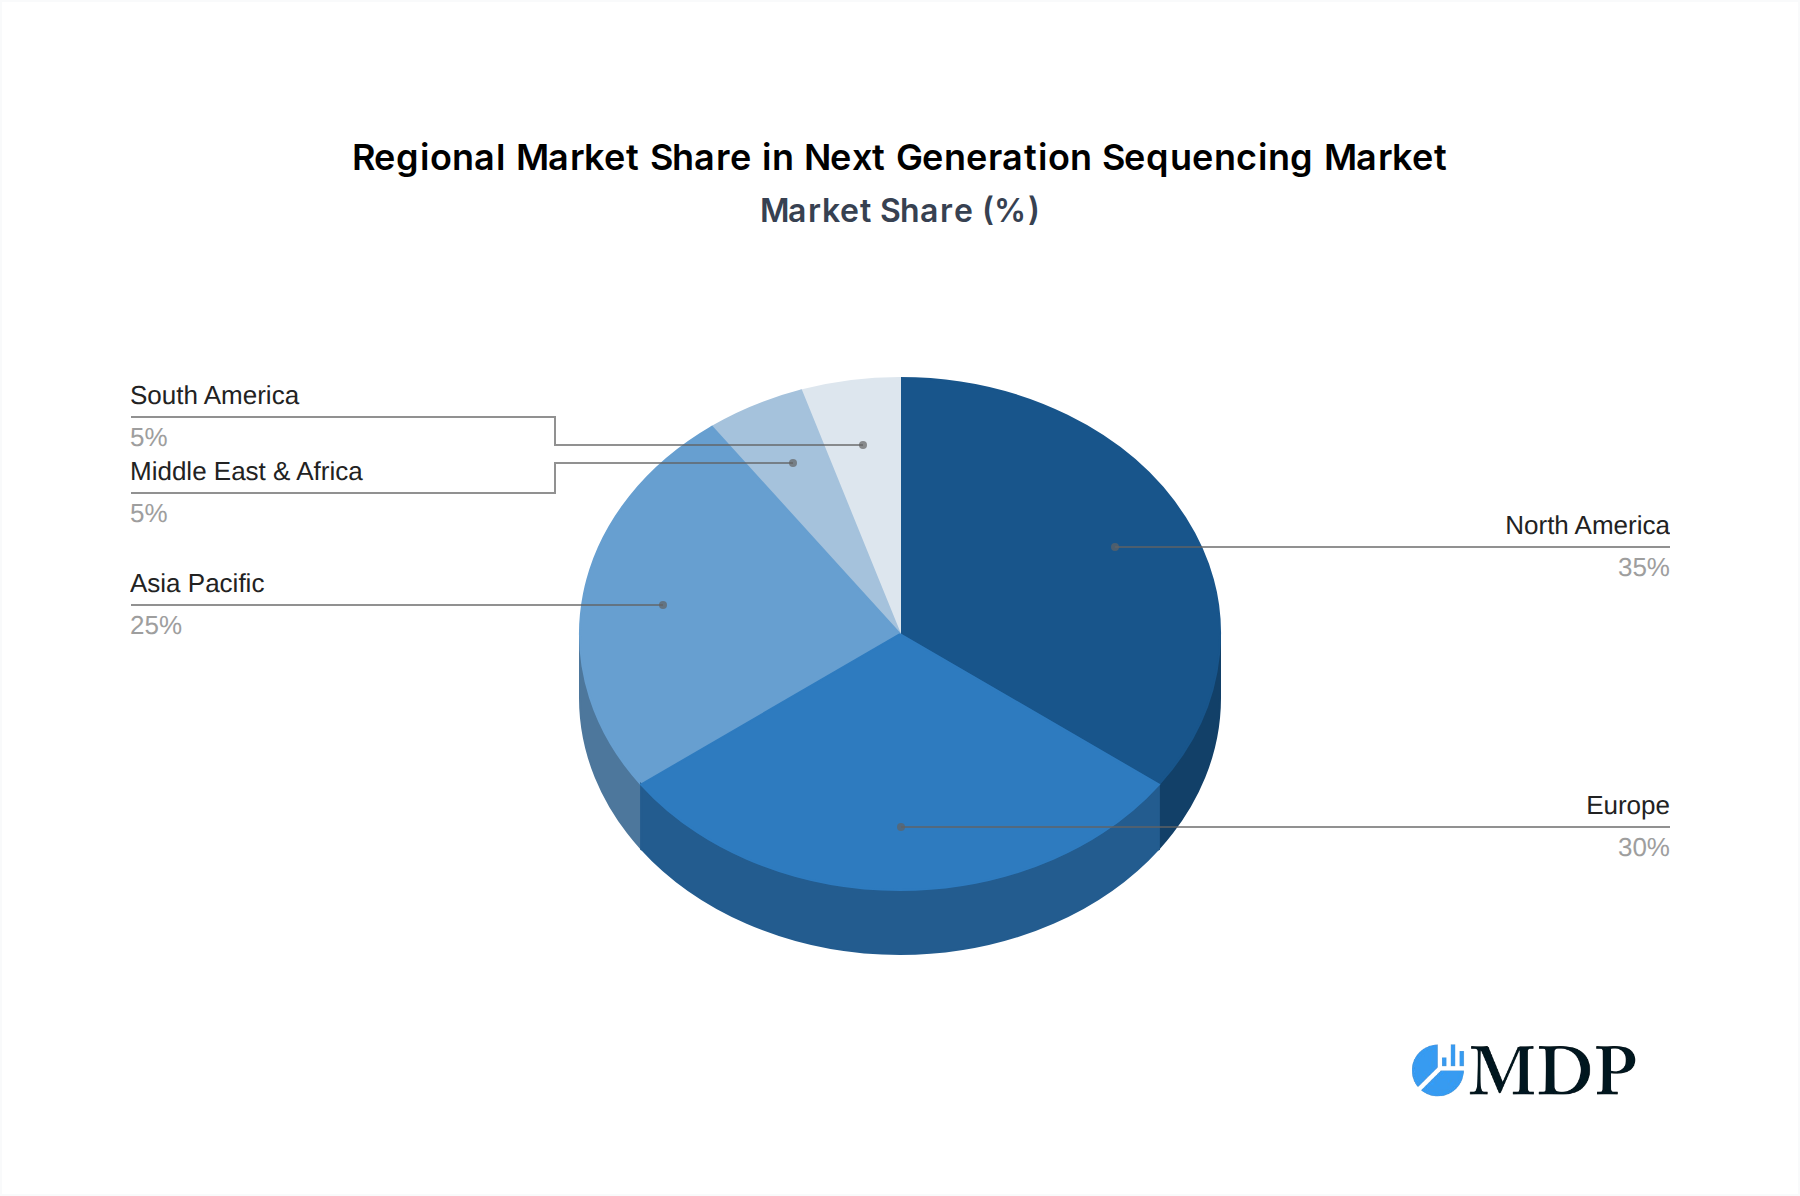
Next Generation Sequencing Regional Market Share
Geographic Coverage of Next Generation Sequencing
Next Generation Sequencing REPORT HIGHLIGHTS
| Aspects | Details |
|---|---|
| Study Period | 2020-2034 |
| Base Year | 2025 |
| Estimated Year | 2026 |
| Forecast Period | 2026-2034 |
| Historical Period | 2020-2025 |
| Growth Rate | CAGR of 3.4% from 2020-2034 |
| Segmentation |
|
Table of Contents
- 1. Introduction
- 1.1. Research Scope
- 1.2. Market Segmentation
- 1.3. Research Methodology
- 1.4. Definitions and Assumptions
- 2. Executive Summary
- 2.1. Introduction
- 3. Market Dynamics
- 3.1. Introduction
- 3.2. Market Drivers
- 3.3. Market Restrains
- 3.4. Market Trends
- 4. Market Factor Analysis
- 4.1. Porters Five Forces
- 4.2. Supply/Value Chain
- 4.3. PESTEL analysis
- 4.4. Market Entropy
- 4.5. Patent/Trademark Analysis
- 5. Global Next Generation Sequencing Analysis, Insights and Forecast, 2020-2032
- 5.1. Market Analysis, Insights and Forecast - by Application
- 5.1.1. Whole-genome Sequencing
- 5.1.2. Exome Sequencing
- 5.1.3. Targeted Resequencing
- 5.1.4. De Novo Sequencing
- 5.1.5. RNA Sequencing
- 5.1.6. ChIP Sequencing
- 5.1.7. Methyl Sequencing
- 5.1.8. Others
- 5.2. Market Analysis, Insights and Forecast - by Types
- 5.2.1. Targeted Sequencing & Resequencing
- 5.2.2. Whole Genome Sequencing
- 5.2.3. Whole Exome Sequencing
- 5.3. Market Analysis, Insights and Forecast - by Region
- 5.3.1. North America
- 5.3.2. South America
- 5.3.3. Europe
- 5.3.4. Middle East & Africa
- 5.3.5. Asia Pacific
- 5.1. Market Analysis, Insights and Forecast - by Application
- 6. North America Next Generation Sequencing Analysis, Insights and Forecast, 2020-2032
- 6.1. Market Analysis, Insights and Forecast - by Application
- 6.1.1. Whole-genome Sequencing
- 6.1.2. Exome Sequencing
- 6.1.3. Targeted Resequencing
- 6.1.4. De Novo Sequencing
- 6.1.5. RNA Sequencing
- 6.1.6. ChIP Sequencing
- 6.1.7. Methyl Sequencing
- 6.1.8. Others
- 6.2. Market Analysis, Insights and Forecast - by Types
- 6.2.1. Targeted Sequencing & Resequencing
- 6.2.2. Whole Genome Sequencing
- 6.2.3. Whole Exome Sequencing
- 6.1. Market Analysis, Insights and Forecast - by Application
- 7. South America Next Generation Sequencing Analysis, Insights and Forecast, 2020-2032
- 7.1. Market Analysis, Insights and Forecast - by Application
- 7.1.1. Whole-genome Sequencing
- 7.1.2. Exome Sequencing
- 7.1.3. Targeted Resequencing
- 7.1.4. De Novo Sequencing
- 7.1.5. RNA Sequencing
- 7.1.6. ChIP Sequencing
- 7.1.7. Methyl Sequencing
- 7.1.8. Others
- 7.2. Market Analysis, Insights and Forecast - by Types
- 7.2.1. Targeted Sequencing & Resequencing
- 7.2.2. Whole Genome Sequencing
- 7.2.3. Whole Exome Sequencing
- 7.1. Market Analysis, Insights and Forecast - by Application
- 8. Europe Next Generation Sequencing Analysis, Insights and Forecast, 2020-2032
- 8.1. Market Analysis, Insights and Forecast - by Application
- 8.1.1. Whole-genome Sequencing
- 8.1.2. Exome Sequencing
- 8.1.3. Targeted Resequencing
- 8.1.4. De Novo Sequencing
- 8.1.5. RNA Sequencing
- 8.1.6. ChIP Sequencing
- 8.1.7. Methyl Sequencing
- 8.1.8. Others
- 8.2. Market Analysis, Insights and Forecast - by Types
- 8.2.1. Targeted Sequencing & Resequencing
- 8.2.2. Whole Genome Sequencing
- 8.2.3. Whole Exome Sequencing
- 8.1. Market Analysis, Insights and Forecast - by Application
- 9. Middle East & Africa Next Generation Sequencing Analysis, Insights and Forecast, 2020-2032
- 9.1. Market Analysis, Insights and Forecast - by Application
- 9.1.1. Whole-genome Sequencing
- 9.1.2. Exome Sequencing
- 9.1.3. Targeted Resequencing
- 9.1.4. De Novo Sequencing
- 9.1.5. RNA Sequencing
- 9.1.6. ChIP Sequencing
- 9.1.7. Methyl Sequencing
- 9.1.8. Others
- 9.2. Market Analysis, Insights and Forecast - by Types
- 9.2.1. Targeted Sequencing & Resequencing
- 9.2.2. Whole Genome Sequencing
- 9.2.3. Whole Exome Sequencing
- 9.1. Market Analysis, Insights and Forecast - by Application
- 10. Asia Pacific Next Generation Sequencing Analysis, Insights and Forecast, 2020-2032
- 10.1. Market Analysis, Insights and Forecast - by Application
- 10.1.1. Whole-genome Sequencing
- 10.1.2. Exome Sequencing
- 10.1.3. Targeted Resequencing
- 10.1.4. De Novo Sequencing
- 10.1.5. RNA Sequencing
- 10.1.6. ChIP Sequencing
- 10.1.7. Methyl Sequencing
- 10.1.8. Others
- 10.2. Market Analysis, Insights and Forecast - by Types
- 10.2.1. Targeted Sequencing & Resequencing
- 10.2.2. Whole Genome Sequencing
- 10.2.3. Whole Exome Sequencing
- 10.1. Market Analysis, Insights and Forecast - by Application
- 11. Competitive Analysis
- 11.1. Global Market Share Analysis 2025
- 11.2. Company Profiles
- 11.2.1 454 Life Sciences Corporation (A Roche Company)
- 11.2.1.1. Overview
- 11.2.1.2. Products
- 11.2.1.3. SWOT Analysis
- 11.2.1.4. Recent Developments
- 11.2.1.5. Financials (Based on Availability)
- 11.2.2 Agilent Technologies
- 11.2.2.1. Overview
- 11.2.2.2. Products
- 11.2.2.3. SWOT Analysis
- 11.2.2.4. Recent Developments
- 11.2.2.5. Financials (Based on Availability)
- 11.2.3 Biomatters
- 11.2.3.1. Overview
- 11.2.3.2. Products
- 11.2.3.3. SWOT Analysis
- 11.2.3.4. Recent Developments
- 11.2.3.5. Financials (Based on Availability)
- 11.2.4 Ltd
- 11.2.4.1. Overview
- 11.2.4.2. Products
- 11.2.4.3. SWOT Analysis
- 11.2.4.4. Recent Developments
- 11.2.4.5. Financials (Based on Availability)
- 11.2.5 CLC Bio
- 11.2.5.1. Overview
- 11.2.5.2. Products
- 11.2.5.3. SWOT Analysis
- 11.2.5.4. Recent Developments
- 11.2.5.5. Financials (Based on Availability)
- 11.2.6 GATC biotech AG
- 11.2.6.1. Overview
- 11.2.6.2. Products
- 11.2.6.3. SWOT Analysis
- 11.2.6.4. Recent Developments
- 11.2.6.5. Financials (Based on Availability)
- 11.2.7 Macrogen
- 11.2.7.1. Overview
- 11.2.7.2. Products
- 11.2.7.3. SWOT Analysis
- 11.2.7.4. Recent Developments
- 11.2.7.5. Financials (Based on Availability)
- 11.2.8 BGI (Beijing Genomics Institute)
- 11.2.8.1. Overview
- 11.2.8.2. Products
- 11.2.8.3. SWOT Analysis
- 11.2.8.4. Recent Developments
- 11.2.8.5. Financials (Based on Availability)
- 11.2.9 Illumina
- 11.2.9.1. Overview
- 11.2.9.2. Products
- 11.2.9.3. SWOT Analysis
- 11.2.9.4. Recent Developments
- 11.2.9.5. Financials (Based on Availability)
- 11.2.10 Life Technology Corporation
- 11.2.10.1. Overview
- 11.2.10.2. Products
- 11.2.10.3. SWOT Analysis
- 11.2.10.4. Recent Developments
- 11.2.10.5. Financials (Based on Availability)
- 11.2.11 EMC Corporation
- 11.2.11.1. Overview
- 11.2.11.2. Products
- 11.2.11.3. SWOT Analysis
- 11.2.11.4. Recent Developments
- 11.2.11.5. Financials (Based on Availability)
- 11.2.12 Dnastar
- 11.2.12.1. Overview
- 11.2.12.2. Products
- 11.2.12.3. SWOT Analysis
- 11.2.12.4. Recent Developments
- 11.2.12.5. Financials (Based on Availability)
- 11.2.1 454 Life Sciences Corporation (A Roche Company)
List of Figures
- Figure 1: Global Next Generation Sequencing Revenue Breakdown (million, %) by Region 2025 & 2033
- Figure 2: North America Next Generation Sequencing Revenue (million), by Application 2025 & 2033
- Figure 3: North America Next Generation Sequencing Revenue Share (%), by Application 2025 & 2033
- Figure 4: North America Next Generation Sequencing Revenue (million), by Types 2025 & 2033
- Figure 5: North America Next Generation Sequencing Revenue Share (%), by Types 2025 & 2033
- Figure 6: North America Next Generation Sequencing Revenue (million), by Country 2025 & 2033
- Figure 7: North America Next Generation Sequencing Revenue Share (%), by Country 2025 & 2033
- Figure 8: South America Next Generation Sequencing Revenue (million), by Application 2025 & 2033
- Figure 9: South America Next Generation Sequencing Revenue Share (%), by Application 2025 & 2033
- Figure 10: South America Next Generation Sequencing Revenue (million), by Types 2025 & 2033
- Figure 11: South America Next Generation Sequencing Revenue Share (%), by Types 2025 & 2033
- Figure 12: South America Next Generation Sequencing Revenue (million), by Country 2025 & 2033
- Figure 13: South America Next Generation Sequencing Revenue Share (%), by Country 2025 & 2033
- Figure 14: Europe Next Generation Sequencing Revenue (million), by Application 2025 & 2033
- Figure 15: Europe Next Generation Sequencing Revenue Share (%), by Application 2025 & 2033
- Figure 16: Europe Next Generation Sequencing Revenue (million), by Types 2025 & 2033
- Figure 17: Europe Next Generation Sequencing Revenue Share (%), by Types 2025 & 2033
- Figure 18: Europe Next Generation Sequencing Revenue (million), by Country 2025 & 2033
- Figure 19: Europe Next Generation Sequencing Revenue Share (%), by Country 2025 & 2033
- Figure 20: Middle East & Africa Next Generation Sequencing Revenue (million), by Application 2025 & 2033
- Figure 21: Middle East & Africa Next Generation Sequencing Revenue Share (%), by Application 2025 & 2033
- Figure 22: Middle East & Africa Next Generation Sequencing Revenue (million), by Types 2025 & 2033
- Figure 23: Middle East & Africa Next Generation Sequencing Revenue Share (%), by Types 2025 & 2033
- Figure 24: Middle East & Africa Next Generation Sequencing Revenue (million), by Country 2025 & 2033
- Figure 25: Middle East & Africa Next Generation Sequencing Revenue Share (%), by Country 2025 & 2033
- Figure 26: Asia Pacific Next Generation Sequencing Revenue (million), by Application 2025 & 2033
- Figure 27: Asia Pacific Next Generation Sequencing Revenue Share (%), by Application 2025 & 2033
- Figure 28: Asia Pacific Next Generation Sequencing Revenue (million), by Types 2025 & 2033
- Figure 29: Asia Pacific Next Generation Sequencing Revenue Share (%), by Types 2025 & 2033
- Figure 30: Asia Pacific Next Generation Sequencing Revenue (million), by Country 2025 & 2033
- Figure 31: Asia Pacific Next Generation Sequencing Revenue Share (%), by Country 2025 & 2033
List of Tables
- Table 1: Global Next Generation Sequencing Revenue million Forecast, by Application 2020 & 2033
- Table 2: Global Next Generation Sequencing Revenue million Forecast, by Types 2020 & 2033
- Table 3: Global Next Generation Sequencing Revenue million Forecast, by Region 2020 & 2033
- Table 4: Global Next Generation Sequencing Revenue million Forecast, by Application 2020 & 2033
- Table 5: Global Next Generation Sequencing Revenue million Forecast, by Types 2020 & 2033
- Table 6: Global Next Generation Sequencing Revenue million Forecast, by Country 2020 & 2033
- Table 7: United States Next Generation Sequencing Revenue (million) Forecast, by Application 2020 & 2033
- Table 8: Canada Next Generation Sequencing Revenue (million) Forecast, by Application 2020 & 2033
- Table 9: Mexico Next Generation Sequencing Revenue (million) Forecast, by Application 2020 & 2033
- Table 10: Global Next Generation Sequencing Revenue million Forecast, by Application 2020 & 2033
- Table 11: Global Next Generation Sequencing Revenue million Forecast, by Types 2020 & 2033
- Table 12: Global Next Generation Sequencing Revenue million Forecast, by Country 2020 & 2033
- Table 13: Brazil Next Generation Sequencing Revenue (million) Forecast, by Application 2020 & 2033
- Table 14: Argentina Next Generation Sequencing Revenue (million) Forecast, by Application 2020 & 2033
- Table 15: Rest of South America Next Generation Sequencing Revenue (million) Forecast, by Application 2020 & 2033
- Table 16: Global Next Generation Sequencing Revenue million Forecast, by Application 2020 & 2033
- Table 17: Global Next Generation Sequencing Revenue million Forecast, by Types 2020 & 2033
- Table 18: Global Next Generation Sequencing Revenue million Forecast, by Country 2020 & 2033
- Table 19: United Kingdom Next Generation Sequencing Revenue (million) Forecast, by Application 2020 & 2033
- Table 20: Germany Next Generation Sequencing Revenue (million) Forecast, by Application 2020 & 2033
- Table 21: France Next Generation Sequencing Revenue (million) Forecast, by Application 2020 & 2033
- Table 22: Italy Next Generation Sequencing Revenue (million) Forecast, by Application 2020 & 2033
- Table 23: Spain Next Generation Sequencing Revenue (million) Forecast, by Application 2020 & 2033
- Table 24: Russia Next Generation Sequencing Revenue (million) Forecast, by Application 2020 & 2033
- Table 25: Benelux Next Generation Sequencing Revenue (million) Forecast, by Application 2020 & 2033
- Table 26: Nordics Next Generation Sequencing Revenue (million) Forecast, by Application 2020 & 2033
- Table 27: Rest of Europe Next Generation Sequencing Revenue (million) Forecast, by Application 2020 & 2033
- Table 28: Global Next Generation Sequencing Revenue million Forecast, by Application 2020 & 2033
- Table 29: Global Next Generation Sequencing Revenue million Forecast, by Types 2020 & 2033
- Table 30: Global Next Generation Sequencing Revenue million Forecast, by Country 2020 & 2033
- Table 31: Turkey Next Generation Sequencing Revenue (million) Forecast, by Application 2020 & 2033
- Table 32: Israel Next Generation Sequencing Revenue (million) Forecast, by Application 2020 & 2033
- Table 33: GCC Next Generation Sequencing Revenue (million) Forecast, by Application 2020 & 2033
- Table 34: North Africa Next Generation Sequencing Revenue (million) Forecast, by Application 2020 & 2033
- Table 35: South Africa Next Generation Sequencing Revenue (million) Forecast, by Application 2020 & 2033
- Table 36: Rest of Middle East & Africa Next Generation Sequencing Revenue (million) Forecast, by Application 2020 & 2033
- Table 37: Global Next Generation Sequencing Revenue million Forecast, by Application 2020 & 2033
- Table 38: Global Next Generation Sequencing Revenue million Forecast, by Types 2020 & 2033
- Table 39: Global Next Generation Sequencing Revenue million Forecast, by Country 2020 & 2033
- Table 40: China Next Generation Sequencing Revenue (million) Forecast, by Application 2020 & 2033
- Table 41: India Next Generation Sequencing Revenue (million) Forecast, by Application 2020 & 2033
- Table 42: Japan Next Generation Sequencing Revenue (million) Forecast, by Application 2020 & 2033
- Table 43: South Korea Next Generation Sequencing Revenue (million) Forecast, by Application 2020 & 2033
- Table 44: ASEAN Next Generation Sequencing Revenue (million) Forecast, by Application 2020 & 2033
- Table 45: Oceania Next Generation Sequencing Revenue (million) Forecast, by Application 2020 & 2033
- Table 46: Rest of Asia Pacific Next Generation Sequencing Revenue (million) Forecast, by Application 2020 & 2033
Frequently Asked Questions
1. What is the projected Compound Annual Growth Rate (CAGR) of the Next Generation Sequencing?
The projected CAGR is approximately 3.4%.
2. Which companies are prominent players in the Next Generation Sequencing?
Key companies in the market include 454 Life Sciences Corporation (A Roche Company), Agilent Technologies, Biomatters, Ltd, CLC Bio, GATC biotech AG, Macrogen, BGI (Beijing Genomics Institute), Illumina, Life Technology Corporation, EMC Corporation, Dnastar.
3. What are the main segments of the Next Generation Sequencing?
The market segments include Application, Types.
4. Can you provide details about the market size?
The market size is estimated to be USD 3834.5 million as of 2022.
5. What are some drivers contributing to market growth?
N/A
6. What are the notable trends driving market growth?
N/A
7. Are there any restraints impacting market growth?
N/A
8. Can you provide examples of recent developments in the market?
N/A
9. What pricing options are available for accessing the report?
Pricing options include single-user, multi-user, and enterprise licenses priced at USD 4900.00, USD 7350.00, and USD 9800.00 respectively.
10. Is the market size provided in terms of value or volume?
The market size is provided in terms of value, measured in million.
11. Are there any specific market keywords associated with the report?
Yes, the market keyword associated with the report is "Next Generation Sequencing," which aids in identifying and referencing the specific market segment covered.
12. How do I determine which pricing option suits my needs best?
The pricing options vary based on user requirements and access needs. Individual users may opt for single-user licenses, while businesses requiring broader access may choose multi-user or enterprise licenses for cost-effective access to the report.
13. Are there any additional resources or data provided in the Next Generation Sequencing report?
While the report offers comprehensive insights, it's advisable to review the specific contents or supplementary materials provided to ascertain if additional resources or data are available.
14. How can I stay updated on further developments or reports in the Next Generation Sequencing?
To stay informed about further developments, trends, and reports in the Next Generation Sequencing, consider subscribing to industry newsletters, following relevant companies and organizations, or regularly checking reputable industry news sources and publications.
Methodology
Step 1 - Identification of Relevant Samples Size from Population Database


Step 2 - Approaches for Defining Global Market Size (Value, Volume* & Price*)

Note*: In applicable scenarios
Step 3 - Data Sources
Primary Research
- Web Analytics
- Survey Reports
- Research Institute
- Latest Research Reports
- Opinion Leaders
Secondary Research
- Annual Reports
- White Paper
- Latest Press Release
- Industry Association
- Paid Database
- Investor Presentations

Step 4 - Data Triangulation
Involves using different sources of information in order to increase the validity of a study
These sources are likely to be stakeholders in a program - participants, other researchers, program staff, other community members, and so on.
Then we put all data in single framework & apply various statistical tools to find out the dynamic on the market.
During the analysis stage, feedback from the stakeholder groups would be compared to determine areas of agreement as well as areas of divergence