

Key Insights
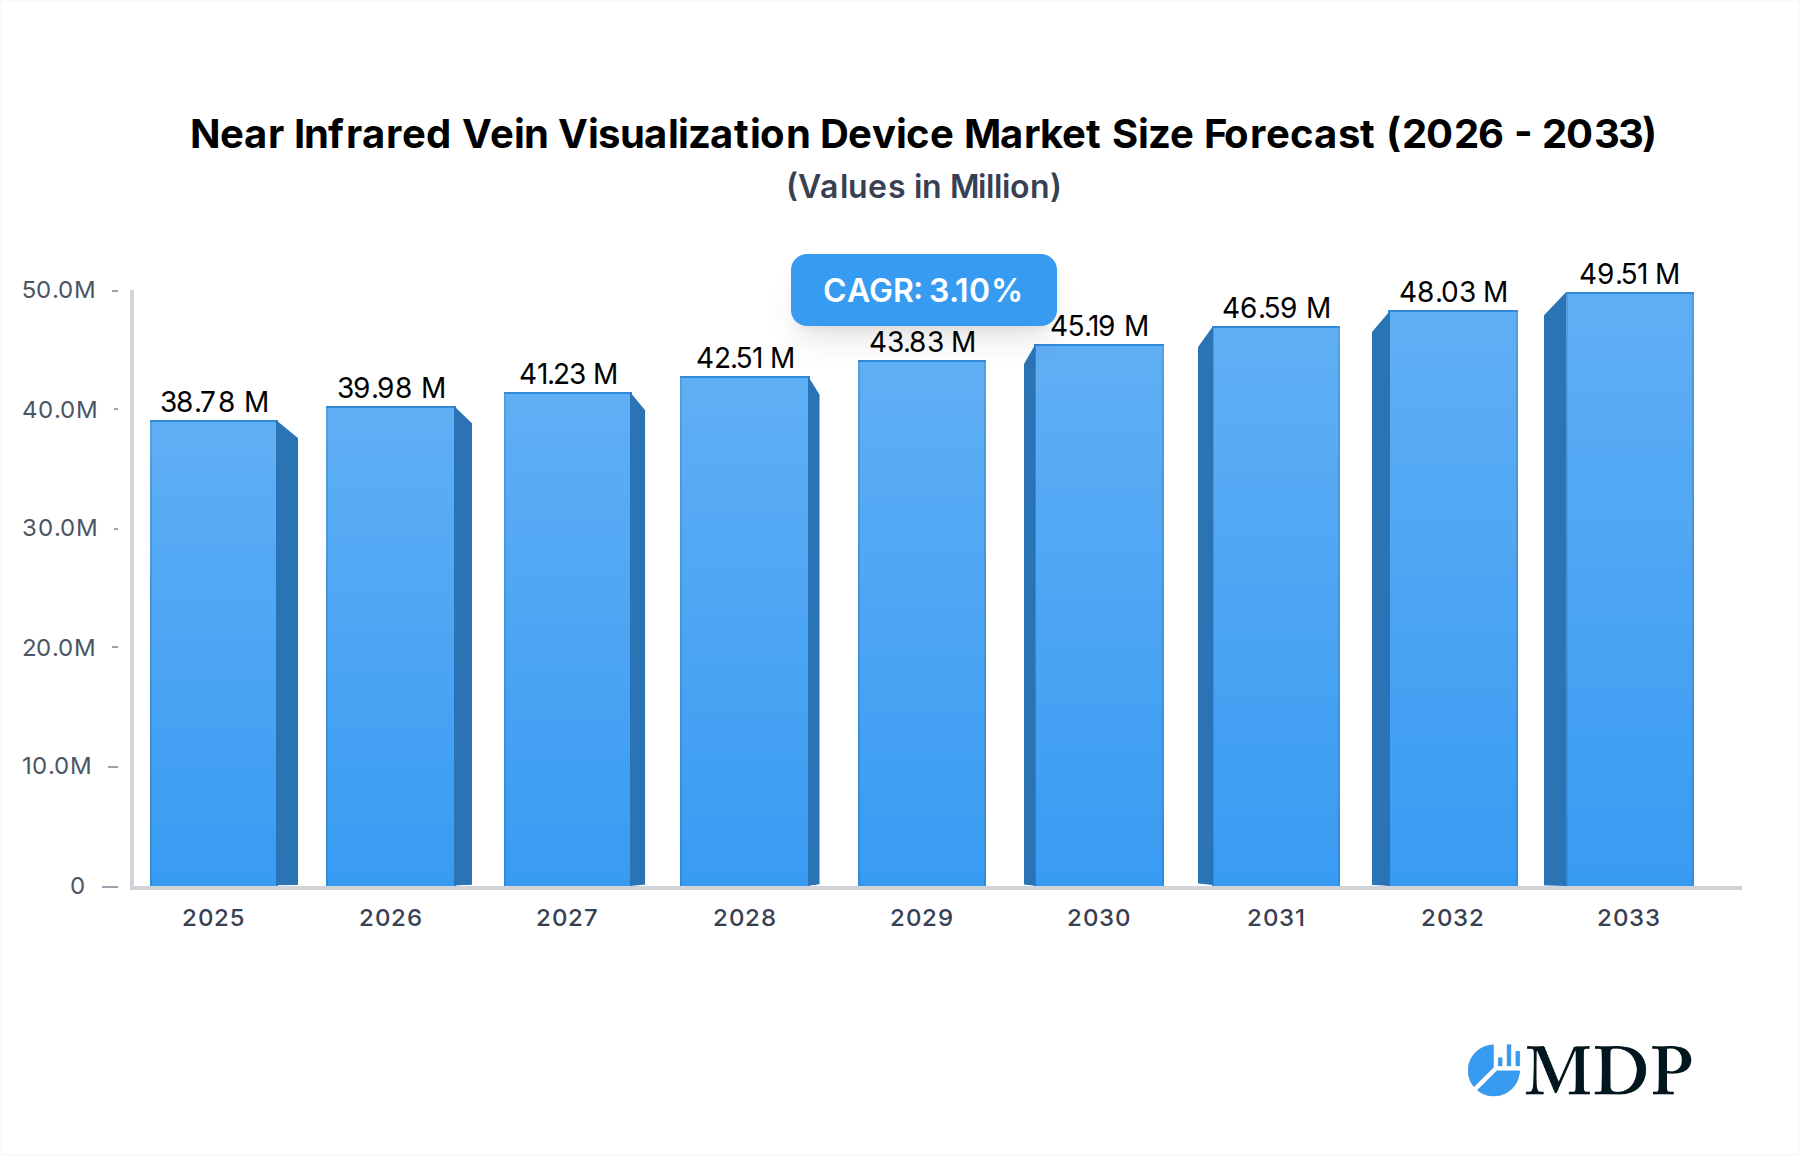
The global Near Infrared Vein Visualization Device market is projected to reach $38.78 million in 2025, exhibiting a steady Compound Annual Growth Rate (CAGR) of 3.4% through 2033. This growth is primarily fueled by the increasing demand for minimally invasive diagnostic procedures and the growing prevalence of conditions that necessitate accurate vein identification, such as obesity, diabetes, and certain dermatological issues. The rising adoption of advanced medical technologies in healthcare settings and the continuous efforts by manufacturers to enhance device functionality and portability are significant growth drivers. Hospitals and clinics are leading the adoption of these devices due to their critical role in improving patient care, reducing the incidence of failed venipunctures, and enhancing overall procedural efficiency. The market is also witnessing a growing preference for handheld devices owing to their flexibility and ease of use in diverse clinical scenarios.

Near Infrared Vein Visualization Device Market Size (In Million)
The market is expected to witness sustained expansion, driven by an increasing focus on patient comfort and safety during medical procedures. Nursing facilities are emerging as a significant segment, as the need for efficient vein access in elderly and chronically ill patients grows. Technological advancements, including improved imaging resolution and real-time visualization capabilities, are further bolstering market growth. While the market benefits from strong demand, potential restraints could include the initial cost of advanced devices and the need for comprehensive training for healthcare professionals. However, ongoing research and development initiatives aimed at making these devices more accessible and user-friendly are anticipated to mitigate these challenges, ensuring a robust growth trajectory for the Near Infrared Vein Visualization Device market.
Near Infrared Vein Visualization Device Company Market Share
This in-depth report offers a definitive analysis of the global Near Infrared Vein Visualization Device market, providing actionable intelligence for stakeholders aiming to capitalize on its significant growth trajectory. Covering the period from 2019 to 2033, with a base year of 2025 and a forecast period extending to 2033, this report meticulously details market dynamics, industry trends, leading segments, product innovations, growth drivers, challenges, emerging opportunities, key players, historical milestones, and a strategic outlook. With an estimated market size of over 500 million in the base year 2025, the market is projected to reach over 1.5 billion by the end of the forecast period, exhibiting a compound annual growth rate (CAGR) of approximately 15%.
Near Infrared Vein Visualization Device Market Dynamics & Concentration
The Near Infrared Vein Visualization Device market exhibits a moderate concentration, with key players like AccuVein, Inc., B. Braun, BD, Christie Medical, and Koninklijke Philips holding significant market shares, estimated to collectively control around 60% of the global market. Innovation drivers are primarily centered around enhanced imaging accuracy, portability, and integration with existing healthcare systems. Regulatory frameworks, particularly those governing medical device approvals in major markets like the US (FDA) and Europe (CE marking), play a crucial role in market entry and product launches. Product substitutes, while limited in direct functionality, include traditional venipuncture techniques and less sophisticated vein finders. End-user trends indicate a growing demand for minimally invasive procedures and improved patient comfort, driving adoption in hospitals and clinics. Mergers and acquisition (M&A) activities have been moderate, with approximately 5-7 significant deals observed over the historical period (2019-2024), often involving smaller technology firms being acquired by larger medical device manufacturers to bolster their portfolios.
Near Infrared Vein Visualization Device Industry Trends & Analysis
The Near Infrared Vein Visualization Device market is experiencing robust growth, fueled by several key trends. A primary growth driver is the increasing prevalence of chronic diseases requiring frequent intravenous access, such as diabetes and cardiovascular conditions, which are estimated to impact over 100 million individuals globally in the forecast period. Technological disruptions are a significant factor, with advancements in near-infrared (NIR) spectroscopy and artificial intelligence leading to more accurate and user-friendly devices. The market penetration of these devices is steadily increasing, moving from specialized units to becoming standard equipment in many healthcare settings. Consumer preferences are evolving towards patient-centric care, emphasizing reduced pain and anxiety associated with venipuncture. This has led to a greater demand for vein visualization technologies that improve first-stick success rates. Competitive dynamics are characterized by both price-based competition and innovation-led differentiation, with companies investing heavily in R&D to gain a competitive edge. The overall market size is projected to grow from an estimated 700 million in 2023 to over 1.5 billion by 2033.
Leading Markets & Segments in Near Infrared Vein Visualization Device
Dominant Regions: North America currently leads the Near Infrared Vein Visualization Device market, projected to maintain its dominance throughout the forecast period. This is largely attributed to the region's advanced healthcare infrastructure, high disposable income, and early adoption of innovative medical technologies. The United States, in particular, represents a substantial portion of this market, with an estimated market share of over 35%.
Key Regional Drivers:
- Economic Policies: Favorable reimbursement policies for advanced medical technologies and a robust healthcare spending environment.
- Infrastructure: Widespread availability of well-equipped hospitals and clinics capable of integrating and utilizing these devices.
- Research & Development: Significant investment in medical device R&D within the region.
Dominant Application Segments:
- Hospitals: Represent the largest application segment, driven by the high volume of intravenous procedures performed in inpatient and outpatient settings. The estimated market share for hospitals is over 55% of the total market value.
- Key Drivers in Hospitals: Rising patient volumes, demand for improved patient outcomes, and the need to reduce healthcare-associated infections and complications.
- Clinics: A rapidly growing segment, particularly ambulatory surgical centers and specialized clinics, driven by the increasing trend of outpatient procedures and a focus on patient convenience.
- Key Drivers in Clinics: Cost-effectiveness, enhanced efficiency for healthcare professionals, and improved patient experience.
- Nursing Facilities: While a smaller segment, nursing facilities are showing increasing adoption due to the growing elderly population requiring long-term care and frequent medical interventions.
- Key Drivers in Nursing Facilities: Addressing challenges in venipuncture for elderly patients with fragile veins and reducing the need for repeated attempts.
Dominant Type Segments:
- Handheld Type: This segment is expected to witness the highest growth rate due to its portability, ease of use, and affordability, making it accessible to a wider range of healthcare professionals and settings.
- Key Drivers for Handheld: Mobility within healthcare facilities, suitability for various patient positions, and lower cost of acquisition compared to fixed units.
- Fixed Type: While still significant, the fixed type segment is projected to grow at a more moderate pace. These devices are typically found in larger medical institutions and are integrated into specific treatment rooms.
- Key Drivers for Fixed Type: Enhanced imaging capabilities for complex procedures and integration with advanced diagnostic systems.
Near Infrared Vein Visualization Device Product Developments
Product development in the Near Infrared Vein Visualization Device market is characterized by a relentless pursuit of enhanced imaging resolution, real-time visualization, and user-friendly interfaces. Innovations are focused on miniaturization of components, extended battery life for handheld devices, and the integration of artificial intelligence for vein mapping and prediction. Companies are also developing devices with broader NIR spectrum capabilities to visualize deeper veins and differentiate between arterial and venous blood. The competitive advantage lies in offering devices that minimize patient discomfort, improve first-stick success rates, and reduce the overall time and resources required for IV access, thereby enhancing procedural efficiency and patient safety in applications ranging from pediatrics to geriatrics.
Key Drivers of Near Infrared Vein Visualization Device Growth
The growth of the Near Infrared Vein Visualization Device market is propelled by several converging factors. Technological advancements in NIR imaging and digital signal processing are continuously improving device accuracy and performance. Economic factors, such as increasing healthcare expenditures globally and favorable reimbursement policies for devices that improve patient outcomes, further stimulate adoption. Regulatory support for innovative medical devices that enhance patient safety and procedural efficiency also plays a crucial role. Furthermore, the rising awareness among healthcare professionals and patients about the benefits of non-invasive vein visualization techniques, such as reduced pain and anxiety, is a significant demand driver. The increasing prevalence of conditions requiring frequent IV access, like diabetes and cancer, also contributes to the market's expansion.
Challenges in the Near Infrared Vein Visualization Device Market
Despite the promising growth, the Near Infrared Vein Visualization Device market faces several challenges. Regulatory hurdles in obtaining approvals from various health authorities can be time-consuming and costly, particularly for novel technologies. High initial investment costs for advanced devices can be a barrier for smaller healthcare facilities and those in developing economies. Supply chain disruptions and the reliance on specialized components can impact production and lead to price volatility. Intense competition from both established players and emerging companies also puts pressure on profit margins. Moreover, resistance to adoption by some healthcare professionals accustomed to traditional methods and the need for adequate training can hinder market penetration.
Emerging Opportunities in Near Infrared Vein Visualization Device
The Near Infrared Vein Visualization Device market is ripe with emerging opportunities. Technological breakthroughs, such as the development of portable, AI-powered vein visualization devices with enhanced accuracy and predictive capabilities, are expected to drive significant market expansion. Strategic partnerships between device manufacturers and healthcare institutions for clinical validation and widespread adoption programs offer promising avenues for growth. Market expansion into emerging economies with a growing focus on improving healthcare infrastructure and access to advanced medical technologies presents a substantial untapped potential. Furthermore, the development of specialized vein visualization devices for niche applications, such as in home healthcare settings or for specific patient populations (e.g., neonates), will create new market segments and revenue streams.
Leading Players in the Near Infrared Vein Visualization Device Sector
- AccuVein, Inc.
- B. Braun
- BD
- Christie Medical
- Koninklijke Philips
- Near Infrared Imaging
- Teleflex Incorporated
- Venoscope
- VINO Optics
Key Milestones in Near Infrared Vein Visualization Device Industry
- 2019: Launch of enhanced multi-spectrum NIR vein visualization technology by Christie Medical, improving visualization depth.
- 2020: AccuVein, Inc. receives expanded FDA clearance for use in pediatric patients.
- 2021: B. Braun introduces a new generation of handheld vein illuminators with improved ergonomics and battery life.
- 2022: Koninklijke Philips showcases advancements in AI-driven vein mapping with its NIR visualization solutions.
- 2023: Teleflex Incorporated expands its portfolio through a strategic acquisition of a niche vein visualization technology company.
- 2024: Several emerging players introduce compact, affordable handheld NIR vein finders, increasing market accessibility.
Strategic Outlook for Near Infrared Vein Visualization Device Market
The strategic outlook for the Near Infrared Vein Visualization Device market is exceptionally positive, driven by continuous innovation and increasing demand for patient-centric healthcare solutions. Growth accelerators include the integration of AI for enhanced vein detection and predictive analytics, the development of ultra-portable and wireless devices, and strategic collaborations to drive adoption in underserved markets. Companies that focus on product differentiation through superior imaging quality, user experience, and comprehensive after-sales support will be well-positioned for sustained success. The expanding application of these devices beyond basic IV access, into areas like phlebotomy and even potential diagnostic imaging, offers significant future market potential. The market is expected to see a rise in value-added services and software integration, further solidifying its growth trajectory.
Near Infrared Vein Visualization Device Segmentation
-
1. Application
- 1.1. Hospitals
- 1.2. Clinics
- 1.3. Nursing Facilities
-
2. Type
- 2.1. Handheld Type
- 2.2. Fixed Type
Near Infrared Vein Visualization Device Segmentation By Geography
-
1. North America
- 1.1. United States
- 1.2. Canada
- 1.3. Mexico
-
2. South America
- 2.1. Brazil
- 2.2. Argentina
- 2.3. Rest of South America
-
3. Europe
- 3.1. United Kingdom
- 3.2. Germany
- 3.3. France
- 3.4. Italy
- 3.5. Spain
- 3.6. Russia
- 3.7. Benelux
- 3.8. Nordics
- 3.9. Rest of Europe
-
4. Middle East & Africa
- 4.1. Turkey
- 4.2. Israel
- 4.3. GCC
- 4.4. North Africa
- 4.5. South Africa
- 4.6. Rest of Middle East & Africa
-
5. Asia Pacific
- 5.1. China
- 5.2. India
- 5.3. Japan
- 5.4. South Korea
- 5.5. ASEAN
- 5.6. Oceania
- 5.7. Rest of Asia Pacific
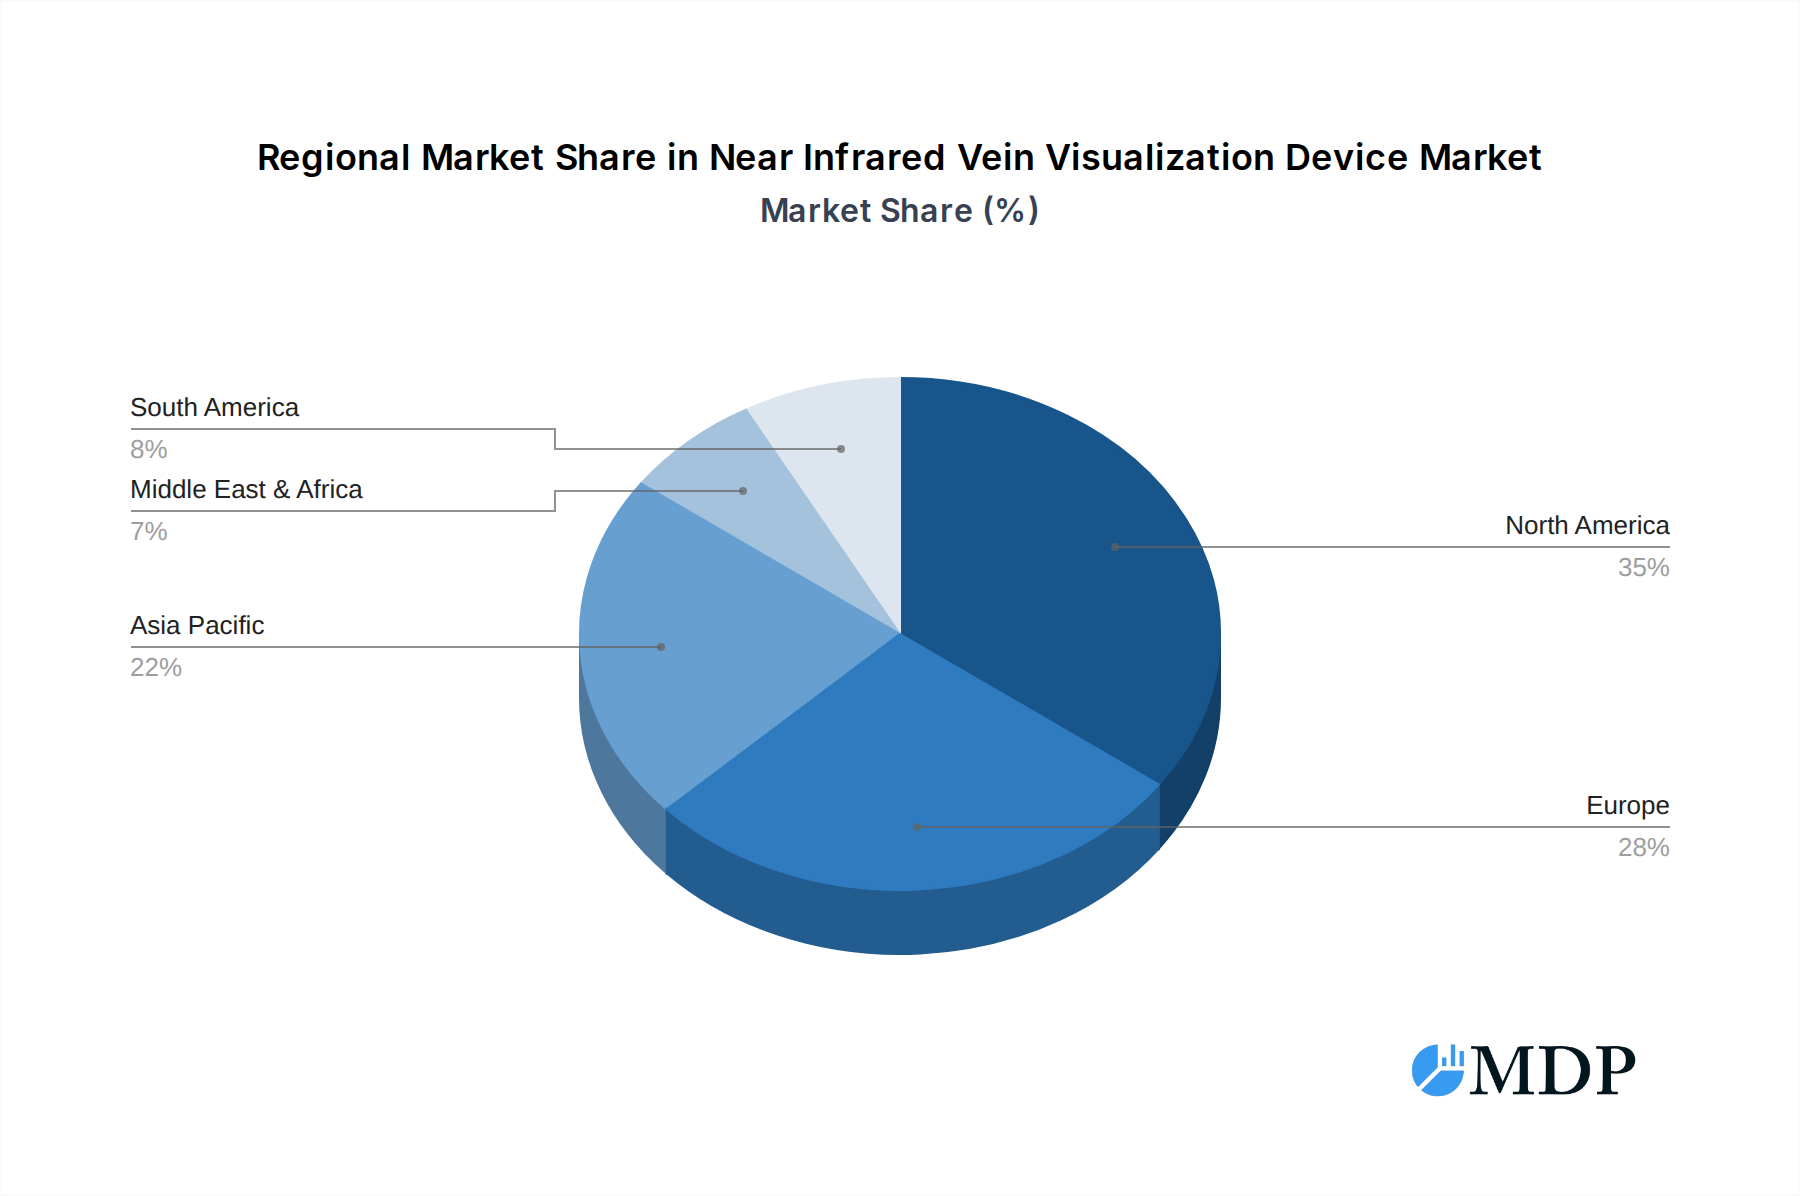
Near Infrared Vein Visualization Device Regional Market Share
Geographic Coverage of Near Infrared Vein Visualization Device
Near Infrared Vein Visualization Device REPORT HIGHLIGHTS
| Aspects | Details |
|---|---|
| Study Period | 2020-2034 |
| Base Year | 2025 |
| Estimated Year | 2026 |
| Forecast Period | 2026-2034 |
| Historical Period | 2020-2025 |
| Growth Rate | CAGR of 3.4% from 2020-2034 |
| Segmentation |
|
Table of Contents
- 1. Introduction
- 1.1. Research Scope
- 1.2. Market Segmentation
- 1.3. Research Methodology
- 1.4. Definitions and Assumptions
- 2. Executive Summary
- 2.1. Introduction
- 3. Market Dynamics
- 3.1. Introduction
- 3.2. Market Drivers
- 3.3. Market Restrains
- 3.4. Market Trends
- 4. Market Factor Analysis
- 4.1. Porters Five Forces
- 4.2. Supply/Value Chain
- 4.3. PESTEL analysis
- 4.4. Market Entropy
- 4.5. Patent/Trademark Analysis
- 5. Global Near Infrared Vein Visualization Device Analysis, Insights and Forecast, 2020-2032
- 5.1. Market Analysis, Insights and Forecast - by Application
- 5.1.1. Hospitals
- 5.1.2. Clinics
- 5.1.3. Nursing Facilities
- 5.2. Market Analysis, Insights and Forecast - by Type
- 5.2.1. Handheld Type
- 5.2.2. Fixed Type
- 5.3. Market Analysis, Insights and Forecast - by Region
- 5.3.1. North America
- 5.3.2. South America
- 5.3.3. Europe
- 5.3.4. Middle East & Africa
- 5.3.5. Asia Pacific
- 5.1. Market Analysis, Insights and Forecast - by Application
- 6. North America Near Infrared Vein Visualization Device Analysis, Insights and Forecast, 2020-2032
- 6.1. Market Analysis, Insights and Forecast - by Application
- 6.1.1. Hospitals
- 6.1.2. Clinics
- 6.1.3. Nursing Facilities
- 6.2. Market Analysis, Insights and Forecast - by Type
- 6.2.1. Handheld Type
- 6.2.2. Fixed Type
- 6.1. Market Analysis, Insights and Forecast - by Application
- 7. South America Near Infrared Vein Visualization Device Analysis, Insights and Forecast, 2020-2032
- 7.1. Market Analysis, Insights and Forecast - by Application
- 7.1.1. Hospitals
- 7.1.2. Clinics
- 7.1.3. Nursing Facilities
- 7.2. Market Analysis, Insights and Forecast - by Type
- 7.2.1. Handheld Type
- 7.2.2. Fixed Type
- 7.1. Market Analysis, Insights and Forecast - by Application
- 8. Europe Near Infrared Vein Visualization Device Analysis, Insights and Forecast, 2020-2032
- 8.1. Market Analysis, Insights and Forecast - by Application
- 8.1.1. Hospitals
- 8.1.2. Clinics
- 8.1.3. Nursing Facilities
- 8.2. Market Analysis, Insights and Forecast - by Type
- 8.2.1. Handheld Type
- 8.2.2. Fixed Type
- 8.1. Market Analysis, Insights and Forecast - by Application
- 9. Middle East & Africa Near Infrared Vein Visualization Device Analysis, Insights and Forecast, 2020-2032
- 9.1. Market Analysis, Insights and Forecast - by Application
- 9.1.1. Hospitals
- 9.1.2. Clinics
- 9.1.3. Nursing Facilities
- 9.2. Market Analysis, Insights and Forecast - by Type
- 9.2.1. Handheld Type
- 9.2.2. Fixed Type
- 9.1. Market Analysis, Insights and Forecast - by Application
- 10. Asia Pacific Near Infrared Vein Visualization Device Analysis, Insights and Forecast, 2020-2032
- 10.1. Market Analysis, Insights and Forecast - by Application
- 10.1.1. Hospitals
- 10.1.2. Clinics
- 10.1.3. Nursing Facilities
- 10.2. Market Analysis, Insights and Forecast - by Type
- 10.2.1. Handheld Type
- 10.2.2. Fixed Type
- 10.1. Market Analysis, Insights and Forecast - by Application
- 11. Competitive Analysis
- 11.1. Global Market Share Analysis 2025
- 11.2. Company Profiles
- 11.2.1 AccuVein Inc
- 11.2.1.1. Overview
- 11.2.1.2. Products
- 11.2.1.3. SWOT Analysis
- 11.2.1.4. Recent Developments
- 11.2.1.5. Financials (Based on Availability)
- 11.2.2 B. Braun
- 11.2.2.1. Overview
- 11.2.2.2. Products
- 11.2.2.3. SWOT Analysis
- 11.2.2.4. Recent Developments
- 11.2.2.5. Financials (Based on Availability)
- 11.2.3 BD
- 11.2.3.1. Overview
- 11.2.3.2. Products
- 11.2.3.3. SWOT Analysis
- 11.2.3.4. Recent Developments
- 11.2.3.5. Financials (Based on Availability)
- 11.2.4 Christie Medical
- 11.2.4.1. Overview
- 11.2.4.2. Products
- 11.2.4.3. SWOT Analysis
- 11.2.4.4. Recent Developments
- 11.2.4.5. Financials (Based on Availability)
- 11.2.5 Koninklijke Philips
- 11.2.5.1. Overview
- 11.2.5.2. Products
- 11.2.5.3. SWOT Analysis
- 11.2.5.4. Recent Developments
- 11.2.5.5. Financials (Based on Availability)
- 11.2.6 Near Infrared Imaging
- 11.2.6.1. Overview
- 11.2.6.2. Products
- 11.2.6.3. SWOT Analysis
- 11.2.6.4. Recent Developments
- 11.2.6.5. Financials (Based on Availability)
- 11.2.7 Teleflex Incorporated
- 11.2.7.1. Overview
- 11.2.7.2. Products
- 11.2.7.3. SWOT Analysis
- 11.2.7.4. Recent Developments
- 11.2.7.5. Financials (Based on Availability)
- 11.2.8 Venoscope
- 11.2.8.1. Overview
- 11.2.8.2. Products
- 11.2.8.3. SWOT Analysis
- 11.2.8.4. Recent Developments
- 11.2.8.5. Financials (Based on Availability)
- 11.2.9 VINO Optics
- 11.2.9.1. Overview
- 11.2.9.2. Products
- 11.2.9.3. SWOT Analysis
- 11.2.9.4. Recent Developments
- 11.2.9.5. Financials (Based on Availability)
- 11.2.1 AccuVein Inc
List of Figures
- Figure 1: Global Near Infrared Vein Visualization Device Revenue Breakdown (undefined, %) by Region 2025 & 2033
- Figure 2: Global Near Infrared Vein Visualization Device Volume Breakdown (K, %) by Region 2025 & 2033
- Figure 3: North America Near Infrared Vein Visualization Device Revenue (undefined), by Application 2025 & 2033
- Figure 4: North America Near Infrared Vein Visualization Device Volume (K), by Application 2025 & 2033
- Figure 5: North America Near Infrared Vein Visualization Device Revenue Share (%), by Application 2025 & 2033
- Figure 6: North America Near Infrared Vein Visualization Device Volume Share (%), by Application 2025 & 2033
- Figure 7: North America Near Infrared Vein Visualization Device Revenue (undefined), by Type 2025 & 2033
- Figure 8: North America Near Infrared Vein Visualization Device Volume (K), by Type 2025 & 2033
- Figure 9: North America Near Infrared Vein Visualization Device Revenue Share (%), by Type 2025 & 2033
- Figure 10: North America Near Infrared Vein Visualization Device Volume Share (%), by Type 2025 & 2033
- Figure 11: North America Near Infrared Vein Visualization Device Revenue (undefined), by Country 2025 & 2033
- Figure 12: North America Near Infrared Vein Visualization Device Volume (K), by Country 2025 & 2033
- Figure 13: North America Near Infrared Vein Visualization Device Revenue Share (%), by Country 2025 & 2033
- Figure 14: North America Near Infrared Vein Visualization Device Volume Share (%), by Country 2025 & 2033
- Figure 15: South America Near Infrared Vein Visualization Device Revenue (undefined), by Application 2025 & 2033
- Figure 16: South America Near Infrared Vein Visualization Device Volume (K), by Application 2025 & 2033
- Figure 17: South America Near Infrared Vein Visualization Device Revenue Share (%), by Application 2025 & 2033
- Figure 18: South America Near Infrared Vein Visualization Device Volume Share (%), by Application 2025 & 2033
- Figure 19: South America Near Infrared Vein Visualization Device Revenue (undefined), by Type 2025 & 2033
- Figure 20: South America Near Infrared Vein Visualization Device Volume (K), by Type 2025 & 2033
- Figure 21: South America Near Infrared Vein Visualization Device Revenue Share (%), by Type 2025 & 2033
- Figure 22: South America Near Infrared Vein Visualization Device Volume Share (%), by Type 2025 & 2033
- Figure 23: South America Near Infrared Vein Visualization Device Revenue (undefined), by Country 2025 & 2033
- Figure 24: South America Near Infrared Vein Visualization Device Volume (K), by Country 2025 & 2033
- Figure 25: South America Near Infrared Vein Visualization Device Revenue Share (%), by Country 2025 & 2033
- Figure 26: South America Near Infrared Vein Visualization Device Volume Share (%), by Country 2025 & 2033
- Figure 27: Europe Near Infrared Vein Visualization Device Revenue (undefined), by Application 2025 & 2033
- Figure 28: Europe Near Infrared Vein Visualization Device Volume (K), by Application 2025 & 2033
- Figure 29: Europe Near Infrared Vein Visualization Device Revenue Share (%), by Application 2025 & 2033
- Figure 30: Europe Near Infrared Vein Visualization Device Volume Share (%), by Application 2025 & 2033
- Figure 31: Europe Near Infrared Vein Visualization Device Revenue (undefined), by Type 2025 & 2033
- Figure 32: Europe Near Infrared Vein Visualization Device Volume (K), by Type 2025 & 2033
- Figure 33: Europe Near Infrared Vein Visualization Device Revenue Share (%), by Type 2025 & 2033
- Figure 34: Europe Near Infrared Vein Visualization Device Volume Share (%), by Type 2025 & 2033
- Figure 35: Europe Near Infrared Vein Visualization Device Revenue (undefined), by Country 2025 & 2033
- Figure 36: Europe Near Infrared Vein Visualization Device Volume (K), by Country 2025 & 2033
- Figure 37: Europe Near Infrared Vein Visualization Device Revenue Share (%), by Country 2025 & 2033
- Figure 38: Europe Near Infrared Vein Visualization Device Volume Share (%), by Country 2025 & 2033
- Figure 39: Middle East & Africa Near Infrared Vein Visualization Device Revenue (undefined), by Application 2025 & 2033
- Figure 40: Middle East & Africa Near Infrared Vein Visualization Device Volume (K), by Application 2025 & 2033
- Figure 41: Middle East & Africa Near Infrared Vein Visualization Device Revenue Share (%), by Application 2025 & 2033
- Figure 42: Middle East & Africa Near Infrared Vein Visualization Device Volume Share (%), by Application 2025 & 2033
- Figure 43: Middle East & Africa Near Infrared Vein Visualization Device Revenue (undefined), by Type 2025 & 2033
- Figure 44: Middle East & Africa Near Infrared Vein Visualization Device Volume (K), by Type 2025 & 2033
- Figure 45: Middle East & Africa Near Infrared Vein Visualization Device Revenue Share (%), by Type 2025 & 2033
- Figure 46: Middle East & Africa Near Infrared Vein Visualization Device Volume Share (%), by Type 2025 & 2033
- Figure 47: Middle East & Africa Near Infrared Vein Visualization Device Revenue (undefined), by Country 2025 & 2033
- Figure 48: Middle East & Africa Near Infrared Vein Visualization Device Volume (K), by Country 2025 & 2033
- Figure 49: Middle East & Africa Near Infrared Vein Visualization Device Revenue Share (%), by Country 2025 & 2033
- Figure 50: Middle East & Africa Near Infrared Vein Visualization Device Volume Share (%), by Country 2025 & 2033
- Figure 51: Asia Pacific Near Infrared Vein Visualization Device Revenue (undefined), by Application 2025 & 2033
- Figure 52: Asia Pacific Near Infrared Vein Visualization Device Volume (K), by Application 2025 & 2033
- Figure 53: Asia Pacific Near Infrared Vein Visualization Device Revenue Share (%), by Application 2025 & 2033
- Figure 54: Asia Pacific Near Infrared Vein Visualization Device Volume Share (%), by Application 2025 & 2033
- Figure 55: Asia Pacific Near Infrared Vein Visualization Device Revenue (undefined), by Type 2025 & 2033
- Figure 56: Asia Pacific Near Infrared Vein Visualization Device Volume (K), by Type 2025 & 2033
- Figure 57: Asia Pacific Near Infrared Vein Visualization Device Revenue Share (%), by Type 2025 & 2033
- Figure 58: Asia Pacific Near Infrared Vein Visualization Device Volume Share (%), by Type 2025 & 2033
- Figure 59: Asia Pacific Near Infrared Vein Visualization Device Revenue (undefined), by Country 2025 & 2033
- Figure 60: Asia Pacific Near Infrared Vein Visualization Device Volume (K), by Country 2025 & 2033
- Figure 61: Asia Pacific Near Infrared Vein Visualization Device Revenue Share (%), by Country 2025 & 2033
- Figure 62: Asia Pacific Near Infrared Vein Visualization Device Volume Share (%), by Country 2025 & 2033
List of Tables
- Table 1: Global Near Infrared Vein Visualization Device Revenue undefined Forecast, by Application 2020 & 2033
- Table 2: Global Near Infrared Vein Visualization Device Volume K Forecast, by Application 2020 & 2033
- Table 3: Global Near Infrared Vein Visualization Device Revenue undefined Forecast, by Type 2020 & 2033
- Table 4: Global Near Infrared Vein Visualization Device Volume K Forecast, by Type 2020 & 2033
- Table 5: Global Near Infrared Vein Visualization Device Revenue undefined Forecast, by Region 2020 & 2033
- Table 6: Global Near Infrared Vein Visualization Device Volume K Forecast, by Region 2020 & 2033
- Table 7: Global Near Infrared Vein Visualization Device Revenue undefined Forecast, by Application 2020 & 2033
- Table 8: Global Near Infrared Vein Visualization Device Volume K Forecast, by Application 2020 & 2033
- Table 9: Global Near Infrared Vein Visualization Device Revenue undefined Forecast, by Type 2020 & 2033
- Table 10: Global Near Infrared Vein Visualization Device Volume K Forecast, by Type 2020 & 2033
- Table 11: Global Near Infrared Vein Visualization Device Revenue undefined Forecast, by Country 2020 & 2033
- Table 12: Global Near Infrared Vein Visualization Device Volume K Forecast, by Country 2020 & 2033
- Table 13: United States Near Infrared Vein Visualization Device Revenue (undefined) Forecast, by Application 2020 & 2033
- Table 14: United States Near Infrared Vein Visualization Device Volume (K) Forecast, by Application 2020 & 2033
- Table 15: Canada Near Infrared Vein Visualization Device Revenue (undefined) Forecast, by Application 2020 & 2033
- Table 16: Canada Near Infrared Vein Visualization Device Volume (K) Forecast, by Application 2020 & 2033
- Table 17: Mexico Near Infrared Vein Visualization Device Revenue (undefined) Forecast, by Application 2020 & 2033
- Table 18: Mexico Near Infrared Vein Visualization Device Volume (K) Forecast, by Application 2020 & 2033
- Table 19: Global Near Infrared Vein Visualization Device Revenue undefined Forecast, by Application 2020 & 2033
- Table 20: Global Near Infrared Vein Visualization Device Volume K Forecast, by Application 2020 & 2033
- Table 21: Global Near Infrared Vein Visualization Device Revenue undefined Forecast, by Type 2020 & 2033
- Table 22: Global Near Infrared Vein Visualization Device Volume K Forecast, by Type 2020 & 2033
- Table 23: Global Near Infrared Vein Visualization Device Revenue undefined Forecast, by Country 2020 & 2033
- Table 24: Global Near Infrared Vein Visualization Device Volume K Forecast, by Country 2020 & 2033
- Table 25: Brazil Near Infrared Vein Visualization Device Revenue (undefined) Forecast, by Application 2020 & 2033
- Table 26: Brazil Near Infrared Vein Visualization Device Volume (K) Forecast, by Application 2020 & 2033
- Table 27: Argentina Near Infrared Vein Visualization Device Revenue (undefined) Forecast, by Application 2020 & 2033
- Table 28: Argentina Near Infrared Vein Visualization Device Volume (K) Forecast, by Application 2020 & 2033
- Table 29: Rest of South America Near Infrared Vein Visualization Device Revenue (undefined) Forecast, by Application 2020 & 2033
- Table 30: Rest of South America Near Infrared Vein Visualization Device Volume (K) Forecast, by Application 2020 & 2033
- Table 31: Global Near Infrared Vein Visualization Device Revenue undefined Forecast, by Application 2020 & 2033
- Table 32: Global Near Infrared Vein Visualization Device Volume K Forecast, by Application 2020 & 2033
- Table 33: Global Near Infrared Vein Visualization Device Revenue undefined Forecast, by Type 2020 & 2033
- Table 34: Global Near Infrared Vein Visualization Device Volume K Forecast, by Type 2020 & 2033
- Table 35: Global Near Infrared Vein Visualization Device Revenue undefined Forecast, by Country 2020 & 2033
- Table 36: Global Near Infrared Vein Visualization Device Volume K Forecast, by Country 2020 & 2033
- Table 37: United Kingdom Near Infrared Vein Visualization Device Revenue (undefined) Forecast, by Application 2020 & 2033
- Table 38: United Kingdom Near Infrared Vein Visualization Device Volume (K) Forecast, by Application 2020 & 2033
- Table 39: Germany Near Infrared Vein Visualization Device Revenue (undefined) Forecast, by Application 2020 & 2033
- Table 40: Germany Near Infrared Vein Visualization Device Volume (K) Forecast, by Application 2020 & 2033
- Table 41: France Near Infrared Vein Visualization Device Revenue (undefined) Forecast, by Application 2020 & 2033
- Table 42: France Near Infrared Vein Visualization Device Volume (K) Forecast, by Application 2020 & 2033
- Table 43: Italy Near Infrared Vein Visualization Device Revenue (undefined) Forecast, by Application 2020 & 2033
- Table 44: Italy Near Infrared Vein Visualization Device Volume (K) Forecast, by Application 2020 & 2033
- Table 45: Spain Near Infrared Vein Visualization Device Revenue (undefined) Forecast, by Application 2020 & 2033
- Table 46: Spain Near Infrared Vein Visualization Device Volume (K) Forecast, by Application 2020 & 2033
- Table 47: Russia Near Infrared Vein Visualization Device Revenue (undefined) Forecast, by Application 2020 & 2033
- Table 48: Russia Near Infrared Vein Visualization Device Volume (K) Forecast, by Application 2020 & 2033
- Table 49: Benelux Near Infrared Vein Visualization Device Revenue (undefined) Forecast, by Application 2020 & 2033
- Table 50: Benelux Near Infrared Vein Visualization Device Volume (K) Forecast, by Application 2020 & 2033
- Table 51: Nordics Near Infrared Vein Visualization Device Revenue (undefined) Forecast, by Application 2020 & 2033
- Table 52: Nordics Near Infrared Vein Visualization Device Volume (K) Forecast, by Application 2020 & 2033
- Table 53: Rest of Europe Near Infrared Vein Visualization Device Revenue (undefined) Forecast, by Application 2020 & 2033
- Table 54: Rest of Europe Near Infrared Vein Visualization Device Volume (K) Forecast, by Application 2020 & 2033
- Table 55: Global Near Infrared Vein Visualization Device Revenue undefined Forecast, by Application 2020 & 2033
- Table 56: Global Near Infrared Vein Visualization Device Volume K Forecast, by Application 2020 & 2033
- Table 57: Global Near Infrared Vein Visualization Device Revenue undefined Forecast, by Type 2020 & 2033
- Table 58: Global Near Infrared Vein Visualization Device Volume K Forecast, by Type 2020 & 2033
- Table 59: Global Near Infrared Vein Visualization Device Revenue undefined Forecast, by Country 2020 & 2033
- Table 60: Global Near Infrared Vein Visualization Device Volume K Forecast, by Country 2020 & 2033
- Table 61: Turkey Near Infrared Vein Visualization Device Revenue (undefined) Forecast, by Application 2020 & 2033
- Table 62: Turkey Near Infrared Vein Visualization Device Volume (K) Forecast, by Application 2020 & 2033
- Table 63: Israel Near Infrared Vein Visualization Device Revenue (undefined) Forecast, by Application 2020 & 2033
- Table 64: Israel Near Infrared Vein Visualization Device Volume (K) Forecast, by Application 2020 & 2033
- Table 65: GCC Near Infrared Vein Visualization Device Revenue (undefined) Forecast, by Application 2020 & 2033
- Table 66: GCC Near Infrared Vein Visualization Device Volume (K) Forecast, by Application 2020 & 2033
- Table 67: North Africa Near Infrared Vein Visualization Device Revenue (undefined) Forecast, by Application 2020 & 2033
- Table 68: North Africa Near Infrared Vein Visualization Device Volume (K) Forecast, by Application 2020 & 2033
- Table 69: South Africa Near Infrared Vein Visualization Device Revenue (undefined) Forecast, by Application 2020 & 2033
- Table 70: South Africa Near Infrared Vein Visualization Device Volume (K) Forecast, by Application 2020 & 2033
- Table 71: Rest of Middle East & Africa Near Infrared Vein Visualization Device Revenue (undefined) Forecast, by Application 2020 & 2033
- Table 72: Rest of Middle East & Africa Near Infrared Vein Visualization Device Volume (K) Forecast, by Application 2020 & 2033
- Table 73: Global Near Infrared Vein Visualization Device Revenue undefined Forecast, by Application 2020 & 2033
- Table 74: Global Near Infrared Vein Visualization Device Volume K Forecast, by Application 2020 & 2033
- Table 75: Global Near Infrared Vein Visualization Device Revenue undefined Forecast, by Type 2020 & 2033
- Table 76: Global Near Infrared Vein Visualization Device Volume K Forecast, by Type 2020 & 2033
- Table 77: Global Near Infrared Vein Visualization Device Revenue undefined Forecast, by Country 2020 & 2033
- Table 78: Global Near Infrared Vein Visualization Device Volume K Forecast, by Country 2020 & 2033
- Table 79: China Near Infrared Vein Visualization Device Revenue (undefined) Forecast, by Application 2020 & 2033
- Table 80: China Near Infrared Vein Visualization Device Volume (K) Forecast, by Application 2020 & 2033
- Table 81: India Near Infrared Vein Visualization Device Revenue (undefined) Forecast, by Application 2020 & 2033
- Table 82: India Near Infrared Vein Visualization Device Volume (K) Forecast, by Application 2020 & 2033
- Table 83: Japan Near Infrared Vein Visualization Device Revenue (undefined) Forecast, by Application 2020 & 2033
- Table 84: Japan Near Infrared Vein Visualization Device Volume (K) Forecast, by Application 2020 & 2033
- Table 85: South Korea Near Infrared Vein Visualization Device Revenue (undefined) Forecast, by Application 2020 & 2033
- Table 86: South Korea Near Infrared Vein Visualization Device Volume (K) Forecast, by Application 2020 & 2033
- Table 87: ASEAN Near Infrared Vein Visualization Device Revenue (undefined) Forecast, by Application 2020 & 2033
- Table 88: ASEAN Near Infrared Vein Visualization Device Volume (K) Forecast, by Application 2020 & 2033
- Table 89: Oceania Near Infrared Vein Visualization Device Revenue (undefined) Forecast, by Application 2020 & 2033
- Table 90: Oceania Near Infrared Vein Visualization Device Volume (K) Forecast, by Application 2020 & 2033
- Table 91: Rest of Asia Pacific Near Infrared Vein Visualization Device Revenue (undefined) Forecast, by Application 2020 & 2033
- Table 92: Rest of Asia Pacific Near Infrared Vein Visualization Device Volume (K) Forecast, by Application 2020 & 2033
Frequently Asked Questions
1. What is the projected Compound Annual Growth Rate (CAGR) of the Near Infrared Vein Visualization Device?
The projected CAGR is approximately 3.4%.
2. Which companies are prominent players in the Near Infrared Vein Visualization Device?
Key companies in the market include AccuVein, Inc, B. Braun, BD, Christie Medical, Koninklijke Philips, Near Infrared Imaging, Teleflex Incorporated, Venoscope, VINO Optics.
3. What are the main segments of the Near Infrared Vein Visualization Device?
The market segments include Application, Type.
4. Can you provide details about the market size?
The market size is estimated to be USD XXX N/A as of 2022.
5. What are some drivers contributing to market growth?
N/A
6. What are the notable trends driving market growth?
N/A
7. Are there any restraints impacting market growth?
N/A
8. Can you provide examples of recent developments in the market?
N/A
9. What pricing options are available for accessing the report?
Pricing options include single-user, multi-user, and enterprise licenses priced at USD 3950.00, USD 5925.00, and USD 7900.00 respectively.
10. Is the market size provided in terms of value or volume?
The market size is provided in terms of value, measured in N/A and volume, measured in K.
11. Are there any specific market keywords associated with the report?
Yes, the market keyword associated with the report is "Near Infrared Vein Visualization Device," which aids in identifying and referencing the specific market segment covered.
12. How do I determine which pricing option suits my needs best?
The pricing options vary based on user requirements and access needs. Individual users may opt for single-user licenses, while businesses requiring broader access may choose multi-user or enterprise licenses for cost-effective access to the report.
13. Are there any additional resources or data provided in the Near Infrared Vein Visualization Device report?
While the report offers comprehensive insights, it's advisable to review the specific contents or supplementary materials provided to ascertain if additional resources or data are available.
14. How can I stay updated on further developments or reports in the Near Infrared Vein Visualization Device?
To stay informed about further developments, trends, and reports in the Near Infrared Vein Visualization Device, consider subscribing to industry newsletters, following relevant companies and organizations, or regularly checking reputable industry news sources and publications.
Methodology
Step 1 - Identification of Relevant Samples Size from Population Database


Step 2 - Approaches for Defining Global Market Size (Value, Volume* & Price*)

Note*: In applicable scenarios
Step 3 - Data Sources
Primary Research
- Web Analytics
- Survey Reports
- Research Institute
- Latest Research Reports
- Opinion Leaders
Secondary Research
- Annual Reports
- White Paper
- Latest Press Release
- Industry Association
- Paid Database
- Investor Presentations

Step 4 - Data Triangulation
Involves using different sources of information in order to increase the validity of a study
These sources are likely to be stakeholders in a program - participants, other researchers, program staff, other community members, and so on.
Then we put all data in single framework & apply various statistical tools to find out the dynamic on the market.
During the analysis stage, feedback from the stakeholder groups would be compared to determine areas of agreement as well as areas of divergence