

Key Insights
The Monoclonal Antibody Service market is projected to reach an estimated $9423 million in 2025, demonstrating a steady Compound Annual Growth Rate (CAGR) of 2.9% through 2033. This growth is primarily fueled by the escalating demand for targeted therapies in oncology, autoimmune diseases, and infectious diseases, where monoclonal antibodies (mAbs) have become indispensable. The increasing prevalence of chronic conditions worldwide, coupled with advancements in biopharmaceutical research and development, is creating a robust pipeline of mAb-based therapeutics and diagnostics. Consequently, pharmaceutical and biotechnology companies, alongside research and academic institutions, are heavily investing in specialized services for antibody discovery, development, characterization, and manufacturing. Diagnostic laboratories are also a significant segment, leveraging mAbs for accurate disease detection and monitoring. The consistent innovation in antibody engineering and production technologies further underpins the market's expansion.
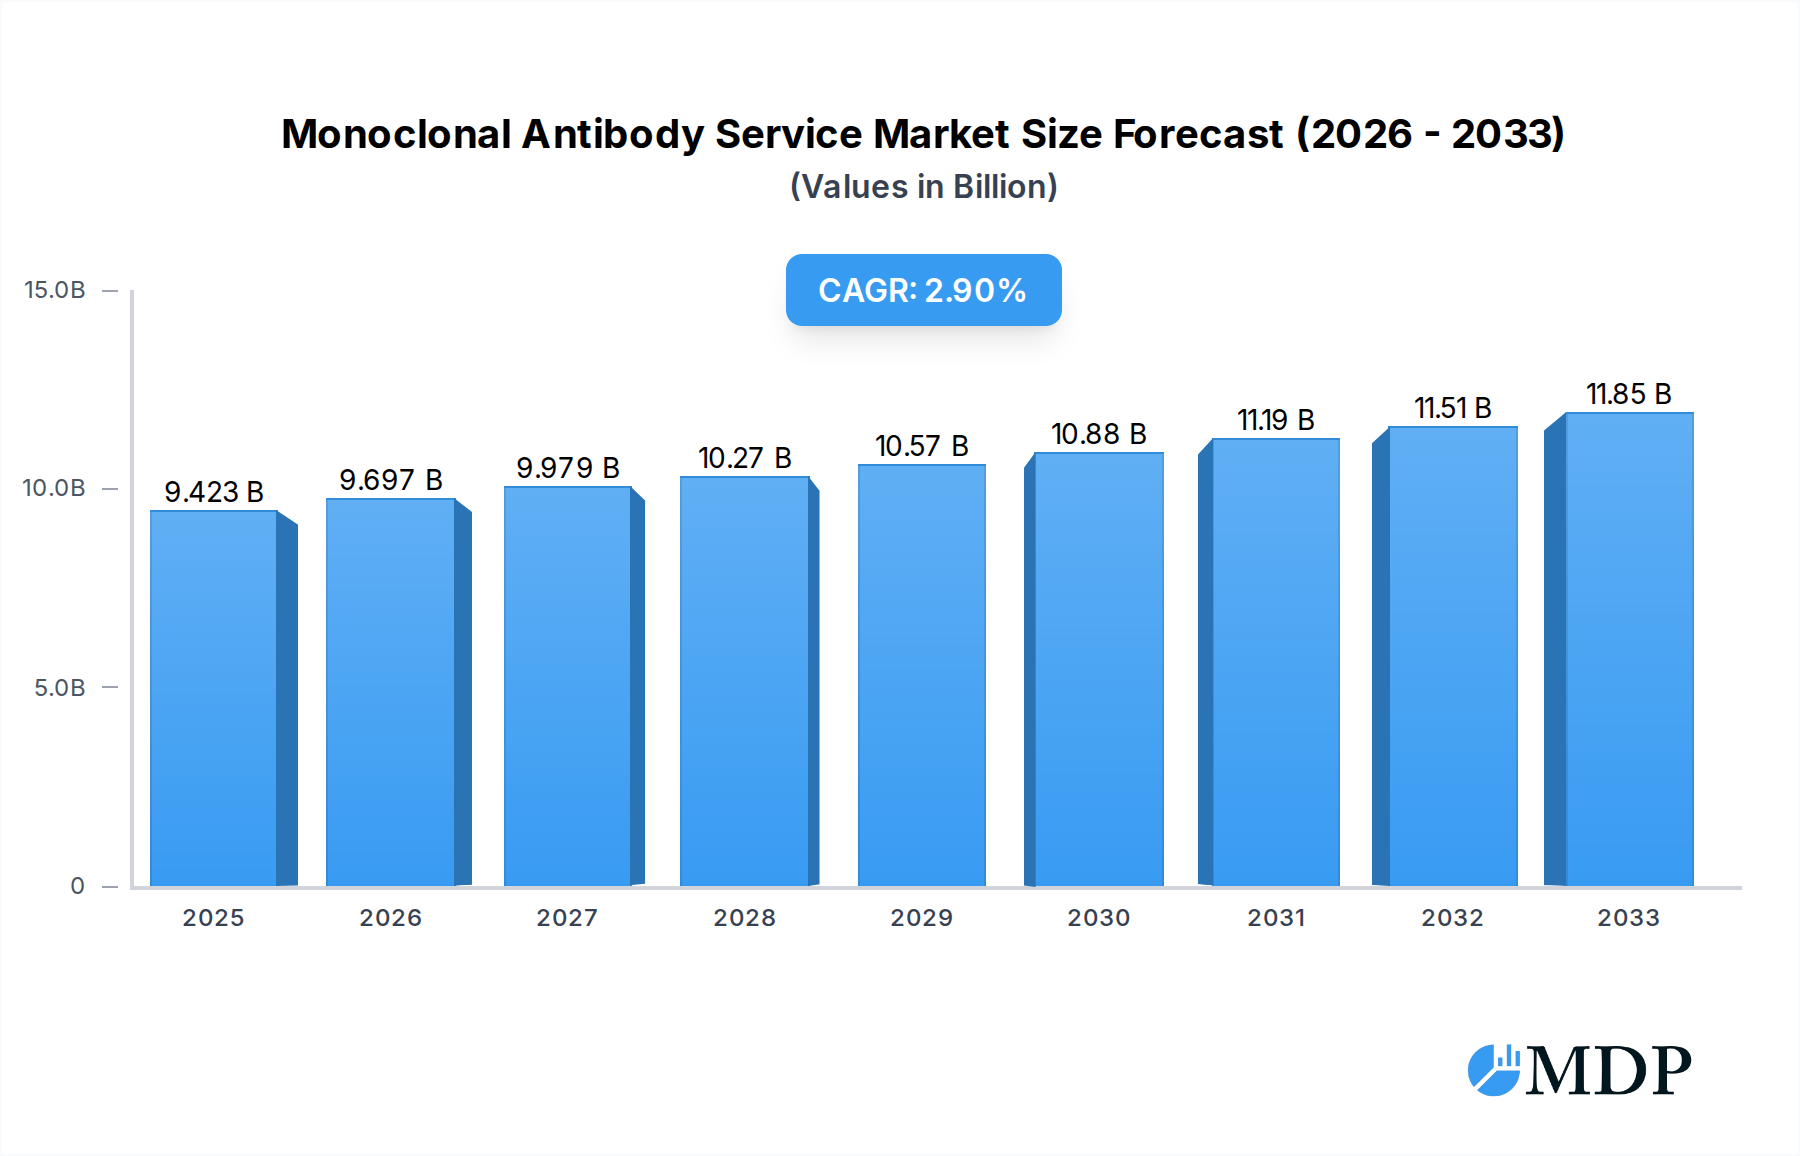
Monoclonal Antibody Service Market Size (In Billion)
Key drivers for this market include the expanding therapeutic applications of monoclonal antibodies across a wider spectrum of diseases, including rare genetic disorders and neurodegenerative conditions. The growing outsourcing trend within the biopharmaceutical industry, with companies opting for specialized Contract Development and Manufacturing Organizations (CDMOs) and Contract Research Organizations (CROs) for their mAb needs, is another crucial factor. This allows for greater efficiency, cost-effectiveness, and access to cutting-edge expertise. Emerging markets, particularly in the Asia Pacific region, are exhibiting significant growth potential due to increasing healthcare expenditure and a rising burden of diseases. While the market is robust, potential restraints could include the high cost of development and manufacturing, stringent regulatory hurdles, and the emergence of alternative therapeutic modalities. However, the proven efficacy and therapeutic success of mAbs continue to solidify their importance, ensuring sustained market momentum.

Monoclonal Antibody Service Company Market Share
This in-depth report provides a definitive analysis of the Monoclonal Antibody (mAb) Service market, a critical and rapidly expanding sector within the life sciences industry. Delving into its intricate dynamics from 2019 through 2033, with a focused base year of 2025 and an extended forecast period of 2025–2033, this report offers actionable intelligence for pharmaceutical & biotechnology companies, diagnostic laboratories, research institutions, and investors seeking to capitalize on this burgeoning field.
Monoclonal Antibody Service Market Dynamics & Concentration
The monoclonal antibody service market exhibits a moderate to high concentration, driven by a complex interplay of innovation, stringent regulatory frameworks, and significant capital investment. Key innovation drivers include advancements in protein engineering, high-throughput screening, and the increasing demand for targeted therapies. Regulatory bodies like the FDA and EMA play a pivotal role, shaping product development and market entry strategies. While direct product substitutes are limited, alternative therapeutic modalities are continuously emerging, necessitating ongoing innovation within the mAb space. End-user trends indicate a strong preference for customized and scalable mAb production solutions, with pharmaceutical & biotechnology companies representing the largest segment of end-users. Mergers & Acquisitions (M&A) activity is a significant factor in market consolidation, with an estimated XX major deals in the historical period. Leading players like Pfizer, Roche, Eli Lilly, Bayer, Amgen, Sanofi-Aventis, Johnson & Johnson, Novo Nordisk, Merck, Abbott Laboratories, GSK, BMS, Alexion, UCB, and Seattle Genetics collectively hold a substantial market share, estimated to be over 70%.
Monoclonal Antibody Service Industry Trends & Analysis
The monoclonal antibody service industry is poised for robust growth, with a projected Compound Annual Growth Rate (CAGR) of XX% over the forecast period. This expansion is fueled by several key market growth drivers, including the escalating prevalence of chronic diseases such as cancer, autoimmune disorders, and infectious diseases, all of which benefit from targeted mAb therapies. Technological disruptions, such as advancements in continuous manufacturing, single-use bioreactors, and artificial intelligence for antibody design and discovery, are further accelerating the industry's progress. Consumer preferences are increasingly leaning towards personalized medicine, making mAbs a cornerstone of tailored treatment regimens. The competitive dynamics within the market are characterized by intense R&D investment, strategic partnerships, and a focus on developing novel mAb formats and delivery systems. Market penetration for mAb-based therapies continues to rise, particularly in oncology and immunology, driven by demonstrated efficacy and improved patient outcomes. The increasing outsourcing of mAb development and manufacturing by Pharmaceutical & Biotechnology Companies also contributes significantly to the growth of the service sector. The global market size for monoclonal antibody services is expected to reach XX million by 2025 and is projected to grow to XX million by 2033.
Leading Markets & Segments in Monoclonal Antibody Service
The Pharmaceutical & Biotechnology Companies segment dominates the monoclonal antibody service market, driven by their extensive pipelines of mAb-based drug candidates and the significant investment in their development and manufacturing. This segment accounts for an estimated XX% of the total market revenue. Within this segment, the application in Drugs represents the largest sub-segment, reflecting the primary use of mAbs as therapeutic agents. The Diagnostic Laboratories segment is also experiencing steady growth, fueled by the increasing demand for accurate and sensitive diagnostic tools, particularly in areas like oncology and infectious disease detection. Research & Academic Laboratories represent a crucial segment for early-stage discovery and validation of new mAb targets and applications.
Geographically, North America is the leading market for monoclonal antibody services, driven by a robust healthcare infrastructure, substantial R&D funding, and a high prevalence of target diseases. The United States, in particular, boasts a highly developed pharmaceutical and biotechnology ecosystem, supporting significant demand for mAb services. The economic policies that favor innovation and the strong presence of leading pharmaceutical companies further bolster its market dominance. In terms of type, Reagents, which include antibodies for research and diagnostics, form a significant portion of the market, followed closely by Drugs for therapeutic applications. The Other category encompasses a range of specialized services such as antibody engineering, formulation, and preclinical testing.
Monoclonal Antibody Service Product Developments
Product developments in the monoclonal antibody service market are characterized by a relentless pursuit of enhanced efficacy, safety, and specificity. Innovations span novel antibody formats like bispecific antibodies and antibody-drug conjugates (ADCs), offering improved targeting and reduced off-target effects. Advancements in expression systems and purification techniques are leading to higher yields and greater purity of therapeutic mAbs. The competitive advantage lies in providing clients with end-to-end solutions, from initial discovery and engineering to large-scale manufacturing, ensuring seamless integration into drug development pipelines. The focus on precision medicine continues to drive the development of highly targeted mAbs for various therapeutic indications.
Key Drivers of Monoclonal Antibody Service Growth
The growth of the monoclonal antibody service market is propelled by several key factors. Technological advancements in areas like hybridoma technology, phage display, and recombinant DNA technology have revolutionized antibody discovery and production. Economic factors, including increasing healthcare expenditure globally and rising investment in biopharmaceutical R&D, are significant growth accelerators. Furthermore, favorable regulatory frameworks that expedite the approval of novel mAb-based therapies and the growing demand for personalized medicine further fuel market expansion. The increasing prevalence of chronic diseases, such as cancer and autoimmune disorders, also presents a substantial driver for mAb development and service utilization.
Challenges in the Monoclonal Antibody Service Market
Despite its promising growth, the monoclonal antibody service market faces several challenges. Regulatory hurdles, including stringent approval processes and evolving guidelines for biologics, can lead to extended development timelines and increased costs. Supply chain complexities for raw materials and specialized equipment can impact production efficiency and lead to delays. Intense competitive pressures from both established players and emerging biotech firms necessitate continuous innovation and cost optimization. The high cost associated with mAb development and manufacturing can also be a restraint, particularly for smaller research institutions and developing economies.
Emerging Opportunities in Monoclonal Antibody Service
Emerging opportunities in the monoclonal antibody service market are abundant, driven by continuous scientific breakthroughs and evolving healthcare needs. Technological breakthroughs in areas such as gene editing, synthetic biology, and AI-driven antibody design are opening new avenues for developing more effective and targeted therapies. Strategic partnerships between service providers and pharmaceutical companies are crucial for accelerating drug development and market access. Furthermore, market expansion strategies into underserved geographic regions and the exploration of novel therapeutic applications beyond traditional oncology and immunology present significant long-term growth potential. The rise of biosimil development also creates a substantial opportunity for specialized contract manufacturing organizations.
Leading Players in the Monoclonal Antibody Service Sector
- Pfizer
- Roche
- Eli Lilly
- Bayer
- Amgen
- Sanofi-Aventis
- Johnson & Johnson
- Novo Nordisk
- Merck
- Abbott Laboratories
- GSK
- BMS
- Alexion
- UCB
- Seattle Genetics
Key Milestones in Monoclonal Antibody Service Industry
- 2019: Launch of several novel bispecific antibody therapies for oncology, expanding therapeutic applications.
- 2020: Accelerated development and regulatory approvals of mAb-based treatments for COVID-19, demonstrating the rapid response capabilities of the industry.
- 2021: Increased adoption of single-use bioreactor technology, improving flexibility and reducing contamination risks in mAb manufacturing.
- 2022: Significant investment in AI and machine learning for antibody discovery and engineering, leading to more efficient candidate selection.
- 2023: Growing focus on developing Antibody-Drug Conjugates (ADCs) with improved payload delivery systems.
- 2024: Expansion of contract development and manufacturing organization (CDMO) capacity to meet the growing demand for biologic production.
Strategic Outlook for Monoclonal Antibody Service Market
The strategic outlook for the monoclonal antibody service market is overwhelmingly positive, characterized by sustained growth and innovation. Key growth accelerators include the continued expansion of targeted therapies for a widening array of diseases, advancements in manufacturing technologies leading to greater efficiency and cost-effectiveness, and the increasing trend of outsourcing by pharmaceutical companies. The burgeoning field of personalized medicine will further cement the importance of mAb services. Companies that invest in cutting-edge technologies, forge strategic alliances, and maintain a strong focus on quality and regulatory compliance will be best positioned to capitalize on the immense future market potential.
Monoclonal Antibody Service Segmentation
-
1. Application
- 1.1. Diagnostic Laboratories
- 1.2. Research & Academic Laboratories
- 1.3. Pharmaceutical & Biotechnology Companies
-
2. Type
- 2.1. Reagents
- 2.2. Drugs
- 2.3. Other
Monoclonal Antibody Service Segmentation By Geography
-
1. North America
- 1.1. United States
- 1.2. Canada
- 1.3. Mexico
-
2. South America
- 2.1. Brazil
- 2.2. Argentina
- 2.3. Rest of South America
-
3. Europe
- 3.1. United Kingdom
- 3.2. Germany
- 3.3. France
- 3.4. Italy
- 3.5. Spain
- 3.6. Russia
- 3.7. Benelux
- 3.8. Nordics
- 3.9. Rest of Europe
-
4. Middle East & Africa
- 4.1. Turkey
- 4.2. Israel
- 4.3. GCC
- 4.4. North Africa
- 4.5. South Africa
- 4.6. Rest of Middle East & Africa
-
5. Asia Pacific
- 5.1. China
- 5.2. India
- 5.3. Japan
- 5.4. South Korea
- 5.5. ASEAN
- 5.6. Oceania
- 5.7. Rest of Asia Pacific
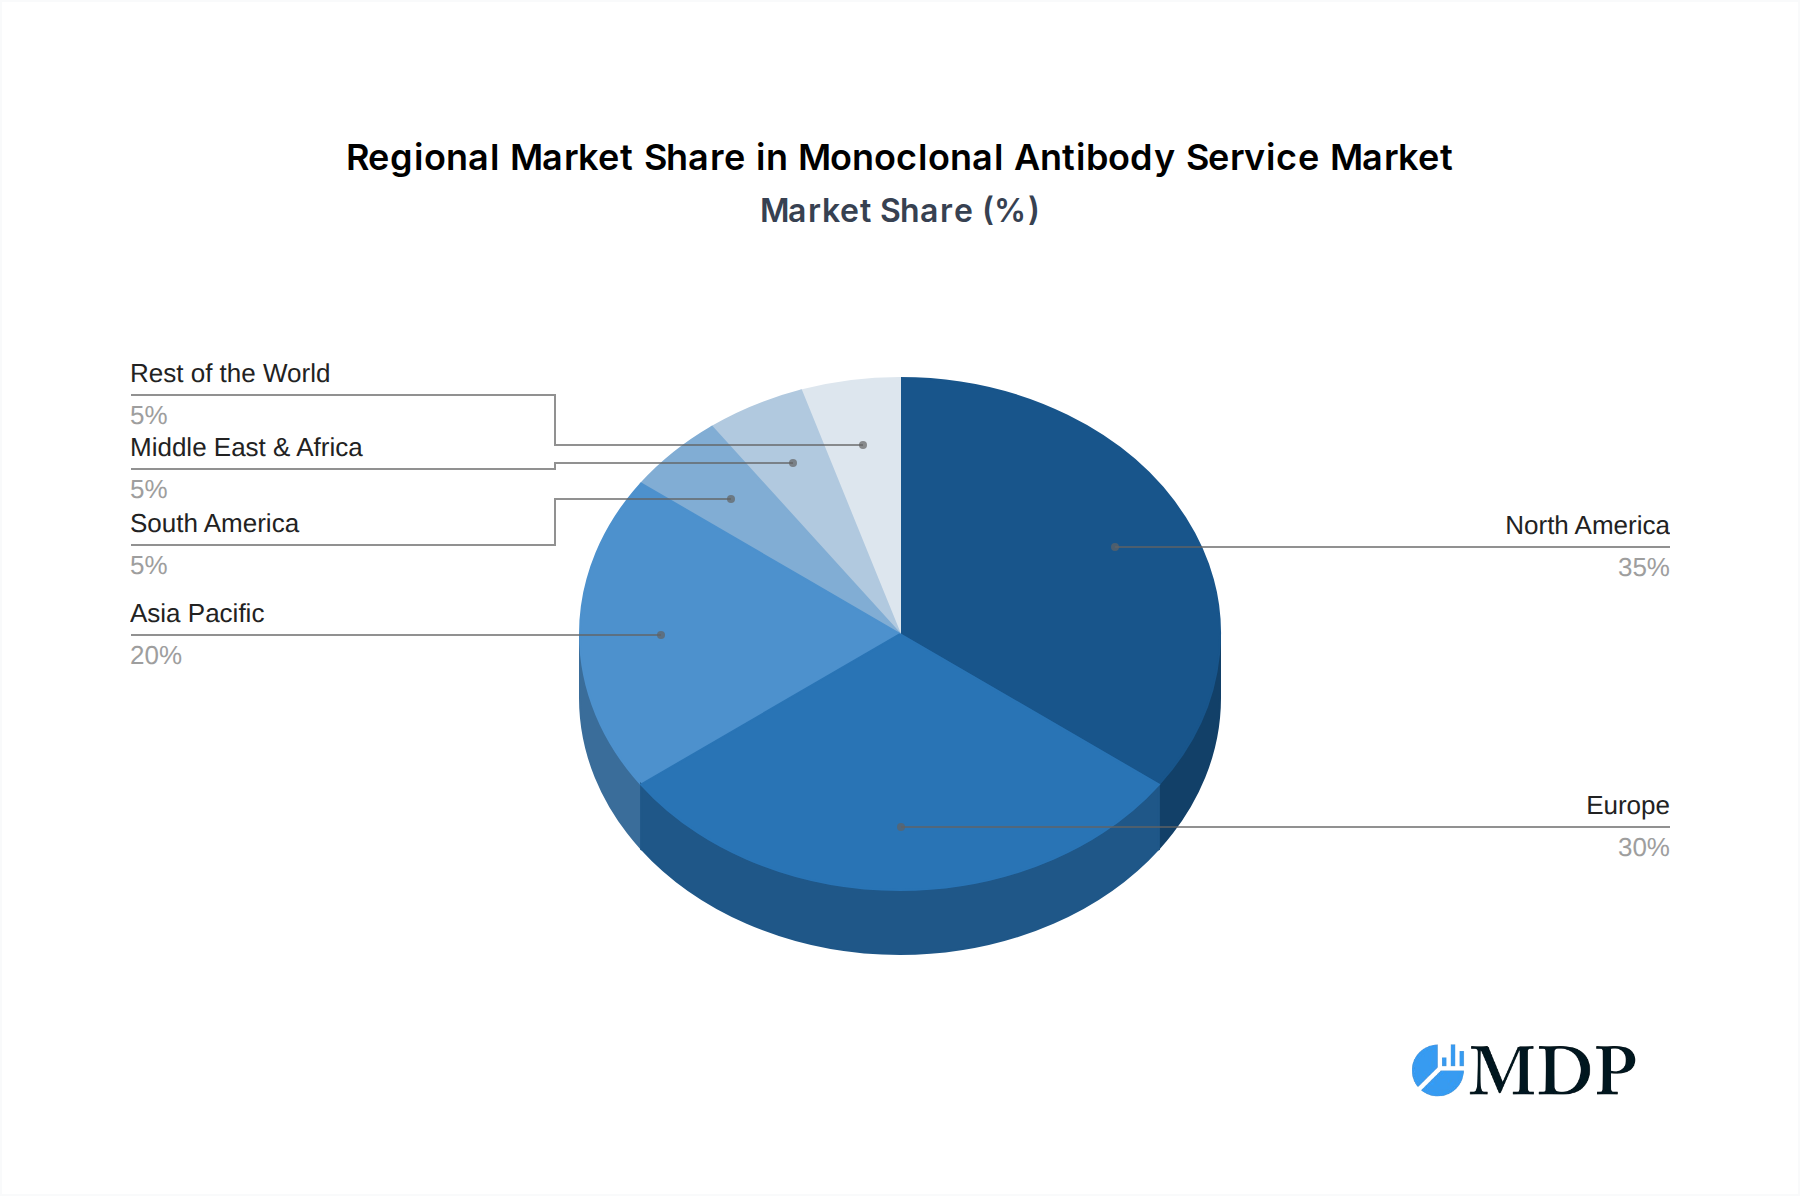
Monoclonal Antibody Service Regional Market Share
Geographic Coverage of Monoclonal Antibody Service
Monoclonal Antibody Service REPORT HIGHLIGHTS
| Aspects | Details |
|---|---|
| Study Period | 2020-2034 |
| Base Year | 2025 |
| Estimated Year | 2026 |
| Forecast Period | 2026-2034 |
| Historical Period | 2020-2025 |
| Growth Rate | CAGR of 2.9% from 2020-2034 |
| Segmentation |
|
Table of Contents
- 1. Introduction
- 1.1. Research Scope
- 1.2. Market Segmentation
- 1.3. Research Methodology
- 1.4. Definitions and Assumptions
- 2. Executive Summary
- 2.1. Introduction
- 3. Market Dynamics
- 3.1. Introduction
- 3.2. Market Drivers
- 3.3. Market Restrains
- 3.4. Market Trends
- 4. Market Factor Analysis
- 4.1. Porters Five Forces
- 4.2. Supply/Value Chain
- 4.3. PESTEL analysis
- 4.4. Market Entropy
- 4.5. Patent/Trademark Analysis
- 5. Global Monoclonal Antibody Service Analysis, Insights and Forecast, 2020-2032
- 5.1. Market Analysis, Insights and Forecast - by Application
- 5.1.1. Diagnostic Laboratories
- 5.1.2. Research & Academic Laboratories
- 5.1.3. Pharmaceutical & Biotechnology Companies
- 5.2. Market Analysis, Insights and Forecast - by Type
- 5.2.1. Reagents
- 5.2.2. Drugs
- 5.2.3. Other
- 5.3. Market Analysis, Insights and Forecast - by Region
- 5.3.1. North America
- 5.3.2. South America
- 5.3.3. Europe
- 5.3.4. Middle East & Africa
- 5.3.5. Asia Pacific
- 5.1. Market Analysis, Insights and Forecast - by Application
- 6. North America Monoclonal Antibody Service Analysis, Insights and Forecast, 2020-2032
- 6.1. Market Analysis, Insights and Forecast - by Application
- 6.1.1. Diagnostic Laboratories
- 6.1.2. Research & Academic Laboratories
- 6.1.3. Pharmaceutical & Biotechnology Companies
- 6.2. Market Analysis, Insights and Forecast - by Type
- 6.2.1. Reagents
- 6.2.2. Drugs
- 6.2.3. Other
- 6.1. Market Analysis, Insights and Forecast - by Application
- 7. South America Monoclonal Antibody Service Analysis, Insights and Forecast, 2020-2032
- 7.1. Market Analysis, Insights and Forecast - by Application
- 7.1.1. Diagnostic Laboratories
- 7.1.2. Research & Academic Laboratories
- 7.1.3. Pharmaceutical & Biotechnology Companies
- 7.2. Market Analysis, Insights and Forecast - by Type
- 7.2.1. Reagents
- 7.2.2. Drugs
- 7.2.3. Other
- 7.1. Market Analysis, Insights and Forecast - by Application
- 8. Europe Monoclonal Antibody Service Analysis, Insights and Forecast, 2020-2032
- 8.1. Market Analysis, Insights and Forecast - by Application
- 8.1.1. Diagnostic Laboratories
- 8.1.2. Research & Academic Laboratories
- 8.1.3. Pharmaceutical & Biotechnology Companies
- 8.2. Market Analysis, Insights and Forecast - by Type
- 8.2.1. Reagents
- 8.2.2. Drugs
- 8.2.3. Other
- 8.1. Market Analysis, Insights and Forecast - by Application
- 9. Middle East & Africa Monoclonal Antibody Service Analysis, Insights and Forecast, 2020-2032
- 9.1. Market Analysis, Insights and Forecast - by Application
- 9.1.1. Diagnostic Laboratories
- 9.1.2. Research & Academic Laboratories
- 9.1.3. Pharmaceutical & Biotechnology Companies
- 9.2. Market Analysis, Insights and Forecast - by Type
- 9.2.1. Reagents
- 9.2.2. Drugs
- 9.2.3. Other
- 9.1. Market Analysis, Insights and Forecast - by Application
- 10. Asia Pacific Monoclonal Antibody Service Analysis, Insights and Forecast, 2020-2032
- 10.1. Market Analysis, Insights and Forecast - by Application
- 10.1.1. Diagnostic Laboratories
- 10.1.2. Research & Academic Laboratories
- 10.1.3. Pharmaceutical & Biotechnology Companies
- 10.2. Market Analysis, Insights and Forecast - by Type
- 10.2.1. Reagents
- 10.2.2. Drugs
- 10.2.3. Other
- 10.1. Market Analysis, Insights and Forecast - by Application
- 11. Competitive Analysis
- 11.1. Global Market Share Analysis 2025
- 11.2. Company Profiles
- 11.2.1 Pfizer
- 11.2.1.1. Overview
- 11.2.1.2. Products
- 11.2.1.3. SWOT Analysis
- 11.2.1.4. Recent Developments
- 11.2.1.5. Financials (Based on Availability)
- 11.2.2 Roche
- 11.2.2.1. Overview
- 11.2.2.2. Products
- 11.2.2.3. SWOT Analysis
- 11.2.2.4. Recent Developments
- 11.2.2.5. Financials (Based on Availability)
- 11.2.3 Eli Lilly
- 11.2.3.1. Overview
- 11.2.3.2. Products
- 11.2.3.3. SWOT Analysis
- 11.2.3.4. Recent Developments
- 11.2.3.5. Financials (Based on Availability)
- 11.2.4 Bayer
- 11.2.4.1. Overview
- 11.2.4.2. Products
- 11.2.4.3. SWOT Analysis
- 11.2.4.4. Recent Developments
- 11.2.4.5. Financials (Based on Availability)
- 11.2.5 Amgen
- 11.2.5.1. Overview
- 11.2.5.2. Products
- 11.2.5.3. SWOT Analysis
- 11.2.5.4. Recent Developments
- 11.2.5.5. Financials (Based on Availability)
- 11.2.6 Sanofi-Aventis
- 11.2.6.1. Overview
- 11.2.6.2. Products
- 11.2.6.3. SWOT Analysis
- 11.2.6.4. Recent Developments
- 11.2.6.5. Financials (Based on Availability)
- 11.2.7 Johnson & Johnson
- 11.2.7.1. Overview
- 11.2.7.2. Products
- 11.2.7.3. SWOT Analysis
- 11.2.7.4. Recent Developments
- 11.2.7.5. Financials (Based on Availability)
- 11.2.8 Novo Nordisk
- 11.2.8.1. Overview
- 11.2.8.2. Products
- 11.2.8.3. SWOT Analysis
- 11.2.8.4. Recent Developments
- 11.2.8.5. Financials (Based on Availability)
- 11.2.9 Merck
- 11.2.9.1. Overview
- 11.2.9.2. Products
- 11.2.9.3. SWOT Analysis
- 11.2.9.4. Recent Developments
- 11.2.9.5. Financials (Based on Availability)
- 11.2.10 Abbott Laboratories
- 11.2.10.1. Overview
- 11.2.10.2. Products
- 11.2.10.3. SWOT Analysis
- 11.2.10.4. Recent Developments
- 11.2.10.5. Financials (Based on Availability)
- 11.2.11 GSK
- 11.2.11.1. Overview
- 11.2.11.2. Products
- 11.2.11.3. SWOT Analysis
- 11.2.11.4. Recent Developments
- 11.2.11.5. Financials (Based on Availability)
- 11.2.12 BMS
- 11.2.12.1. Overview
- 11.2.12.2. Products
- 11.2.12.3. SWOT Analysis
- 11.2.12.4. Recent Developments
- 11.2.12.5. Financials (Based on Availability)
- 11.2.13 Alexion
- 11.2.13.1. Overview
- 11.2.13.2. Products
- 11.2.13.3. SWOT Analysis
- 11.2.13.4. Recent Developments
- 11.2.13.5. Financials (Based on Availability)
- 11.2.14 UCB
- 11.2.14.1. Overview
- 11.2.14.2. Products
- 11.2.14.3. SWOT Analysis
- 11.2.14.4. Recent Developments
- 11.2.14.5. Financials (Based on Availability)
- 11.2.15 Seattle Genetics
- 11.2.15.1. Overview
- 11.2.15.2. Products
- 11.2.15.3. SWOT Analysis
- 11.2.15.4. Recent Developments
- 11.2.15.5. Financials (Based on Availability)
- 11.2.1 Pfizer
List of Figures
- Figure 1: Global Monoclonal Antibody Service Revenue Breakdown (million, %) by Region 2025 & 2033
- Figure 2: North America Monoclonal Antibody Service Revenue (million), by Application 2025 & 2033
- Figure 3: North America Monoclonal Antibody Service Revenue Share (%), by Application 2025 & 2033
- Figure 4: North America Monoclonal Antibody Service Revenue (million), by Type 2025 & 2033
- Figure 5: North America Monoclonal Antibody Service Revenue Share (%), by Type 2025 & 2033
- Figure 6: North America Monoclonal Antibody Service Revenue (million), by Country 2025 & 2033
- Figure 7: North America Monoclonal Antibody Service Revenue Share (%), by Country 2025 & 2033
- Figure 8: South America Monoclonal Antibody Service Revenue (million), by Application 2025 & 2033
- Figure 9: South America Monoclonal Antibody Service Revenue Share (%), by Application 2025 & 2033
- Figure 10: South America Monoclonal Antibody Service Revenue (million), by Type 2025 & 2033
- Figure 11: South America Monoclonal Antibody Service Revenue Share (%), by Type 2025 & 2033
- Figure 12: South America Monoclonal Antibody Service Revenue (million), by Country 2025 & 2033
- Figure 13: South America Monoclonal Antibody Service Revenue Share (%), by Country 2025 & 2033
- Figure 14: Europe Monoclonal Antibody Service Revenue (million), by Application 2025 & 2033
- Figure 15: Europe Monoclonal Antibody Service Revenue Share (%), by Application 2025 & 2033
- Figure 16: Europe Monoclonal Antibody Service Revenue (million), by Type 2025 & 2033
- Figure 17: Europe Monoclonal Antibody Service Revenue Share (%), by Type 2025 & 2033
- Figure 18: Europe Monoclonal Antibody Service Revenue (million), by Country 2025 & 2033
- Figure 19: Europe Monoclonal Antibody Service Revenue Share (%), by Country 2025 & 2033
- Figure 20: Middle East & Africa Monoclonal Antibody Service Revenue (million), by Application 2025 & 2033
- Figure 21: Middle East & Africa Monoclonal Antibody Service Revenue Share (%), by Application 2025 & 2033
- Figure 22: Middle East & Africa Monoclonal Antibody Service Revenue (million), by Type 2025 & 2033
- Figure 23: Middle East & Africa Monoclonal Antibody Service Revenue Share (%), by Type 2025 & 2033
- Figure 24: Middle East & Africa Monoclonal Antibody Service Revenue (million), by Country 2025 & 2033
- Figure 25: Middle East & Africa Monoclonal Antibody Service Revenue Share (%), by Country 2025 & 2033
- Figure 26: Asia Pacific Monoclonal Antibody Service Revenue (million), by Application 2025 & 2033
- Figure 27: Asia Pacific Monoclonal Antibody Service Revenue Share (%), by Application 2025 & 2033
- Figure 28: Asia Pacific Monoclonal Antibody Service Revenue (million), by Type 2025 & 2033
- Figure 29: Asia Pacific Monoclonal Antibody Service Revenue Share (%), by Type 2025 & 2033
- Figure 30: Asia Pacific Monoclonal Antibody Service Revenue (million), by Country 2025 & 2033
- Figure 31: Asia Pacific Monoclonal Antibody Service Revenue Share (%), by Country 2025 & 2033
List of Tables
- Table 1: Global Monoclonal Antibody Service Revenue million Forecast, by Application 2020 & 2033
- Table 2: Global Monoclonal Antibody Service Revenue million Forecast, by Type 2020 & 2033
- Table 3: Global Monoclonal Antibody Service Revenue million Forecast, by Region 2020 & 2033
- Table 4: Global Monoclonal Antibody Service Revenue million Forecast, by Application 2020 & 2033
- Table 5: Global Monoclonal Antibody Service Revenue million Forecast, by Type 2020 & 2033
- Table 6: Global Monoclonal Antibody Service Revenue million Forecast, by Country 2020 & 2033
- Table 7: United States Monoclonal Antibody Service Revenue (million) Forecast, by Application 2020 & 2033
- Table 8: Canada Monoclonal Antibody Service Revenue (million) Forecast, by Application 2020 & 2033
- Table 9: Mexico Monoclonal Antibody Service Revenue (million) Forecast, by Application 2020 & 2033
- Table 10: Global Monoclonal Antibody Service Revenue million Forecast, by Application 2020 & 2033
- Table 11: Global Monoclonal Antibody Service Revenue million Forecast, by Type 2020 & 2033
- Table 12: Global Monoclonal Antibody Service Revenue million Forecast, by Country 2020 & 2033
- Table 13: Brazil Monoclonal Antibody Service Revenue (million) Forecast, by Application 2020 & 2033
- Table 14: Argentina Monoclonal Antibody Service Revenue (million) Forecast, by Application 2020 & 2033
- Table 15: Rest of South America Monoclonal Antibody Service Revenue (million) Forecast, by Application 2020 & 2033
- Table 16: Global Monoclonal Antibody Service Revenue million Forecast, by Application 2020 & 2033
- Table 17: Global Monoclonal Antibody Service Revenue million Forecast, by Type 2020 & 2033
- Table 18: Global Monoclonal Antibody Service Revenue million Forecast, by Country 2020 & 2033
- Table 19: United Kingdom Monoclonal Antibody Service Revenue (million) Forecast, by Application 2020 & 2033
- Table 20: Germany Monoclonal Antibody Service Revenue (million) Forecast, by Application 2020 & 2033
- Table 21: France Monoclonal Antibody Service Revenue (million) Forecast, by Application 2020 & 2033
- Table 22: Italy Monoclonal Antibody Service Revenue (million) Forecast, by Application 2020 & 2033
- Table 23: Spain Monoclonal Antibody Service Revenue (million) Forecast, by Application 2020 & 2033
- Table 24: Russia Monoclonal Antibody Service Revenue (million) Forecast, by Application 2020 & 2033
- Table 25: Benelux Monoclonal Antibody Service Revenue (million) Forecast, by Application 2020 & 2033
- Table 26: Nordics Monoclonal Antibody Service Revenue (million) Forecast, by Application 2020 & 2033
- Table 27: Rest of Europe Monoclonal Antibody Service Revenue (million) Forecast, by Application 2020 & 2033
- Table 28: Global Monoclonal Antibody Service Revenue million Forecast, by Application 2020 & 2033
- Table 29: Global Monoclonal Antibody Service Revenue million Forecast, by Type 2020 & 2033
- Table 30: Global Monoclonal Antibody Service Revenue million Forecast, by Country 2020 & 2033
- Table 31: Turkey Monoclonal Antibody Service Revenue (million) Forecast, by Application 2020 & 2033
- Table 32: Israel Monoclonal Antibody Service Revenue (million) Forecast, by Application 2020 & 2033
- Table 33: GCC Monoclonal Antibody Service Revenue (million) Forecast, by Application 2020 & 2033
- Table 34: North Africa Monoclonal Antibody Service Revenue (million) Forecast, by Application 2020 & 2033
- Table 35: South Africa Monoclonal Antibody Service Revenue (million) Forecast, by Application 2020 & 2033
- Table 36: Rest of Middle East & Africa Monoclonal Antibody Service Revenue (million) Forecast, by Application 2020 & 2033
- Table 37: Global Monoclonal Antibody Service Revenue million Forecast, by Application 2020 & 2033
- Table 38: Global Monoclonal Antibody Service Revenue million Forecast, by Type 2020 & 2033
- Table 39: Global Monoclonal Antibody Service Revenue million Forecast, by Country 2020 & 2033
- Table 40: China Monoclonal Antibody Service Revenue (million) Forecast, by Application 2020 & 2033
- Table 41: India Monoclonal Antibody Service Revenue (million) Forecast, by Application 2020 & 2033
- Table 42: Japan Monoclonal Antibody Service Revenue (million) Forecast, by Application 2020 & 2033
- Table 43: South Korea Monoclonal Antibody Service Revenue (million) Forecast, by Application 2020 & 2033
- Table 44: ASEAN Monoclonal Antibody Service Revenue (million) Forecast, by Application 2020 & 2033
- Table 45: Oceania Monoclonal Antibody Service Revenue (million) Forecast, by Application 2020 & 2033
- Table 46: Rest of Asia Pacific Monoclonal Antibody Service Revenue (million) Forecast, by Application 2020 & 2033
Frequently Asked Questions
1. What is the projected Compound Annual Growth Rate (CAGR) of the Monoclonal Antibody Service?
The projected CAGR is approximately 2.9%.
2. Which companies are prominent players in the Monoclonal Antibody Service?
Key companies in the market include Pfizer, Roche, Eli Lilly, Bayer, Amgen, Sanofi-Aventis, Johnson & Johnson, Novo Nordisk, Merck, Abbott Laboratories, GSK, BMS, Alexion, UCB, Seattle Genetics.
3. What are the main segments of the Monoclonal Antibody Service?
The market segments include Application, Type.
4. Can you provide details about the market size?
The market size is estimated to be USD 9423 million as of 2022.
5. What are some drivers contributing to market growth?
N/A
6. What are the notable trends driving market growth?
N/A
7. Are there any restraints impacting market growth?
N/A
8. Can you provide examples of recent developments in the market?
N/A
9. What pricing options are available for accessing the report?
Pricing options include single-user, multi-user, and enterprise licenses priced at USD 3950.00, USD 5925.00, and USD 7900.00 respectively.
10. Is the market size provided in terms of value or volume?
The market size is provided in terms of value, measured in million.
11. Are there any specific market keywords associated with the report?
Yes, the market keyword associated with the report is "Monoclonal Antibody Service," which aids in identifying and referencing the specific market segment covered.
12. How do I determine which pricing option suits my needs best?
The pricing options vary based on user requirements and access needs. Individual users may opt for single-user licenses, while businesses requiring broader access may choose multi-user or enterprise licenses for cost-effective access to the report.
13. Are there any additional resources or data provided in the Monoclonal Antibody Service report?
While the report offers comprehensive insights, it's advisable to review the specific contents or supplementary materials provided to ascertain if additional resources or data are available.
14. How can I stay updated on further developments or reports in the Monoclonal Antibody Service?
To stay informed about further developments, trends, and reports in the Monoclonal Antibody Service, consider subscribing to industry newsletters, following relevant companies and organizations, or regularly checking reputable industry news sources and publications.
Methodology
Step 1 - Identification of Relevant Samples Size from Population Database


Step 2 - Approaches for Defining Global Market Size (Value, Volume* & Price*)

Note*: In applicable scenarios
Step 3 - Data Sources
Primary Research
- Web Analytics
- Survey Reports
- Research Institute
- Latest Research Reports
- Opinion Leaders
Secondary Research
- Annual Reports
- White Paper
- Latest Press Release
- Industry Association
- Paid Database
- Investor Presentations

Step 4 - Data Triangulation
Involves using different sources of information in order to increase the validity of a study
These sources are likely to be stakeholders in a program - participants, other researchers, program staff, other community members, and so on.
Then we put all data in single framework & apply various statistical tools to find out the dynamic on the market.
During the analysis stage, feedback from the stakeholder groups would be compared to determine areas of agreement as well as areas of divergence