

Key Insights
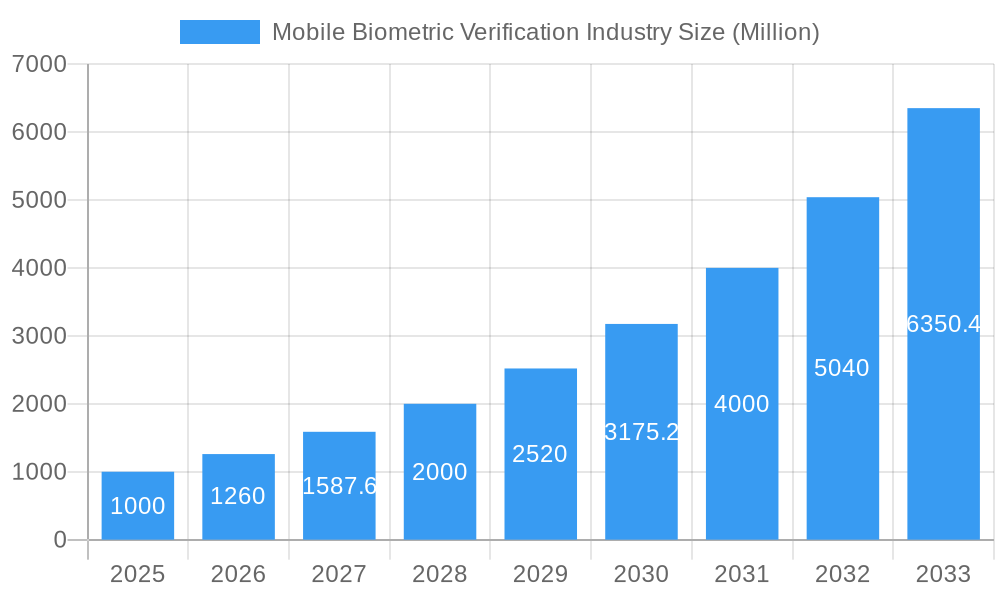
The mobile biometric verification market is experiencing robust expansion, propelled by widespread smartphone adoption and escalating demand for secure authentication across diverse industries. Projected to reach $52.64 billion by 2033, with a compound annual growth rate (CAGR) of 15.5% from the base year 2025, this sector is witnessing significant development. Key growth catalysts include the superior security offered by biometrics over traditional passwords, increasing concerns about data breaches and identity theft, and the growing integration of biometric solutions in mobile banking, access control, and other applications. The inherent convenience and user-friendliness of mobile biometric authentication are also pivotal drivers. Furthermore, government mandates promoting digital identity and stringent security standards are positively impacting market growth. While initial implementation expenses and data privacy concerns present challenges, continuous innovation in biometric technologies, such as enhanced accuracy and reduced latency, is effectively addressing these restraints.
Mobile Biometric Verification Industry Market Size (In Billion)
The market is segmented by application, with mobile banking and access control currently holding dominant positions, followed by burgeoning sectors like healthcare and retail. Geographically, North America and Europe lead market share, with the Asia-Pacific region poised for substantial growth fueled by increasing smartphone penetration and accelerating digitalization.
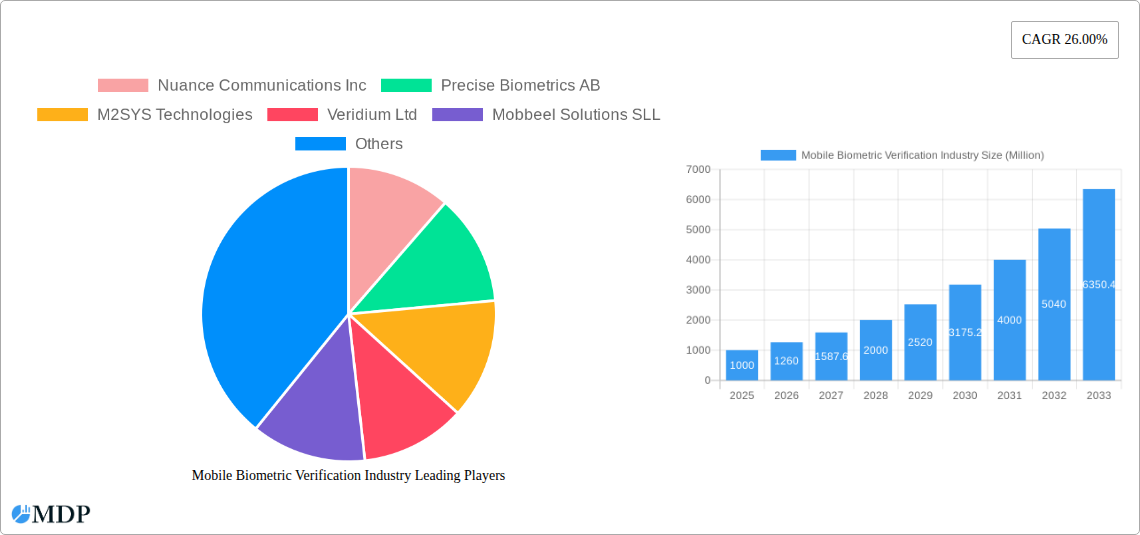
Mobile Biometric Verification Industry Company Market Share
The competitive environment features a blend of established industry leaders and agile emerging companies. Prominent players such as Nuance Communications, Precise Biometrics, and IDEMIA are capitalizing on their biometric technology expertise and broad market presence to sustain leadership. Concurrently, innovative smaller firms are contributing to market expansion through specialized solutions and targeted niche applications. The future trajectory of the mobile biometric verification market will be shaped by ongoing technological advancements, the evolution of data privacy regulations, and increasing consumer and business confidence in biometric authentication methods. The market's outlook indicates a sustained period of high growth, driven by the imperative for secure, convenient, and user-friendly authentication solutions in an increasingly digitized global landscape.
Mobile Biometric Verification Industry Report: 2019-2033
This comprehensive report provides an in-depth analysis of the Mobile Biometric Verification industry, offering invaluable insights for stakeholders, investors, and industry professionals. The study covers the period 2019-2033, with a focus on the estimated year 2025 and a forecast period spanning 2025-2033. The report leverages extensive market research to deliver actionable intelligence on market dynamics, leading players, technological advancements, and future growth potential. The global market is projected to reach xx Million by 2033, exhibiting a CAGR of xx% during the forecast period.
Mobile Biometric Verification Industry Market Dynamics & Concentration
The mobile biometric verification market is characterized by moderate concentration, with several key players holding significant market share. Nuance Communications Inc., Precise Biometrics AB, and IDEMIA (Safran Identity & Security SAS) are among the leading companies, collectively accounting for an estimated xx% of the market share in 2025. However, the market exhibits a dynamic competitive landscape fueled by continuous innovation in biometric technologies, such as advancements in fingerprint, facial, and voice recognition.
Regulatory frameworks, particularly concerning data privacy and security, are playing a crucial role in shaping market growth. The increasing stringency of regulations like GDPR and CCPA is driving demand for secure and compliant biometric solutions. Product substitutes, primarily password-based authentication systems, are facing declining market share due to their inherent security vulnerabilities. End-user trends show a strong preference for convenient and secure authentication methods, further boosting the adoption of mobile biometric verification. M&A activity in the sector has been relatively moderate, with approximately xx deals recorded between 2019 and 2024, indicating a strategic focus on organic growth and technological advancements rather than aggressive consolidation.
Mobile Biometric Verification Industry Industry Trends & Analysis
The mobile biometric verification market is experiencing robust growth, driven by several key factors. The rising adoption of smartphones and mobile banking applications is creating a massive demand for secure authentication solutions. Technological advancements, such as the improved accuracy and speed of biometric recognition algorithms and the integration of artificial intelligence (AI) and machine learning (ML), are significantly enhancing the functionality and reliability of biometric systems. Consumer preferences are shifting towards frictionless and secure authentication experiences, leading to a higher acceptance of biometric methods. The competitive dynamics are characterized by intense innovation and strategic partnerships, with companies focusing on developing cutting-edge technologies and expanding their market reach. The market penetration rate for mobile biometric verification is estimated to reach xx% by 2025, with a projected CAGR of xx% from 2025 to 2033.
Leading Markets & Segments in Mobile Biometric Verification Industry
The North American region currently dominates the mobile biometric verification market, driven by high smartphone penetration, robust digital infrastructure, and the early adoption of innovative technologies. Within the application segments, mobile banking is witnessing the fastest growth, followed by access control.
Key Drivers of North American Dominance:
- Strong regulatory support for digital identity verification.
- High consumer adoption of mobile banking and fintech services.
- Well-developed mobile network infrastructure.
- Significant investments in research and development of biometric technologies.
Mobile Banking Segment: The rise of mobile banking and the increasing need for secure transactions are driving rapid growth in this segment. Concerns around financial fraud and data breaches are pushing banks and financial institutions to implement robust authentication methods.
Access Control Segment: The adoption of mobile biometric verification in access control systems is driven by the enhanced security and convenience it offers, particularly in high-security environments.
Other Applications Segment: This segment includes diverse applications like healthcare, government services, and retail, where biometric authentication is proving its worth.
The European and Asia-Pacific regions are also exhibiting substantial growth, driven by increasing government initiatives to promote digitalization and the expansion of mobile banking services.
Mobile Biometric Verification Industry Product Developments
Recent years have witnessed significant advancements in mobile biometric verification technologies. The integration of AI and ML algorithms has significantly improved the accuracy and speed of biometric recognition. Companies are focusing on developing multi-modal biometric systems, combining multiple biometric factors to enhance security and combat spoofing attempts. The trend towards contactless biometric authentication, driven by the COVID-19 pandemic, is gaining considerable traction. These developments are leading to more robust, secure, and user-friendly mobile biometric verification solutions, improving market fit and expanding adoption across diverse applications.
Key Drivers of Mobile Biometric Verification Industry Growth
Several key factors are driving the growth of the mobile biometric verification industry. Firstly, the increasing prevalence of smartphones and mobile devices is creating a large addressable market for biometric authentication solutions. Secondly, rising concerns about data security and fraud are compelling organizations and individuals to adopt more secure authentication methods. Thirdly, technological advancements, such as AI and ML, are enhancing the accuracy, reliability, and usability of biometric technologies. Finally, supportive government regulations and initiatives promoting digital identity verification are further accelerating market growth.
Challenges in the Mobile Biometric Verification Industry Market
Despite the significant growth potential, the mobile biometric verification industry faces certain challenges. Data privacy concerns and regulatory hurdles related to the collection and use of biometric data pose a significant barrier. Supply chain disruptions can impact the availability of components and affect production timelines. Intense competition among existing and emerging players can put pressure on pricing and profitability. These challenges need to be addressed strategically to ensure the sustained growth of the industry.
Emerging Opportunities in Mobile Biometric Verification Industry
The mobile biometric verification industry presents several emerging opportunities for growth. Advancements in behavioral biometrics and the integration of blockchain technology offer enhanced security and transparency. Strategic partnerships between biometric technology providers and mobile network operators can expand market reach and accelerate adoption. Market expansion into emerging economies with growing smartphone penetration presents significant untapped potential. These factors suggest a robust future outlook for the mobile biometric verification industry.
Leading Players in the Mobile Biometric Verification Industry Sector
- Nuance Communications Inc
- Precise Biometrics AB
- M2SYS Technologies
- Veridium Ltd
- Mobbeel Solutions SLL
- ValidSoft Limited
- Aware Inc
- VoiceVault Inc
- Fingerprint Cards AB
- IDEMIA (Safran Identity & Security SAS)
Key Milestones in Mobile Biometric Verification Industry Industry
- 2020: Increased adoption of contactless biometric authentication due to the COVID-19 pandemic.
- 2021: Several key players announced strategic partnerships to expand their market reach.
- 2022: Significant advancements in AI-powered biometric recognition algorithms.
- 2023: Introduction of new multi-modal biometric systems improving security.
- 2024: Growing regulatory focus on data privacy and security in biometric systems.
Strategic Outlook for Mobile Biometric Verification Industry Market
The mobile biometric verification market is poised for sustained growth, driven by technological advancements, increasing demand for secure authentication, and expanding adoption across various sectors. Strategic opportunities exist for companies to leverage AI and ML, develop innovative multi-modal systems, and forge strategic partnerships to expand their market reach. Focusing on data privacy and compliance will be crucial for long-term success in this rapidly evolving market. The forecast suggests significant market expansion, with the global market size expected to reach xx Million by 2033.
Mobile Biometric Verification Industry Segmentation
-
1. Application
- 1.1. Access Control
- 1.2. Mobile Banking
- 1.3. Other Applications
Mobile Biometric Verification Industry Segmentation By Geography
-
1. North America
- 1.1. United States
- 1.2. Canada
-
2. Europe
- 2.1. United Kingdom
- 2.2. Germany
- 2.3. France
- 2.4. Italy
- 2.5. Rest of Europe
-
3. Asia Pacific
- 3.1. China
- 3.2. Japan
- 3.3. South Korea
- 3.4. India
- 4. Rest of the World
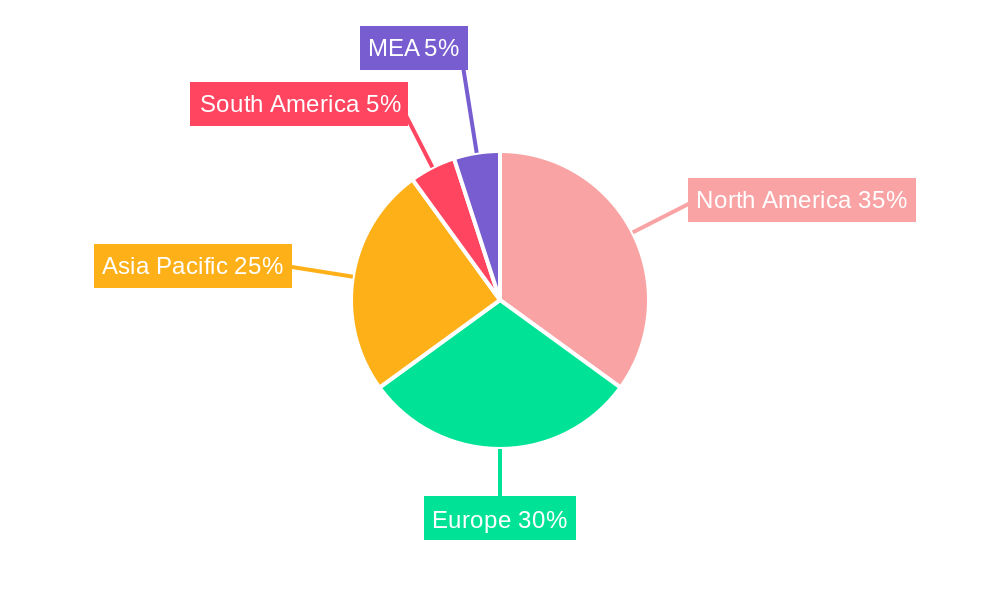
Mobile Biometric Verification Industry Regional Market Share
Geographic Coverage of Mobile Biometric Verification Industry
Mobile Biometric Verification Industry REPORT HIGHLIGHTS
| Aspects | Details |
|---|---|
| Study Period | 2020-2034 |
| Base Year | 2025 |
| Estimated Year | 2026 |
| Forecast Period | 2026-2034 |
| Historical Period | 2020-2025 |
| Growth Rate | CAGR of 15.5% from 2020-2034 |
| Segmentation |
|
Table of Contents
- 1. Introduction
- 1.1. Research Scope
- 1.2. Market Segmentation
- 1.3. Research Methodology
- 1.4. Definitions and Assumptions
- 2. Executive Summary
- 2.1. Introduction
- 3. Market Dynamics
- 3.1. Introduction
- 3.2. Market Drivers
- 3.2.1. ; Growing Popularity of Mobile Commerce; Increasing BYOD Security Requirement
- 3.3. Market Restrains
- 3.3.1. ; Concerns About Data Privacy and Data Breach
- 3.4. Market Trends
- 3.4.1. Mobile Banking is Expected to Hold a Significant Share
- 4. Market Factor Analysis
- 4.1. Porters Five Forces
- 4.2. Supply/Value Chain
- 4.3. PESTEL analysis
- 4.4. Market Entropy
- 4.5. Patent/Trademark Analysis
- 5. Global Mobile Biometric Verification Industry Analysis, Insights and Forecast, 2020-2032
- 5.1. Market Analysis, Insights and Forecast - by Application
- 5.1.1. Access Control
- 5.1.2. Mobile Banking
- 5.1.3. Other Applications
- 5.2. Market Analysis, Insights and Forecast - by Region
- 5.2.1. North America
- 5.2.2. Europe
- 5.2.3. Asia Pacific
- 5.2.4. Rest of the World
- 5.1. Market Analysis, Insights and Forecast - by Application
- 6. North America Mobile Biometric Verification Industry Analysis, Insights and Forecast, 2020-2032
- 6.1. Market Analysis, Insights and Forecast - by Application
- 6.1.1. Access Control
- 6.1.2. Mobile Banking
- 6.1.3. Other Applications
- 6.1. Market Analysis, Insights and Forecast - by Application
- 7. Europe Mobile Biometric Verification Industry Analysis, Insights and Forecast, 2020-2032
- 7.1. Market Analysis, Insights and Forecast - by Application
- 7.1.1. Access Control
- 7.1.2. Mobile Banking
- 7.1.3. Other Applications
- 7.1. Market Analysis, Insights and Forecast - by Application
- 8. Asia Pacific Mobile Biometric Verification Industry Analysis, Insights and Forecast, 2020-2032
- 8.1. Market Analysis, Insights and Forecast - by Application
- 8.1.1. Access Control
- 8.1.2. Mobile Banking
- 8.1.3. Other Applications
- 8.1. Market Analysis, Insights and Forecast - by Application
- 9. Rest of the World Mobile Biometric Verification Industry Analysis, Insights and Forecast, 2020-2032
- 9.1. Market Analysis, Insights and Forecast - by Application
- 9.1.1. Access Control
- 9.1.2. Mobile Banking
- 9.1.3. Other Applications
- 9.1. Market Analysis, Insights and Forecast - by Application
- 10. Competitive Analysis
- 10.1. Global Market Share Analysis 2025
- 10.2. Company Profiles
- 10.2.1 Nuance Communications Inc
- 10.2.1.1. Overview
- 10.2.1.2. Products
- 10.2.1.3. SWOT Analysis
- 10.2.1.4. Recent Developments
- 10.2.1.5. Financials (Based on Availability)
- 10.2.2 Precise Biometrics AB
- 10.2.2.1. Overview
- 10.2.2.2. Products
- 10.2.2.3. SWOT Analysis
- 10.2.2.4. Recent Developments
- 10.2.2.5. Financials (Based on Availability)
- 10.2.3 M2SYS Technologies
- 10.2.3.1. Overview
- 10.2.3.2. Products
- 10.2.3.3. SWOT Analysis
- 10.2.3.4. Recent Developments
- 10.2.3.5. Financials (Based on Availability)
- 10.2.4 Veridium Ltd
- 10.2.4.1. Overview
- 10.2.4.2. Products
- 10.2.4.3. SWOT Analysis
- 10.2.4.4. Recent Developments
- 10.2.4.5. Financials (Based on Availability)
- 10.2.5 Mobbeel Solutions SLL
- 10.2.5.1. Overview
- 10.2.5.2. Products
- 10.2.5.3. SWOT Analysis
- 10.2.5.4. Recent Developments
- 10.2.5.5. Financials (Based on Availability)
- 10.2.6 ValidSoft Limited
- 10.2.6.1. Overview
- 10.2.6.2. Products
- 10.2.6.3. SWOT Analysis
- 10.2.6.4. Recent Developments
- 10.2.6.5. Financials (Based on Availability)
- 10.2.7 Aware Inc
- 10.2.7.1. Overview
- 10.2.7.2. Products
- 10.2.7.3. SWOT Analysis
- 10.2.7.4. Recent Developments
- 10.2.7.5. Financials (Based on Availability)
- 10.2.8 VoiceVault Inc
- 10.2.8.1. Overview
- 10.2.8.2. Products
- 10.2.8.3. SWOT Analysis
- 10.2.8.4. Recent Developments
- 10.2.8.5. Financials (Based on Availability)
- 10.2.9 Fingerprint Cards AB
- 10.2.9.1. Overview
- 10.2.9.2. Products
- 10.2.9.3. SWOT Analysis
- 10.2.9.4. Recent Developments
- 10.2.9.5. Financials (Based on Availability)
- 10.2.10 IDEMIA (Safran Identity & Security SAS)
- 10.2.10.1. Overview
- 10.2.10.2. Products
- 10.2.10.3. SWOT Analysis
- 10.2.10.4. Recent Developments
- 10.2.10.5. Financials (Based on Availability)
- 10.2.1 Nuance Communications Inc
List of Figures
- Figure 1: Global Mobile Biometric Verification Industry Revenue Breakdown (billion, %) by Region 2025 & 2033
- Figure 2: Global Mobile Biometric Verification Industry Volume Breakdown (K Unit, %) by Region 2025 & 2033
- Figure 3: North America Mobile Biometric Verification Industry Revenue (billion), by Application 2025 & 2033
- Figure 4: North America Mobile Biometric Verification Industry Volume (K Unit), by Application 2025 & 2033
- Figure 5: North America Mobile Biometric Verification Industry Revenue Share (%), by Application 2025 & 2033
- Figure 6: North America Mobile Biometric Verification Industry Volume Share (%), by Application 2025 & 2033
- Figure 7: North America Mobile Biometric Verification Industry Revenue (billion), by Country 2025 & 2033
- Figure 8: North America Mobile Biometric Verification Industry Volume (K Unit), by Country 2025 & 2033
- Figure 9: North America Mobile Biometric Verification Industry Revenue Share (%), by Country 2025 & 2033
- Figure 10: North America Mobile Biometric Verification Industry Volume Share (%), by Country 2025 & 2033
- Figure 11: Europe Mobile Biometric Verification Industry Revenue (billion), by Application 2025 & 2033
- Figure 12: Europe Mobile Biometric Verification Industry Volume (K Unit), by Application 2025 & 2033
- Figure 13: Europe Mobile Biometric Verification Industry Revenue Share (%), by Application 2025 & 2033
- Figure 14: Europe Mobile Biometric Verification Industry Volume Share (%), by Application 2025 & 2033
- Figure 15: Europe Mobile Biometric Verification Industry Revenue (billion), by Country 2025 & 2033
- Figure 16: Europe Mobile Biometric Verification Industry Volume (K Unit), by Country 2025 & 2033
- Figure 17: Europe Mobile Biometric Verification Industry Revenue Share (%), by Country 2025 & 2033
- Figure 18: Europe Mobile Biometric Verification Industry Volume Share (%), by Country 2025 & 2033
- Figure 19: Asia Pacific Mobile Biometric Verification Industry Revenue (billion), by Application 2025 & 2033
- Figure 20: Asia Pacific Mobile Biometric Verification Industry Volume (K Unit), by Application 2025 & 2033
- Figure 21: Asia Pacific Mobile Biometric Verification Industry Revenue Share (%), by Application 2025 & 2033
- Figure 22: Asia Pacific Mobile Biometric Verification Industry Volume Share (%), by Application 2025 & 2033
- Figure 23: Asia Pacific Mobile Biometric Verification Industry Revenue (billion), by Country 2025 & 2033
- Figure 24: Asia Pacific Mobile Biometric Verification Industry Volume (K Unit), by Country 2025 & 2033
- Figure 25: Asia Pacific Mobile Biometric Verification Industry Revenue Share (%), by Country 2025 & 2033
- Figure 26: Asia Pacific Mobile Biometric Verification Industry Volume Share (%), by Country 2025 & 2033
- Figure 27: Rest of the World Mobile Biometric Verification Industry Revenue (billion), by Application 2025 & 2033
- Figure 28: Rest of the World Mobile Biometric Verification Industry Volume (K Unit), by Application 2025 & 2033
- Figure 29: Rest of the World Mobile Biometric Verification Industry Revenue Share (%), by Application 2025 & 2033
- Figure 30: Rest of the World Mobile Biometric Verification Industry Volume Share (%), by Application 2025 & 2033
- Figure 31: Rest of the World Mobile Biometric Verification Industry Revenue (billion), by Country 2025 & 2033
- Figure 32: Rest of the World Mobile Biometric Verification Industry Volume (K Unit), by Country 2025 & 2033
- Figure 33: Rest of the World Mobile Biometric Verification Industry Revenue Share (%), by Country 2025 & 2033
- Figure 34: Rest of the World Mobile Biometric Verification Industry Volume Share (%), by Country 2025 & 2033
List of Tables
- Table 1: Global Mobile Biometric Verification Industry Revenue billion Forecast, by Application 2020 & 2033
- Table 2: Global Mobile Biometric Verification Industry Volume K Unit Forecast, by Application 2020 & 2033
- Table 3: Global Mobile Biometric Verification Industry Revenue billion Forecast, by Region 2020 & 2033
- Table 4: Global Mobile Biometric Verification Industry Volume K Unit Forecast, by Region 2020 & 2033
- Table 5: Global Mobile Biometric Verification Industry Revenue billion Forecast, by Application 2020 & 2033
- Table 6: Global Mobile Biometric Verification Industry Volume K Unit Forecast, by Application 2020 & 2033
- Table 7: Global Mobile Biometric Verification Industry Revenue billion Forecast, by Country 2020 & 2033
- Table 8: Global Mobile Biometric Verification Industry Volume K Unit Forecast, by Country 2020 & 2033
- Table 9: United States Mobile Biometric Verification Industry Revenue (billion) Forecast, by Application 2020 & 2033
- Table 10: United States Mobile Biometric Verification Industry Volume (K Unit) Forecast, by Application 2020 & 2033
- Table 11: Canada Mobile Biometric Verification Industry Revenue (billion) Forecast, by Application 2020 & 2033
- Table 12: Canada Mobile Biometric Verification Industry Volume (K Unit) Forecast, by Application 2020 & 2033
- Table 13: Global Mobile Biometric Verification Industry Revenue billion Forecast, by Application 2020 & 2033
- Table 14: Global Mobile Biometric Verification Industry Volume K Unit Forecast, by Application 2020 & 2033
- Table 15: Global Mobile Biometric Verification Industry Revenue billion Forecast, by Country 2020 & 2033
- Table 16: Global Mobile Biometric Verification Industry Volume K Unit Forecast, by Country 2020 & 2033
- Table 17: United Kingdom Mobile Biometric Verification Industry Revenue (billion) Forecast, by Application 2020 & 2033
- Table 18: United Kingdom Mobile Biometric Verification Industry Volume (K Unit) Forecast, by Application 2020 & 2033
- Table 19: Germany Mobile Biometric Verification Industry Revenue (billion) Forecast, by Application 2020 & 2033
- Table 20: Germany Mobile Biometric Verification Industry Volume (K Unit) Forecast, by Application 2020 & 2033
- Table 21: France Mobile Biometric Verification Industry Revenue (billion) Forecast, by Application 2020 & 2033
- Table 22: France Mobile Biometric Verification Industry Volume (K Unit) Forecast, by Application 2020 & 2033
- Table 23: Italy Mobile Biometric Verification Industry Revenue (billion) Forecast, by Application 2020 & 2033
- Table 24: Italy Mobile Biometric Verification Industry Volume (K Unit) Forecast, by Application 2020 & 2033
- Table 25: Rest of Europe Mobile Biometric Verification Industry Revenue (billion) Forecast, by Application 2020 & 2033
- Table 26: Rest of Europe Mobile Biometric Verification Industry Volume (K Unit) Forecast, by Application 2020 & 2033
- Table 27: Global Mobile Biometric Verification Industry Revenue billion Forecast, by Application 2020 & 2033
- Table 28: Global Mobile Biometric Verification Industry Volume K Unit Forecast, by Application 2020 & 2033
- Table 29: Global Mobile Biometric Verification Industry Revenue billion Forecast, by Country 2020 & 2033
- Table 30: Global Mobile Biometric Verification Industry Volume K Unit Forecast, by Country 2020 & 2033
- Table 31: China Mobile Biometric Verification Industry Revenue (billion) Forecast, by Application 2020 & 2033
- Table 32: China Mobile Biometric Verification Industry Volume (K Unit) Forecast, by Application 2020 & 2033
- Table 33: Japan Mobile Biometric Verification Industry Revenue (billion) Forecast, by Application 2020 & 2033
- Table 34: Japan Mobile Biometric Verification Industry Volume (K Unit) Forecast, by Application 2020 & 2033
- Table 35: South Korea Mobile Biometric Verification Industry Revenue (billion) Forecast, by Application 2020 & 2033
- Table 36: South Korea Mobile Biometric Verification Industry Volume (K Unit) Forecast, by Application 2020 & 2033
- Table 37: India Mobile Biometric Verification Industry Revenue (billion) Forecast, by Application 2020 & 2033
- Table 38: India Mobile Biometric Verification Industry Volume (K Unit) Forecast, by Application 2020 & 2033
- Table 39: Global Mobile Biometric Verification Industry Revenue billion Forecast, by Application 2020 & 2033
- Table 40: Global Mobile Biometric Verification Industry Volume K Unit Forecast, by Application 2020 & 2033
- Table 41: Global Mobile Biometric Verification Industry Revenue billion Forecast, by Country 2020 & 2033
- Table 42: Global Mobile Biometric Verification Industry Volume K Unit Forecast, by Country 2020 & 2033
Frequently Asked Questions
1. What is the projected Compound Annual Growth Rate (CAGR) of the Mobile Biometric Verification Industry?
The projected CAGR is approximately 15.5%.
2. Which companies are prominent players in the Mobile Biometric Verification Industry?
Key companies in the market include Nuance Communications Inc, Precise Biometrics AB, M2SYS Technologies, Veridium Ltd, Mobbeel Solutions SLL, ValidSoft Limited, Aware Inc, VoiceVault Inc, Fingerprint Cards AB, IDEMIA (Safran Identity & Security SAS).
3. What are the main segments of the Mobile Biometric Verification Industry?
The market segments include Application.
4. Can you provide details about the market size?
The market size is estimated to be USD 52.64 billion as of 2022.
5. What are some drivers contributing to market growth?
; Growing Popularity of Mobile Commerce; Increasing BYOD Security Requirement.
6. What are the notable trends driving market growth?
Mobile Banking is Expected to Hold a Significant Share.
7. Are there any restraints impacting market growth?
; Concerns About Data Privacy and Data Breach.
8. Can you provide examples of recent developments in the market?
N/A
9. What pricing options are available for accessing the report?
Pricing options include single-user, multi-user, and enterprise licenses priced at USD 4750, USD 5250, and USD 8750 respectively.
10. Is the market size provided in terms of value or volume?
The market size is provided in terms of value, measured in billion and volume, measured in K Unit.
11. Are there any specific market keywords associated with the report?
Yes, the market keyword associated with the report is "Mobile Biometric Verification Industry," which aids in identifying and referencing the specific market segment covered.
12. How do I determine which pricing option suits my needs best?
The pricing options vary based on user requirements and access needs. Individual users may opt for single-user licenses, while businesses requiring broader access may choose multi-user or enterprise licenses for cost-effective access to the report.
13. Are there any additional resources or data provided in the Mobile Biometric Verification Industry report?
While the report offers comprehensive insights, it's advisable to review the specific contents or supplementary materials provided to ascertain if additional resources or data are available.
14. How can I stay updated on further developments or reports in the Mobile Biometric Verification Industry?
To stay informed about further developments, trends, and reports in the Mobile Biometric Verification Industry, consider subscribing to industry newsletters, following relevant companies and organizations, or regularly checking reputable industry news sources and publications.
Methodology
Step 1 - Identification of Relevant Samples Size from Population Database


Step 2 - Approaches for Defining Global Market Size (Value, Volume* & Price*)

Note*: In applicable scenarios
Step 3 - Data Sources
Primary Research
- Web Analytics
- Survey Reports
- Research Institute
- Latest Research Reports
- Opinion Leaders
Secondary Research
- Annual Reports
- White Paper
- Latest Press Release
- Industry Association
- Paid Database
- Investor Presentations

Step 4 - Data Triangulation
Involves using different sources of information in order to increase the validity of a study
These sources are likely to be stakeholders in a program - participants, other researchers, program staff, other community members, and so on.
Then we put all data in single framework & apply various statistical tools to find out the dynamic on the market.
During the analysis stage, feedback from the stakeholder groups would be compared to determine areas of agreement as well as areas of divergence