

Key Insights
The global LED phototherapy units market is projected to reach a substantial USD 1.16 billion in 2025, demonstrating robust growth with a Compound Annual Growth Rate (CAGR) of 4.02% expected from 2025 to 2033. This expansion is primarily fueled by the increasing incidence of neonatal jaundice, a common condition requiring phototherapy, and a growing awareness among healthcare providers and parents about the efficacy and safety of LED-based phototherapy solutions. The inherent advantages of LED technology, such as energy efficiency, longer lifespan, and lower heat emission compared to traditional fluorescent lamps, are further propelling its adoption across healthcare facilities. Moreover, advancements in product design, leading to more portable and user-friendly units, are contributing to market penetration, especially in clinics and smaller healthcare settings.
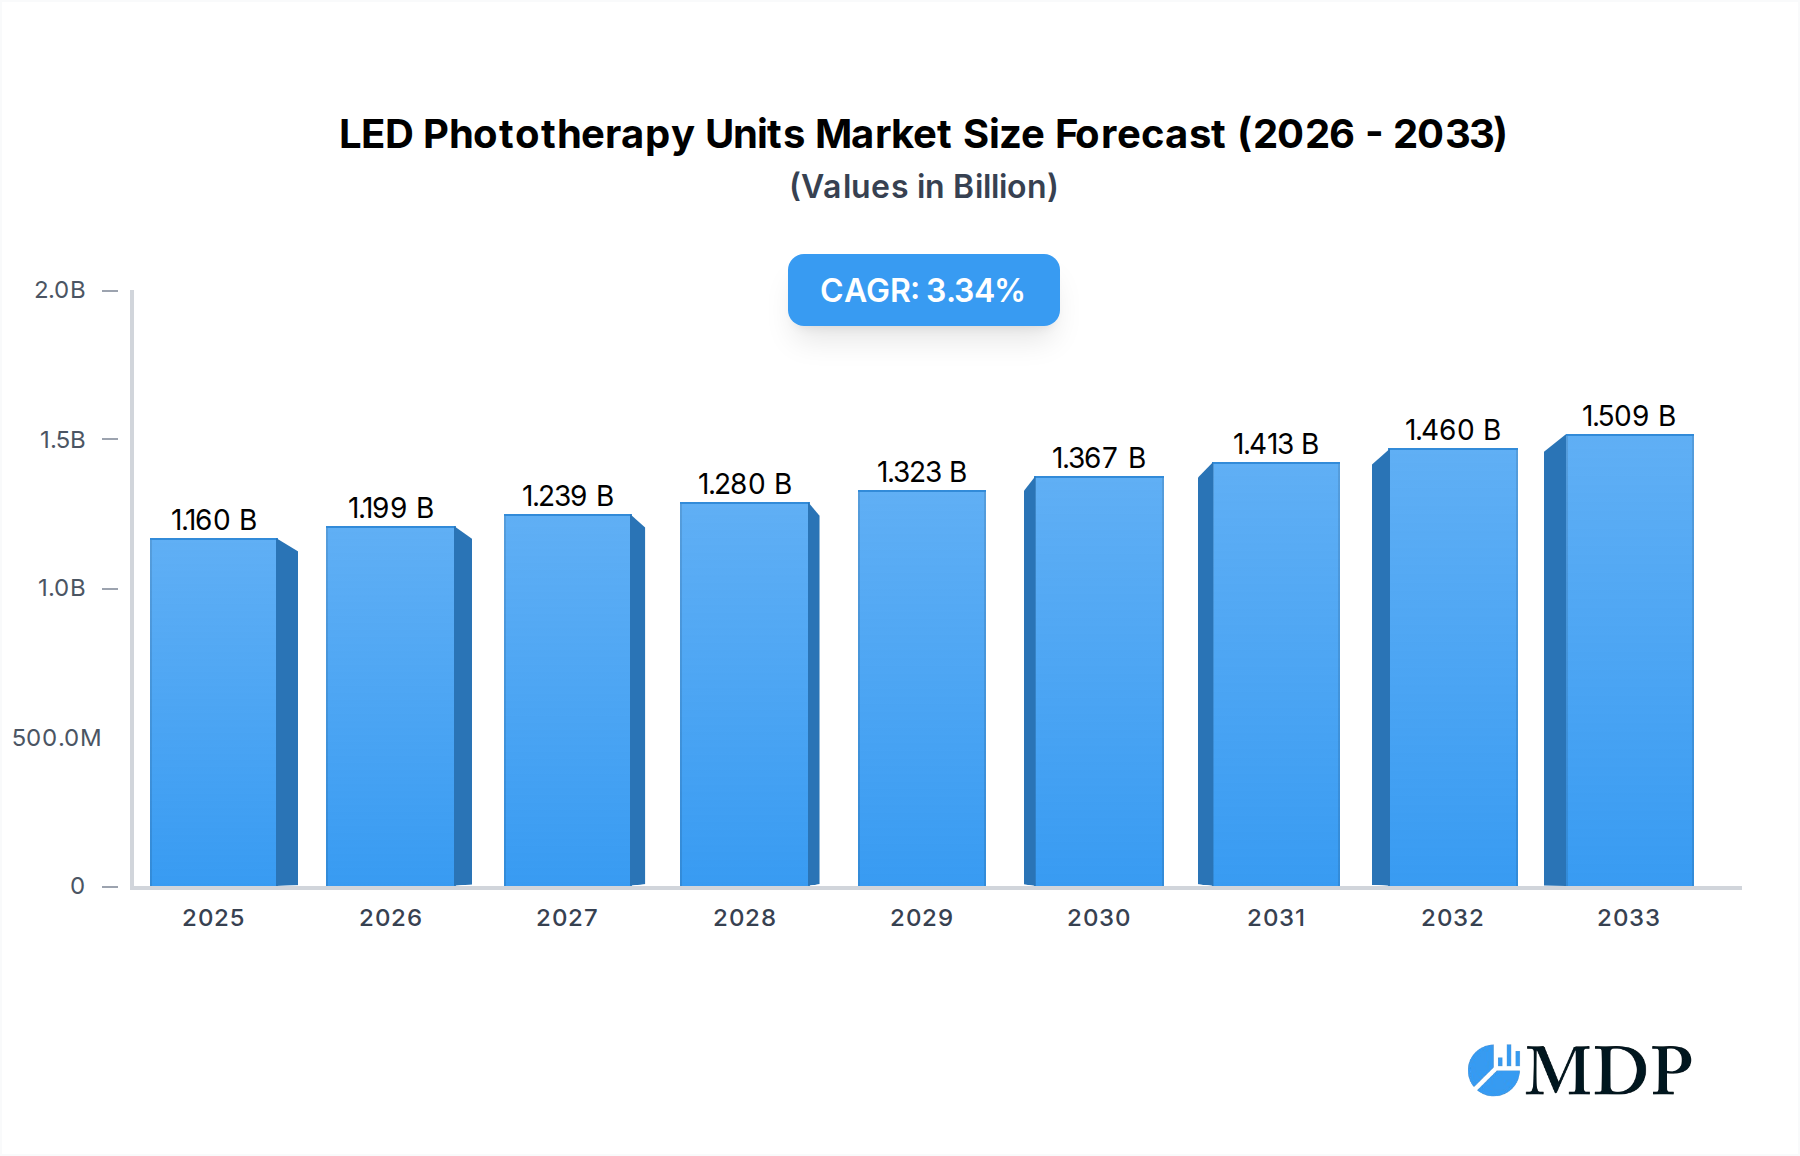
LED Phototherapy Units Market Size (In Billion)
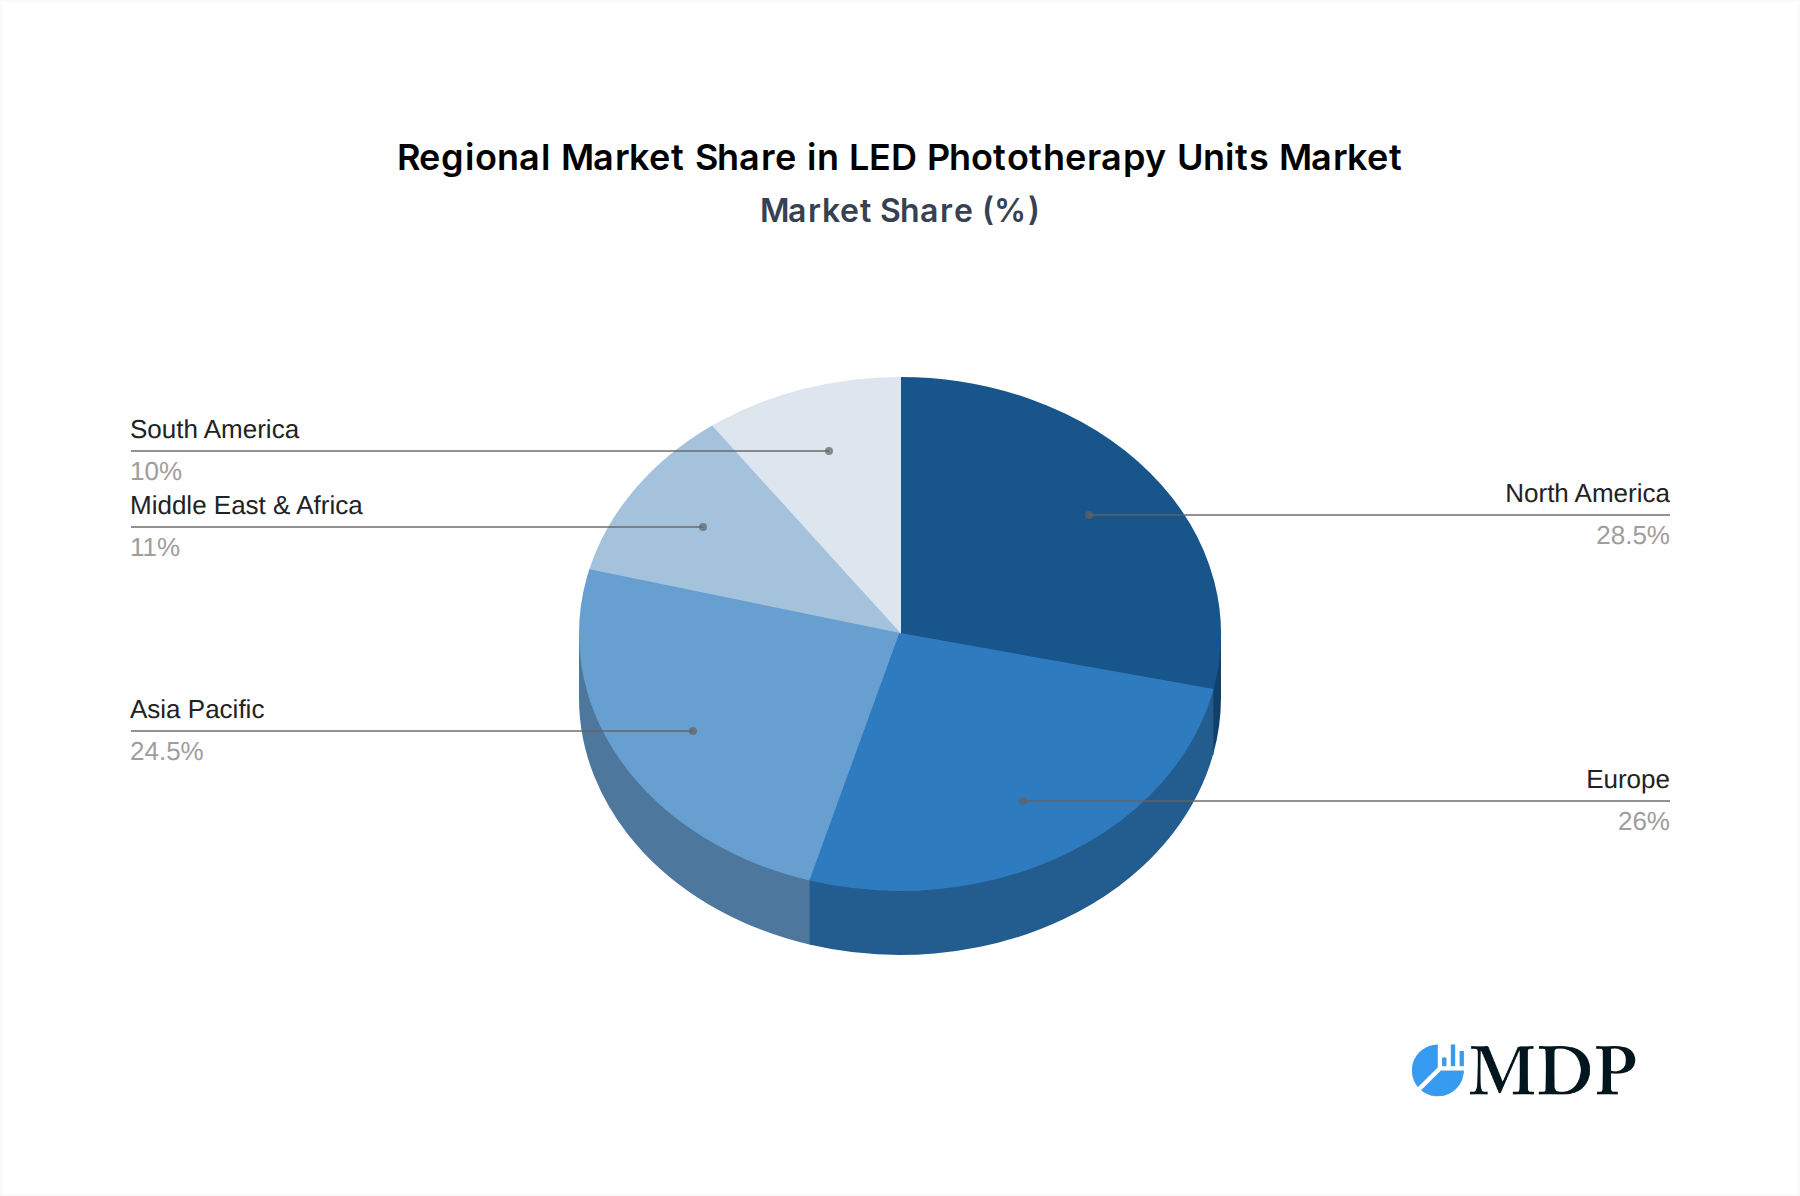
The market landscape for LED phototherapy units is characterized by dynamic segmentation. Applications are predominantly led by hospitals, which represent the largest share due to their comprehensive infrastructure and higher patient volumes. However, clinics are emerging as a significant growth segment, driven by the decentralization of healthcare services and the increasing demand for specialized neonatal care. In terms of wavelength, units emitting light in the 420-500nm range are currently dominant, as this spectrum is most effective in treating hyperbilirubinemia. The market is also witnessing a growing interest in broader spectrum options, including those below 420nm and above 500nm, catering to specific treatment protocols and emerging research. Geographically, North America and Europe are established markets, while the Asia Pacific region is anticipated to exhibit the fastest growth, fueled by rising healthcare expenditures, improving access to advanced medical devices, and a growing infant population. Key players are actively engaged in product innovation, strategic collaborations, and expanding their distribution networks to capture this burgeoning market.

LED Phototherapy Units Company Market Share
This in-depth report offers a thorough analysis of the global LED phototherapy units market, forecasting robust growth and detailing the strategic landscape from 2019–2033. With a base year of 2025, this research provides actionable insights for hospitals, clinics, and other healthcare stakeholders interested in the wavelength less than 420nm, wavelength 420-500nm, and wavelength more than 500nm segments. The study meticulously examines key industry players including Gpcmedical, Nice Neotech Medical Systems Pvt, GE Healthcare, NR Surgicals, Carevel Medical Systems Private Limited, Matrix Medical System, Kay & Company, Phoenix Medical Systems, Ibis Medical, Avihealthcare, OM SAI MEDICAL, ERTUNÇÖZCAN, and Dev Electromedical Pvt.
LED Phototherapy Units Market Dynamics & Concentration
The LED phototherapy units market exhibits a moderate concentration, with a few leading players holding significant market share, estimated at over 60% in 2025. Innovation drivers are primarily fueled by advancements in LED technology, leading to more energy-efficient, targeted, and user-friendly devices. Regulatory frameworks, such as FDA approvals and CE marking, play a crucial role in market entry and product validation, ensuring patient safety and device efficacy. Product substitutes, while limited in terms of direct phototherapy, include traditional fluorescent lamps, which are gradually being phased out due to their lower efficiency and potential for UV emission. End-user trends are shifting towards the adoption of compact, portable, and integrated phototherapy solutions within hospitals and specialized clinics. Mergers and acquisitions (M&A) activity in the sector has been modest but strategic, with a projected XX deal count between 2025-2033, indicating a consolidation drive among smaller entities seeking to gain market access or technological prowess.
LED Phototherapy Units Industry Trends & Analysis
The global LED phototherapy units market is poised for significant expansion, driven by an increasing prevalence of neonatal jaundice and dermatological conditions requiring phototherapy. The market is projected to witness a Compound Annual Growth Rate (CAGR) of approximately xx% from 2025 to 2033. Technological disruptions, particularly the development of advanced LED arrays offering precise wavelength control and reduced heat emission, are revolutionizing patient care and comfort. Consumer preferences are evolving towards devices that minimize treatment duration and maximize therapeutic outcomes, leading to higher demand for intelligent and adaptive phototherapy systems. Competitive dynamics are intensifying, with both established medical device manufacturers and emerging technology firms vying for market share. The market penetration of advanced LED phototherapy units is expected to rise considerably, especially in developing economies where access to advanced neonatal care is rapidly improving. The overall market size is estimated to reach billions by 2033, reflecting sustained demand and innovation.
Leading Markets & Segments in LED Phototherapy Units
The Asia Pacific region is emerging as a dominant market for LED phototherapy units, driven by burgeoning healthcare infrastructure, rising disposable incomes, and a growing awareness of neonatal health. Within this region, China and India are leading the charge, supported by government initiatives to improve maternal and child healthcare services. In terms of application, hospitals account for the largest share of the market, owing to the high incidence of neonatal jaundice requiring inpatient treatment. However, the clinics segment is experiencing a robust growth rate as outpatient phototherapy becomes more accessible.
Key drivers for regional dominance include:
- Economic Policies: Favorable government healthcare spending and incentives for medical device adoption in emerging economies.
- Infrastructure Development: Expansion of neonatal intensive care units (NICUs) and specialized phototherapy centers.
- Demographic Trends: High birth rates in certain regions contribute to a sustained demand for neonatal phototherapy.
Analyzing by type:
- Wavelength Less Than 420nm: This segment, crucial for treating hyperbilirubinemia, is a cornerstone of the neonatal phototherapy market. Its dominance is expected to continue due to its established efficacy and widespread adoption.
- Wavelength 420-500nm: This broader spectrum finds applications in both neonatal care and certain dermatological treatments, contributing to its steady market presence.
- Wavelength More Than 500nm: While currently a smaller segment, this category holds potential for future growth with ongoing research into its therapeutic applications in advanced dermatological treatments and wound healing.
The market penetration of LED phototherapy units across these segments is projected to reach over xx% by 2033, underscoring their indispensable role in modern healthcare.
LED Phototherapy Units Product Developments
Recent product developments in the LED phototherapy units market focus on enhancing portability, improving treatment efficacy through advanced wavelength control, and integrating smart features for remote monitoring. Innovations include compact, battery-powered units for home-use phototherapy and modular systems that can be adapted for various patient needs. The competitive advantage lies in devices offering faster treatment times, reduced energy consumption, and enhanced patient comfort, thereby driving market adoption and client satisfaction. The trend is towards user-friendly interfaces and data logging capabilities, providing valuable insights for clinicians.
Key Drivers of LED Phototherapy Units Growth
The LED phototherapy units market is propelled by several key drivers. Technological advancements in LED efficiency and spectral precision are leading to more effective and safer treatments. The increasing global incidence of neonatal jaundice remains a primary growth catalyst. Growing awareness and adoption of phototherapy in developing economies, coupled with supportive government healthcare initiatives, further fuel market expansion. Furthermore, the development of specialized phototherapy units for dermatological conditions is broadening the application scope and market reach.
Challenges in the LED Phototherapy Units Market
Despite robust growth, the LED phototherapy units market faces certain challenges. Stringent regulatory approvals and compliance requirements can be time-consuming and costly, acting as a barrier to entry for smaller manufacturers. Fluctuations in raw material prices can impact production costs and profit margins. Intense competition among established players and new entrants also exerts downward pressure on pricing. The initial high cost of advanced LED phototherapy units can also be a restraint in price-sensitive markets, although this is being offset by increasing affordability and the long-term cost-effectiveness of LED technology.
Emerging Opportunities in LED Phototherapy Units
Emerging opportunities in the LED phototherapy units market are abundant. The expanding use of phototherapy in non-neonatal applications, such as dermatology (acne treatment, psoriasis) and wound healing, presents significant growth avenues. Technological breakthroughs in tunable wavelength LEDs and advanced therapeutic algorithms will further enhance device capabilities. Strategic partnerships between medical device manufacturers and research institutions can accelerate the development of novel phototherapy applications. Moreover, the increasing demand for home-care phototherapy solutions, driven by convenience and cost-effectiveness, offers substantial market expansion potential.
Leading Players in the LED Phototherapy Units Sector
- Gpcmedical
- Nice Neotech Medical Systems Pvt
- GE Healthcare
- NR Surgicals
- Carevel Medical Systems Private Limited
- Matrix Medical System
- Kay & Company
- Phoenix Medical Systems
- Ibis Medical
- Avihealthcare
- OM SAI MEDICAL
- ERTUNÇÖZCAN
- Dev Electromedical Pvt
Key Milestones in LED Phototherapy Units Industry
- 2019: Increased adoption of energy-efficient LED technology in neonatal incubators.
- 2020: Introduction of portable LED phototherapy devices for home use.
- 2021: Growing research on advanced LED wavelengths for dermatological applications.
- 2022: Enhanced regulatory approvals for advanced phototherapy systems.
- 2023: Strategic collaborations for wider market penetration in emerging economies.
- 2024: Significant advancements in smart monitoring and data analytics for phototherapy units.
Strategic Outlook for LED Phototherapy Units Market
The strategic outlook for the LED phototherapy units market is highly optimistic, driven by continuous innovation and expanding applications. Growth accelerators include the relentless pursuit of more effective and patient-friendly devices, coupled with the penetration into new therapeutic areas beyond neonatal jaundice. Companies are expected to focus on expanding their geographical reach, particularly in underserved markets, and on developing integrated phototherapy solutions that offer superior clinical outcomes. The increasing demand for personalized medicine will also drive the development of intelligent phototherapy units with adaptive treatment protocols, ensuring sustained market growth and profitability for stakeholders.
LED Phototherapy Units Segmentation
-
1. Application
- 1.1. Hospitals
- 1.2. Clinics
-
2. Types
- 2.1. Wavelength Less Than 420nm
- 2.2. Wavelength 420-500nm
- 2.3. Wavelength More Than 500nm
LED Phototherapy Units Segmentation By Geography
-
1. North America
- 1.1. United States
- 1.2. Canada
- 1.3. Mexico
-
2. South America
- 2.1. Brazil
- 2.2. Argentina
- 2.3. Rest of South America
-
3. Europe
- 3.1. United Kingdom
- 3.2. Germany
- 3.3. France
- 3.4. Italy
- 3.5. Spain
- 3.6. Russia
- 3.7. Benelux
- 3.8. Nordics
- 3.9. Rest of Europe
-
4. Middle East & Africa
- 4.1. Turkey
- 4.2. Israel
- 4.3. GCC
- 4.4. North Africa
- 4.5. South Africa
- 4.6. Rest of Middle East & Africa
-
5. Asia Pacific
- 5.1. China
- 5.2. India
- 5.3. Japan
- 5.4. South Korea
- 5.5. ASEAN
- 5.6. Oceania
- 5.7. Rest of Asia Pacific
LED Phototherapy Units Regional Market Share
Geographic Coverage of LED Phototherapy Units
LED Phototherapy Units REPORT HIGHLIGHTS
| Aspects | Details |
|---|---|
| Study Period | 2020-2034 |
| Base Year | 2025 |
| Estimated Year | 2026 |
| Forecast Period | 2026-2034 |
| Historical Period | 2020-2025 |
| Growth Rate | CAGR of 4.02% from 2020-2034 |
| Segmentation |
|
Table of Contents
- 1. Introduction
- 1.1. Research Scope
- 1.2. Market Segmentation
- 1.3. Research Methodology
- 1.4. Definitions and Assumptions
- 2. Executive Summary
- 2.1. Introduction
- 3. Market Dynamics
- 3.1. Introduction
- 3.2. Market Drivers
- 3.3. Market Restrains
- 3.4. Market Trends
- 4. Market Factor Analysis
- 4.1. Porters Five Forces
- 4.2. Supply/Value Chain
- 4.3. PESTEL analysis
- 4.4. Market Entropy
- 4.5. Patent/Trademark Analysis
- 5. Global LED Phototherapy Units Analysis, Insights and Forecast, 2020-2032
- 5.1. Market Analysis, Insights and Forecast - by Application
- 5.1.1. Hospitals
- 5.1.2. Clinics
- 5.2. Market Analysis, Insights and Forecast - by Types
- 5.2.1. Wavelength Less Than 420nm
- 5.2.2. Wavelength 420-500nm
- 5.2.3. Wavelength More Than 500nm
- 5.3. Market Analysis, Insights and Forecast - by Region
- 5.3.1. North America
- 5.3.2. South America
- 5.3.3. Europe
- 5.3.4. Middle East & Africa
- 5.3.5. Asia Pacific
- 5.1. Market Analysis, Insights and Forecast - by Application
- 6. North America LED Phototherapy Units Analysis, Insights and Forecast, 2020-2032
- 6.1. Market Analysis, Insights and Forecast - by Application
- 6.1.1. Hospitals
- 6.1.2. Clinics
- 6.2. Market Analysis, Insights and Forecast - by Types
- 6.2.1. Wavelength Less Than 420nm
- 6.2.2. Wavelength 420-500nm
- 6.2.3. Wavelength More Than 500nm
- 6.1. Market Analysis, Insights and Forecast - by Application
- 7. South America LED Phototherapy Units Analysis, Insights and Forecast, 2020-2032
- 7.1. Market Analysis, Insights and Forecast - by Application
- 7.1.1. Hospitals
- 7.1.2. Clinics
- 7.2. Market Analysis, Insights and Forecast - by Types
- 7.2.1. Wavelength Less Than 420nm
- 7.2.2. Wavelength 420-500nm
- 7.2.3. Wavelength More Than 500nm
- 7.1. Market Analysis, Insights and Forecast - by Application
- 8. Europe LED Phototherapy Units Analysis, Insights and Forecast, 2020-2032
- 8.1. Market Analysis, Insights and Forecast - by Application
- 8.1.1. Hospitals
- 8.1.2. Clinics
- 8.2. Market Analysis, Insights and Forecast - by Types
- 8.2.1. Wavelength Less Than 420nm
- 8.2.2. Wavelength 420-500nm
- 8.2.3. Wavelength More Than 500nm
- 8.1. Market Analysis, Insights and Forecast - by Application
- 9. Middle East & Africa LED Phototherapy Units Analysis, Insights and Forecast, 2020-2032
- 9.1. Market Analysis, Insights and Forecast - by Application
- 9.1.1. Hospitals
- 9.1.2. Clinics
- 9.2. Market Analysis, Insights and Forecast - by Types
- 9.2.1. Wavelength Less Than 420nm
- 9.2.2. Wavelength 420-500nm
- 9.2.3. Wavelength More Than 500nm
- 9.1. Market Analysis, Insights and Forecast - by Application
- 10. Asia Pacific LED Phototherapy Units Analysis, Insights and Forecast, 2020-2032
- 10.1. Market Analysis, Insights and Forecast - by Application
- 10.1.1. Hospitals
- 10.1.2. Clinics
- 10.2. Market Analysis, Insights and Forecast - by Types
- 10.2.1. Wavelength Less Than 420nm
- 10.2.2. Wavelength 420-500nm
- 10.2.3. Wavelength More Than 500nm
- 10.1. Market Analysis, Insights and Forecast - by Application
- 11. Competitive Analysis
- 11.1. Global Market Share Analysis 2025
- 11.2. Company Profiles
- 11.2.1 Gpcmedical
- 11.2.1.1. Overview
- 11.2.1.2. Products
- 11.2.1.3. SWOT Analysis
- 11.2.1.4. Recent Developments
- 11.2.1.5. Financials (Based on Availability)
- 11.2.2 Nice Neotech Medical Systems Pvt
- 11.2.2.1. Overview
- 11.2.2.2. Products
- 11.2.2.3. SWOT Analysis
- 11.2.2.4. Recent Developments
- 11.2.2.5. Financials (Based on Availability)
- 11.2.3 GE Healthcare
- 11.2.3.1. Overview
- 11.2.3.2. Products
- 11.2.3.3. SWOT Analysis
- 11.2.3.4. Recent Developments
- 11.2.3.5. Financials (Based on Availability)
- 11.2.4 NR Surgicals
- 11.2.4.1. Overview
- 11.2.4.2. Products
- 11.2.4.3. SWOT Analysis
- 11.2.4.4. Recent Developments
- 11.2.4.5. Financials (Based on Availability)
- 11.2.5 Carevel Medical Systems Private Limited
- 11.2.5.1. Overview
- 11.2.5.2. Products
- 11.2.5.3. SWOT Analysis
- 11.2.5.4. Recent Developments
- 11.2.5.5. Financials (Based on Availability)
- 11.2.6 Matrix Medical System
- 11.2.6.1. Overview
- 11.2.6.2. Products
- 11.2.6.3. SWOT Analysis
- 11.2.6.4. Recent Developments
- 11.2.6.5. Financials (Based on Availability)
- 11.2.7 Kay & Company
- 11.2.7.1. Overview
- 11.2.7.2. Products
- 11.2.7.3. SWOT Analysis
- 11.2.7.4. Recent Developments
- 11.2.7.5. Financials (Based on Availability)
- 11.2.8 Phoenix Medical Systems
- 11.2.8.1. Overview
- 11.2.8.2. Products
- 11.2.8.3. SWOT Analysis
- 11.2.8.4. Recent Developments
- 11.2.8.5. Financials (Based on Availability)
- 11.2.9 Ibis Medical
- 11.2.9.1. Overview
- 11.2.9.2. Products
- 11.2.9.3. SWOT Analysis
- 11.2.9.4. Recent Developments
- 11.2.9.5. Financials (Based on Availability)
- 11.2.10 Avihealthcare
- 11.2.10.1. Overview
- 11.2.10.2. Products
- 11.2.10.3. SWOT Analysis
- 11.2.10.4. Recent Developments
- 11.2.10.5. Financials (Based on Availability)
- 11.2.11 OM SAI MEDICAL
- 11.2.11.1. Overview
- 11.2.11.2. Products
- 11.2.11.3. SWOT Analysis
- 11.2.11.4. Recent Developments
- 11.2.11.5. Financials (Based on Availability)
- 11.2.12 ERTUNÇÖZCAN
- 11.2.12.1. Overview
- 11.2.12.2. Products
- 11.2.12.3. SWOT Analysis
- 11.2.12.4. Recent Developments
- 11.2.12.5. Financials (Based on Availability)
- 11.2.13 Dev Electromedical Pvt
- 11.2.13.1. Overview
- 11.2.13.2. Products
- 11.2.13.3. SWOT Analysis
- 11.2.13.4. Recent Developments
- 11.2.13.5. Financials (Based on Availability)
- 11.2.1 Gpcmedical
List of Figures
- Figure 1: Global LED Phototherapy Units Revenue Breakdown (undefined, %) by Region 2025 & 2033
- Figure 2: Global LED Phototherapy Units Volume Breakdown (K, %) by Region 2025 & 2033
- Figure 3: North America LED Phototherapy Units Revenue (undefined), by Application 2025 & 2033
- Figure 4: North America LED Phototherapy Units Volume (K), by Application 2025 & 2033
- Figure 5: North America LED Phototherapy Units Revenue Share (%), by Application 2025 & 2033
- Figure 6: North America LED Phototherapy Units Volume Share (%), by Application 2025 & 2033
- Figure 7: North America LED Phototherapy Units Revenue (undefined), by Types 2025 & 2033
- Figure 8: North America LED Phototherapy Units Volume (K), by Types 2025 & 2033
- Figure 9: North America LED Phototherapy Units Revenue Share (%), by Types 2025 & 2033
- Figure 10: North America LED Phototherapy Units Volume Share (%), by Types 2025 & 2033
- Figure 11: North America LED Phototherapy Units Revenue (undefined), by Country 2025 & 2033
- Figure 12: North America LED Phototherapy Units Volume (K), by Country 2025 & 2033
- Figure 13: North America LED Phototherapy Units Revenue Share (%), by Country 2025 & 2033
- Figure 14: North America LED Phototherapy Units Volume Share (%), by Country 2025 & 2033
- Figure 15: South America LED Phototherapy Units Revenue (undefined), by Application 2025 & 2033
- Figure 16: South America LED Phototherapy Units Volume (K), by Application 2025 & 2033
- Figure 17: South America LED Phototherapy Units Revenue Share (%), by Application 2025 & 2033
- Figure 18: South America LED Phototherapy Units Volume Share (%), by Application 2025 & 2033
- Figure 19: South America LED Phototherapy Units Revenue (undefined), by Types 2025 & 2033
- Figure 20: South America LED Phototherapy Units Volume (K), by Types 2025 & 2033
- Figure 21: South America LED Phototherapy Units Revenue Share (%), by Types 2025 & 2033
- Figure 22: South America LED Phototherapy Units Volume Share (%), by Types 2025 & 2033
- Figure 23: South America LED Phototherapy Units Revenue (undefined), by Country 2025 & 2033
- Figure 24: South America LED Phototherapy Units Volume (K), by Country 2025 & 2033
- Figure 25: South America LED Phototherapy Units Revenue Share (%), by Country 2025 & 2033
- Figure 26: South America LED Phototherapy Units Volume Share (%), by Country 2025 & 2033
- Figure 27: Europe LED Phototherapy Units Revenue (undefined), by Application 2025 & 2033
- Figure 28: Europe LED Phototherapy Units Volume (K), by Application 2025 & 2033
- Figure 29: Europe LED Phototherapy Units Revenue Share (%), by Application 2025 & 2033
- Figure 30: Europe LED Phototherapy Units Volume Share (%), by Application 2025 & 2033
- Figure 31: Europe LED Phototherapy Units Revenue (undefined), by Types 2025 & 2033
- Figure 32: Europe LED Phototherapy Units Volume (K), by Types 2025 & 2033
- Figure 33: Europe LED Phototherapy Units Revenue Share (%), by Types 2025 & 2033
- Figure 34: Europe LED Phototherapy Units Volume Share (%), by Types 2025 & 2033
- Figure 35: Europe LED Phototherapy Units Revenue (undefined), by Country 2025 & 2033
- Figure 36: Europe LED Phototherapy Units Volume (K), by Country 2025 & 2033
- Figure 37: Europe LED Phototherapy Units Revenue Share (%), by Country 2025 & 2033
- Figure 38: Europe LED Phototherapy Units Volume Share (%), by Country 2025 & 2033
- Figure 39: Middle East & Africa LED Phototherapy Units Revenue (undefined), by Application 2025 & 2033
- Figure 40: Middle East & Africa LED Phototherapy Units Volume (K), by Application 2025 & 2033
- Figure 41: Middle East & Africa LED Phototherapy Units Revenue Share (%), by Application 2025 & 2033
- Figure 42: Middle East & Africa LED Phototherapy Units Volume Share (%), by Application 2025 & 2033
- Figure 43: Middle East & Africa LED Phototherapy Units Revenue (undefined), by Types 2025 & 2033
- Figure 44: Middle East & Africa LED Phototherapy Units Volume (K), by Types 2025 & 2033
- Figure 45: Middle East & Africa LED Phototherapy Units Revenue Share (%), by Types 2025 & 2033
- Figure 46: Middle East & Africa LED Phototherapy Units Volume Share (%), by Types 2025 & 2033
- Figure 47: Middle East & Africa LED Phototherapy Units Revenue (undefined), by Country 2025 & 2033
- Figure 48: Middle East & Africa LED Phototherapy Units Volume (K), by Country 2025 & 2033
- Figure 49: Middle East & Africa LED Phototherapy Units Revenue Share (%), by Country 2025 & 2033
- Figure 50: Middle East & Africa LED Phototherapy Units Volume Share (%), by Country 2025 & 2033
- Figure 51: Asia Pacific LED Phototherapy Units Revenue (undefined), by Application 2025 & 2033
- Figure 52: Asia Pacific LED Phototherapy Units Volume (K), by Application 2025 & 2033
- Figure 53: Asia Pacific LED Phototherapy Units Revenue Share (%), by Application 2025 & 2033
- Figure 54: Asia Pacific LED Phototherapy Units Volume Share (%), by Application 2025 & 2033
- Figure 55: Asia Pacific LED Phototherapy Units Revenue (undefined), by Types 2025 & 2033
- Figure 56: Asia Pacific LED Phototherapy Units Volume (K), by Types 2025 & 2033
- Figure 57: Asia Pacific LED Phototherapy Units Revenue Share (%), by Types 2025 & 2033
- Figure 58: Asia Pacific LED Phototherapy Units Volume Share (%), by Types 2025 & 2033
- Figure 59: Asia Pacific LED Phototherapy Units Revenue (undefined), by Country 2025 & 2033
- Figure 60: Asia Pacific LED Phototherapy Units Volume (K), by Country 2025 & 2033
- Figure 61: Asia Pacific LED Phototherapy Units Revenue Share (%), by Country 2025 & 2033
- Figure 62: Asia Pacific LED Phototherapy Units Volume Share (%), by Country 2025 & 2033
List of Tables
- Table 1: Global LED Phototherapy Units Revenue undefined Forecast, by Application 2020 & 2033
- Table 2: Global LED Phototherapy Units Volume K Forecast, by Application 2020 & 2033
- Table 3: Global LED Phototherapy Units Revenue undefined Forecast, by Types 2020 & 2033
- Table 4: Global LED Phototherapy Units Volume K Forecast, by Types 2020 & 2033
- Table 5: Global LED Phototherapy Units Revenue undefined Forecast, by Region 2020 & 2033
- Table 6: Global LED Phototherapy Units Volume K Forecast, by Region 2020 & 2033
- Table 7: Global LED Phototherapy Units Revenue undefined Forecast, by Application 2020 & 2033
- Table 8: Global LED Phototherapy Units Volume K Forecast, by Application 2020 & 2033
- Table 9: Global LED Phototherapy Units Revenue undefined Forecast, by Types 2020 & 2033
- Table 10: Global LED Phototherapy Units Volume K Forecast, by Types 2020 & 2033
- Table 11: Global LED Phototherapy Units Revenue undefined Forecast, by Country 2020 & 2033
- Table 12: Global LED Phototherapy Units Volume K Forecast, by Country 2020 & 2033
- Table 13: United States LED Phototherapy Units Revenue (undefined) Forecast, by Application 2020 & 2033
- Table 14: United States LED Phototherapy Units Volume (K) Forecast, by Application 2020 & 2033
- Table 15: Canada LED Phototherapy Units Revenue (undefined) Forecast, by Application 2020 & 2033
- Table 16: Canada LED Phototherapy Units Volume (K) Forecast, by Application 2020 & 2033
- Table 17: Mexico LED Phototherapy Units Revenue (undefined) Forecast, by Application 2020 & 2033
- Table 18: Mexico LED Phototherapy Units Volume (K) Forecast, by Application 2020 & 2033
- Table 19: Global LED Phototherapy Units Revenue undefined Forecast, by Application 2020 & 2033
- Table 20: Global LED Phototherapy Units Volume K Forecast, by Application 2020 & 2033
- Table 21: Global LED Phototherapy Units Revenue undefined Forecast, by Types 2020 & 2033
- Table 22: Global LED Phototherapy Units Volume K Forecast, by Types 2020 & 2033
- Table 23: Global LED Phototherapy Units Revenue undefined Forecast, by Country 2020 & 2033
- Table 24: Global LED Phototherapy Units Volume K Forecast, by Country 2020 & 2033
- Table 25: Brazil LED Phototherapy Units Revenue (undefined) Forecast, by Application 2020 & 2033
- Table 26: Brazil LED Phototherapy Units Volume (K) Forecast, by Application 2020 & 2033
- Table 27: Argentina LED Phototherapy Units Revenue (undefined) Forecast, by Application 2020 & 2033
- Table 28: Argentina LED Phototherapy Units Volume (K) Forecast, by Application 2020 & 2033
- Table 29: Rest of South America LED Phototherapy Units Revenue (undefined) Forecast, by Application 2020 & 2033
- Table 30: Rest of South America LED Phototherapy Units Volume (K) Forecast, by Application 2020 & 2033
- Table 31: Global LED Phototherapy Units Revenue undefined Forecast, by Application 2020 & 2033
- Table 32: Global LED Phototherapy Units Volume K Forecast, by Application 2020 & 2033
- Table 33: Global LED Phototherapy Units Revenue undefined Forecast, by Types 2020 & 2033
- Table 34: Global LED Phototherapy Units Volume K Forecast, by Types 2020 & 2033
- Table 35: Global LED Phototherapy Units Revenue undefined Forecast, by Country 2020 & 2033
- Table 36: Global LED Phototherapy Units Volume K Forecast, by Country 2020 & 2033
- Table 37: United Kingdom LED Phototherapy Units Revenue (undefined) Forecast, by Application 2020 & 2033
- Table 38: United Kingdom LED Phototherapy Units Volume (K) Forecast, by Application 2020 & 2033
- Table 39: Germany LED Phototherapy Units Revenue (undefined) Forecast, by Application 2020 & 2033
- Table 40: Germany LED Phototherapy Units Volume (K) Forecast, by Application 2020 & 2033
- Table 41: France LED Phototherapy Units Revenue (undefined) Forecast, by Application 2020 & 2033
- Table 42: France LED Phototherapy Units Volume (K) Forecast, by Application 2020 & 2033
- Table 43: Italy LED Phototherapy Units Revenue (undefined) Forecast, by Application 2020 & 2033
- Table 44: Italy LED Phototherapy Units Volume (K) Forecast, by Application 2020 & 2033
- Table 45: Spain LED Phototherapy Units Revenue (undefined) Forecast, by Application 2020 & 2033
- Table 46: Spain LED Phototherapy Units Volume (K) Forecast, by Application 2020 & 2033
- Table 47: Russia LED Phototherapy Units Revenue (undefined) Forecast, by Application 2020 & 2033
- Table 48: Russia LED Phototherapy Units Volume (K) Forecast, by Application 2020 & 2033
- Table 49: Benelux LED Phototherapy Units Revenue (undefined) Forecast, by Application 2020 & 2033
- Table 50: Benelux LED Phototherapy Units Volume (K) Forecast, by Application 2020 & 2033
- Table 51: Nordics LED Phototherapy Units Revenue (undefined) Forecast, by Application 2020 & 2033
- Table 52: Nordics LED Phototherapy Units Volume (K) Forecast, by Application 2020 & 2033
- Table 53: Rest of Europe LED Phototherapy Units Revenue (undefined) Forecast, by Application 2020 & 2033
- Table 54: Rest of Europe LED Phototherapy Units Volume (K) Forecast, by Application 2020 & 2033
- Table 55: Global LED Phototherapy Units Revenue undefined Forecast, by Application 2020 & 2033
- Table 56: Global LED Phototherapy Units Volume K Forecast, by Application 2020 & 2033
- Table 57: Global LED Phototherapy Units Revenue undefined Forecast, by Types 2020 & 2033
- Table 58: Global LED Phototherapy Units Volume K Forecast, by Types 2020 & 2033
- Table 59: Global LED Phototherapy Units Revenue undefined Forecast, by Country 2020 & 2033
- Table 60: Global LED Phototherapy Units Volume K Forecast, by Country 2020 & 2033
- Table 61: Turkey LED Phototherapy Units Revenue (undefined) Forecast, by Application 2020 & 2033
- Table 62: Turkey LED Phototherapy Units Volume (K) Forecast, by Application 2020 & 2033
- Table 63: Israel LED Phototherapy Units Revenue (undefined) Forecast, by Application 2020 & 2033
- Table 64: Israel LED Phototherapy Units Volume (K) Forecast, by Application 2020 & 2033
- Table 65: GCC LED Phototherapy Units Revenue (undefined) Forecast, by Application 2020 & 2033
- Table 66: GCC LED Phototherapy Units Volume (K) Forecast, by Application 2020 & 2033
- Table 67: North Africa LED Phototherapy Units Revenue (undefined) Forecast, by Application 2020 & 2033
- Table 68: North Africa LED Phototherapy Units Volume (K) Forecast, by Application 2020 & 2033
- Table 69: South Africa LED Phototherapy Units Revenue (undefined) Forecast, by Application 2020 & 2033
- Table 70: South Africa LED Phototherapy Units Volume (K) Forecast, by Application 2020 & 2033
- Table 71: Rest of Middle East & Africa LED Phototherapy Units Revenue (undefined) Forecast, by Application 2020 & 2033
- Table 72: Rest of Middle East & Africa LED Phototherapy Units Volume (K) Forecast, by Application 2020 & 2033
- Table 73: Global LED Phototherapy Units Revenue undefined Forecast, by Application 2020 & 2033
- Table 74: Global LED Phototherapy Units Volume K Forecast, by Application 2020 & 2033
- Table 75: Global LED Phototherapy Units Revenue undefined Forecast, by Types 2020 & 2033
- Table 76: Global LED Phototherapy Units Volume K Forecast, by Types 2020 & 2033
- Table 77: Global LED Phototherapy Units Revenue undefined Forecast, by Country 2020 & 2033
- Table 78: Global LED Phototherapy Units Volume K Forecast, by Country 2020 & 2033
- Table 79: China LED Phototherapy Units Revenue (undefined) Forecast, by Application 2020 & 2033
- Table 80: China LED Phototherapy Units Volume (K) Forecast, by Application 2020 & 2033
- Table 81: India LED Phototherapy Units Revenue (undefined) Forecast, by Application 2020 & 2033
- Table 82: India LED Phototherapy Units Volume (K) Forecast, by Application 2020 & 2033
- Table 83: Japan LED Phototherapy Units Revenue (undefined) Forecast, by Application 2020 & 2033
- Table 84: Japan LED Phototherapy Units Volume (K) Forecast, by Application 2020 & 2033
- Table 85: South Korea LED Phototherapy Units Revenue (undefined) Forecast, by Application 2020 & 2033
- Table 86: South Korea LED Phototherapy Units Volume (K) Forecast, by Application 2020 & 2033
- Table 87: ASEAN LED Phototherapy Units Revenue (undefined) Forecast, by Application 2020 & 2033
- Table 88: ASEAN LED Phototherapy Units Volume (K) Forecast, by Application 2020 & 2033
- Table 89: Oceania LED Phototherapy Units Revenue (undefined) Forecast, by Application 2020 & 2033
- Table 90: Oceania LED Phototherapy Units Volume (K) Forecast, by Application 2020 & 2033
- Table 91: Rest of Asia Pacific LED Phototherapy Units Revenue (undefined) Forecast, by Application 2020 & 2033
- Table 92: Rest of Asia Pacific LED Phototherapy Units Volume (K) Forecast, by Application 2020 & 2033
Frequently Asked Questions
1. What is the projected Compound Annual Growth Rate (CAGR) of the LED Phototherapy Units?
The projected CAGR is approximately 4.02%.
2. Which companies are prominent players in the LED Phototherapy Units?
Key companies in the market include Gpcmedical, Nice Neotech Medical Systems Pvt, GE Healthcare, NR Surgicals, Carevel Medical Systems Private Limited, Matrix Medical System, Kay & Company, Phoenix Medical Systems, Ibis Medical, Avihealthcare, OM SAI MEDICAL, ERTUNÇÖZCAN, Dev Electromedical Pvt.
3. What are the main segments of the LED Phototherapy Units?
The market segments include Application, Types.
4. Can you provide details about the market size?
The market size is estimated to be USD XXX N/A as of 2022.
5. What are some drivers contributing to market growth?
N/A
6. What are the notable trends driving market growth?
N/A
7. Are there any restraints impacting market growth?
N/A
8. Can you provide examples of recent developments in the market?
N/A
9. What pricing options are available for accessing the report?
Pricing options include single-user, multi-user, and enterprise licenses priced at USD 3350.00, USD 5025.00, and USD 6700.00 respectively.
10. Is the market size provided in terms of value or volume?
The market size is provided in terms of value, measured in N/A and volume, measured in K.
11. Are there any specific market keywords associated with the report?
Yes, the market keyword associated with the report is "LED Phototherapy Units," which aids in identifying and referencing the specific market segment covered.
12. How do I determine which pricing option suits my needs best?
The pricing options vary based on user requirements and access needs. Individual users may opt for single-user licenses, while businesses requiring broader access may choose multi-user or enterprise licenses for cost-effective access to the report.
13. Are there any additional resources or data provided in the LED Phototherapy Units report?
While the report offers comprehensive insights, it's advisable to review the specific contents or supplementary materials provided to ascertain if additional resources or data are available.
14. How can I stay updated on further developments or reports in the LED Phototherapy Units?
To stay informed about further developments, trends, and reports in the LED Phototherapy Units, consider subscribing to industry newsletters, following relevant companies and organizations, or regularly checking reputable industry news sources and publications.
Methodology
Step 1 - Identification of Relevant Samples Size from Population Database


Step 2 - Approaches for Defining Global Market Size (Value, Volume* & Price*)

Note*: In applicable scenarios
Step 3 - Data Sources
Primary Research
- Web Analytics
- Survey Reports
- Research Institute
- Latest Research Reports
- Opinion Leaders
Secondary Research
- Annual Reports
- White Paper
- Latest Press Release
- Industry Association
- Paid Database
- Investor Presentations

Step 4 - Data Triangulation
Involves using different sources of information in order to increase the validity of a study
These sources are likely to be stakeholders in a program - participants, other researchers, program staff, other community members, and so on.
Then we put all data in single framework & apply various statistical tools to find out the dynamic on the market.
During the analysis stage, feedback from the stakeholder groups would be compared to determine areas of agreement as well as areas of divergence