

Key Insights
The global intelligent lighting market is poised for significant expansion, projected to reach approximately $35.2 billion by 2025, demonstrating robust growth with a compound annual growth rate (CAGR) of 7.8% through 2033. This surge is primarily driven by an increasing demand for energy efficiency and sustainability across various sectors. Governments worldwide are implementing stricter regulations for energy conservation, further propelling the adoption of smart lighting solutions that optimize energy consumption through features like daylight harvesting and occupancy sensing. The burgeoning trend of smart cities, with their focus on enhancing urban infrastructure and citizen well-being, also significantly contributes to market growth. This includes applications in street lighting, where intelligent systems reduce energy waste and improve safety, and commercial buildings, where they enhance operational efficiency and occupant comfort. The hospitality sector is also a key growth area, leveraging smart lighting to create personalized guest experiences and reduce operational costs.
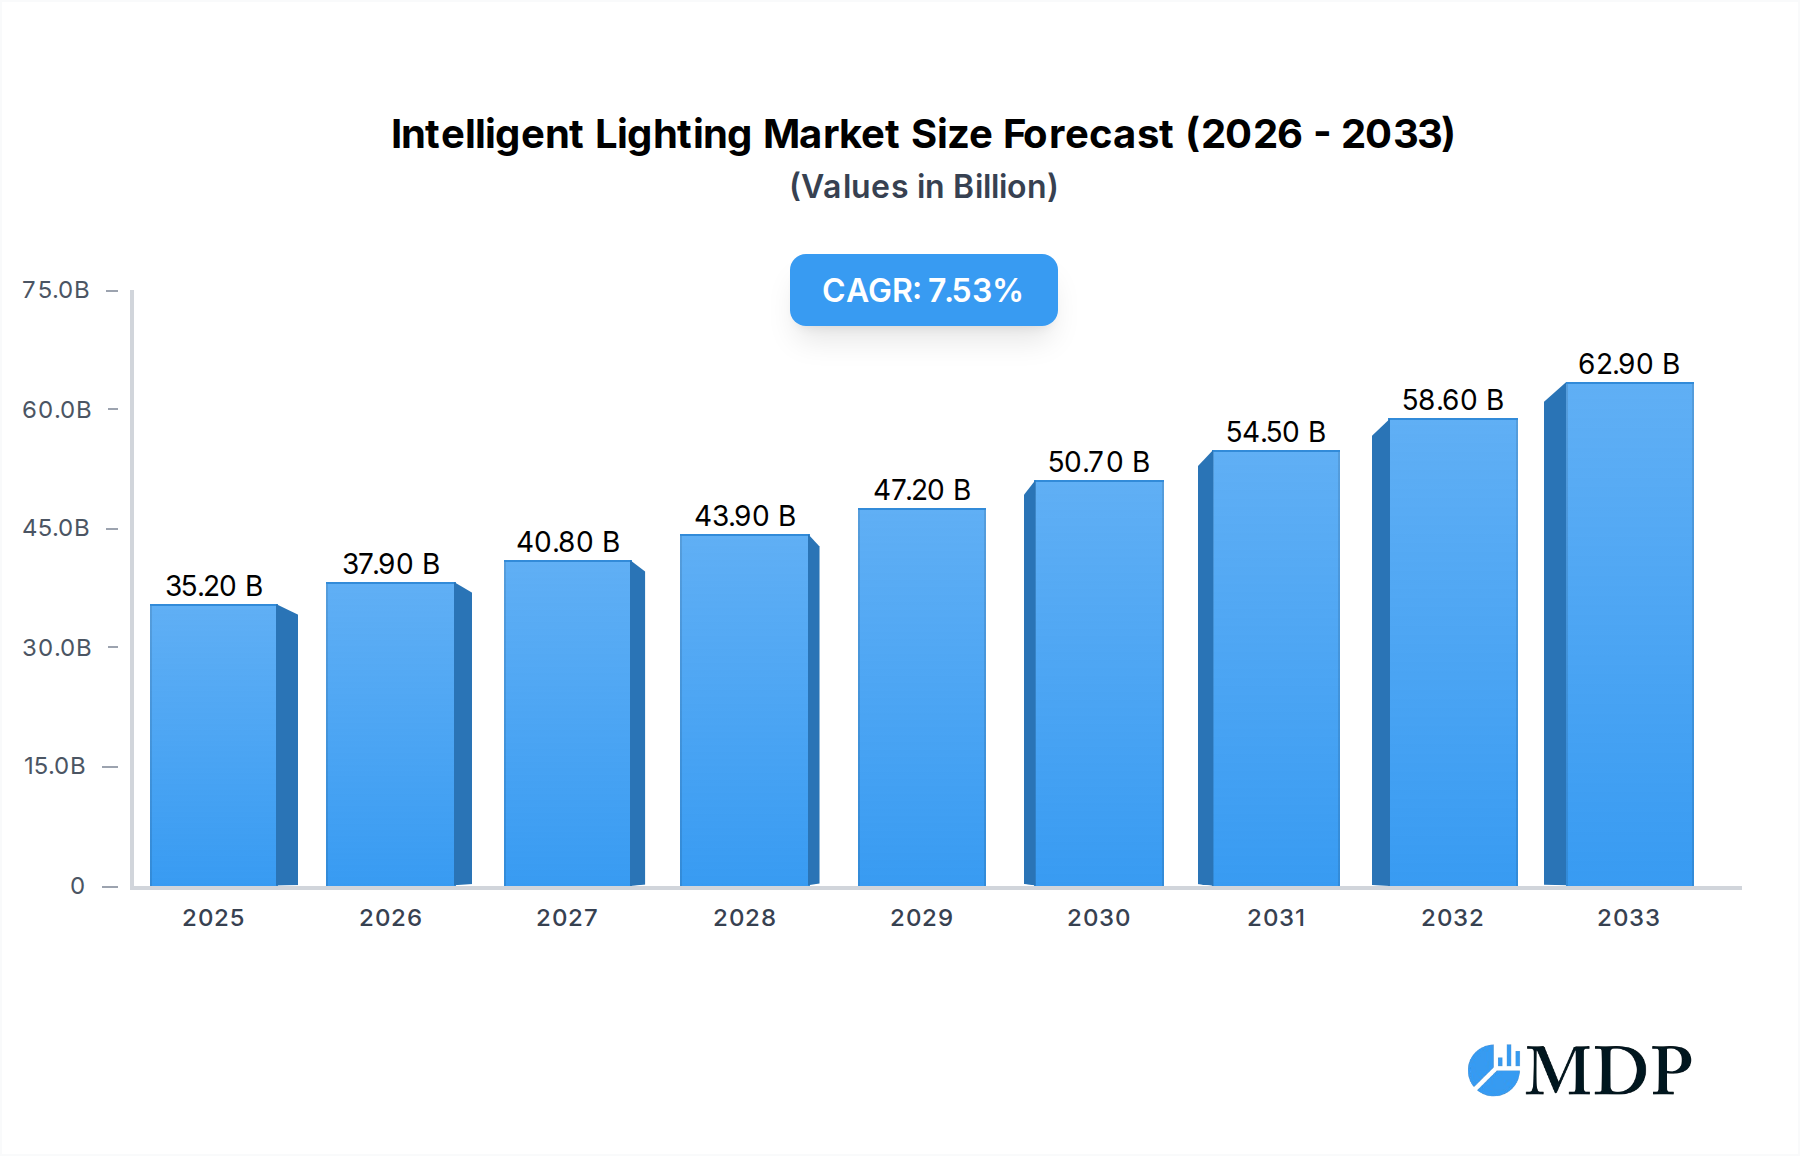
Intelligent Lighting Market Size (In Billion)
The intelligent lighting market is characterized by a diverse range of applications and technologies. Key segments include street lighting, commercial buildings, hospitality, and residential spaces, each presenting unique growth opportunities. On the technology front, daylight sensing and occupancy sensing are leading innovations, offering substantial energy savings and convenience. Ultrasonic sensing is also gaining traction for its precision in detecting motion. While the market is driven by these technological advancements and the imperative for energy efficiency, certain restraints exist. High initial installation costs for sophisticated intelligent lighting systems can pose a barrier, particularly for smaller businesses and residential consumers. However, the declining cost of smart components and the long-term return on investment through energy savings are mitigating these concerns. Leading companies such as Signify, OSRAM, and Acuity Brands are at the forefront of innovation, developing advanced solutions to meet the evolving demands of this dynamic market.

Intelligent Lighting Company Market Share
Intelligent Lighting Market: Comprehensive Report | 2019-2033 (USD Billion)
This in-depth report provides a comprehensive analysis of the global Intelligent Lighting market, forecasting significant growth and evolution through 2033. We delve into market dynamics, key trends, leading segments, product innovations, growth drivers, challenges, emerging opportunities, and the competitive landscape. This report is an indispensable resource for industry stakeholders, including manufacturers, suppliers, investors, and policymakers seeking to understand the intricate workings and future trajectory of the intelligent lighting industry. The study period covers 2019–2033, with a base year of 2025, and a forecast period from 2025–2033.
Intelligent Lighting Market Dynamics & Concentration
The Intelligent Lighting market exhibits a moderate to high concentration, with a few dominant players holding substantial market share. Innovation remains a primary driver, fueled by advancements in IoT, AI, and energy efficiency technologies. Regulatory frameworks, such as energy performance standards and smart city initiatives, are increasingly influencing market adoption. Product substitutes, primarily traditional lighting solutions, continue to pose a competitive challenge, though the superior benefits of intelligent systems are gradually shifting preferences. End-user trends indicate a growing demand for personalized lighting experiences, enhanced security, and seamless integration with smart home and building ecosystems. Mergers and acquisitions (M&A) activities are a significant aspect of market consolidation, with recent years witnessing several strategic alliances aimed at expanding product portfolios and geographical reach. For instance, the number of M&A deals in the historical period 2019-2024 reached xx, indicating active industry restructuring. Market share for the top 5 companies in the base year 2025 is estimated to be around xx billion.
Intelligent Lighting Industry Trends & Analysis
The Intelligent Lighting industry is poised for robust growth, driven by an escalating demand for energy-efficient and automated lighting solutions. The market is experiencing a substantial compound annual growth rate (CAGR) of approximately xx% during the forecast period (2025–2033). Technological disruptions, including the widespread adoption of LED technology, the integration of sensors (daylight and occupancy), and the rise of artificial intelligence (AI) for adaptive lighting control, are revolutionizing the sector. Consumer preferences are shifting towards smart lighting systems that offer convenience, enhanced ambiance, and security features, particularly in residential and hospitality sectors. The increasing penetration of smart home devices and the growing awareness of the environmental benefits of energy-efficient lighting are further accelerating market growth. Competitive dynamics are characterized by intense innovation, with companies vying to offer differentiated products with advanced functionalities and seamless connectivity. The market penetration of intelligent lighting solutions is projected to reach xx% by 2033, up from xx% in the base year 2025. The total market size is projected to reach an estimated value of $xxx billion by the end of 2033.
Leading Markets & Segments in Intelligent Lighting
The Commercial Building segment is projected to dominate the global Intelligent Lighting market, driven by significant investments in smart infrastructure and the pursuit of energy savings in office spaces, retail environments, and public facilities. The adoption of intelligent lighting in street lighting is also experiencing considerable growth, propelled by government initiatives for smart city development and the desire for enhanced public safety and energy management.
Key Drivers for Dominance in Commercial Buildings:
- Economic Policies: Government incentives and tax credits for energy-efficient building retrofits and new constructions.
- Infrastructure Development: Significant investments in modernizing commercial infrastructure to incorporate smart technologies.
- Operational Cost Reduction: Businesses prioritizing reduced energy bills and maintenance costs through automated lighting systems.
- Employee Productivity & Well-being: Increasing recognition of the impact of lighting quality on occupant comfort and productivity.
In terms of application types, Daylight Sensing and Occupancy Sensing technologies are leading the charge, offering substantial energy savings by automatically adjusting light levels based on natural light availability and the presence of occupants. The Street Lighting application is also a major contributor, benefiting from the integration of smart controls for remote monitoring, dimming, and fault detection, leading to optimized energy consumption and reduced operational expenses. The market penetration in the commercial building segment is estimated to reach xx% by 2033. The global intelligent street lighting market is projected to reach $xxx billion by 2033.
Intelligent Lighting Product Developments
Product innovation in Intelligent Lighting is characterized by the development of sophisticated systems that integrate advanced sensors, AI-driven control algorithms, and seamless connectivity. Innovations focus on enhancing user experience through personalized lighting scenes, circadian rhythm synchronization, and predictive maintenance. Applications are expanding beyond basic illumination to encompass security, health and well-being, and building management. Competitive advantages are being built on energy efficiency, ease of integration with existing smart ecosystems, and robust data analytics capabilities. The market is seeing a rise in connected lighting solutions that offer remote control and monitoring, contributing to the overall value proposition.
Key Drivers of Intelligent Lighting Growth
The Intelligent Lighting market is propelled by several key drivers. Technological advancements, including the widespread adoption of energy-efficient LED technology and the integration of Internet of Things (IoT) capabilities, are fundamental. Economic factors, such as the growing emphasis on reducing energy consumption and operational costs across various sectors, are significant. Furthermore, supportive regulatory frameworks, including government mandates for energy efficiency and the promotion of smart city initiatives, are accelerating market penetration. The increasing consumer demand for smart home automation and enhanced living experiences also plays a crucial role.
Challenges in the Intelligent Lighting Market
Despite its growth potential, the Intelligent Lighting market faces several challenges. High upfront installation costs can be a deterrent for some consumers and businesses, particularly in developing economies. Regulatory hurdles and the lack of standardization in some regions can hinder widespread adoption. Supply chain complexities and the reliance on specialized components can also pose challenges. Furthermore, intense competitive pressures from established lighting manufacturers and emerging smart technology players necessitate continuous innovation and competitive pricing strategies. The cybersecurity concerns associated with connected devices also present a significant barrier that needs to be addressed.
Emerging Opportunities in Intelligent Lighting
Catalysts driving long-term growth in the Intelligent Lighting market are numerous. The burgeoning smart city initiatives globally present a significant opportunity for the widespread deployment of intelligent street lighting and public space illumination systems. Technological breakthroughs in areas like visible light communication (VLC) and advanced sensor technologies are opening up new application areas, such as indoor positioning and data analytics. Strategic partnerships between lighting manufacturers, technology providers, and real estate developers are crucial for creating integrated smart building solutions. Market expansion into emerging economies, driven by increasing disposable incomes and a growing awareness of energy conservation, also represents a substantial long-term opportunity.
Leading Players in the Intelligent Lighting Sector
- Signify
- OSRAM
- Acuity Brands
- Eaton
- Cree lighting
- GE Lighting
- Legrand SA
- Lutron Electronics Company
- Zumtobel AG
- LIFX
- Tvilight
- ESYLUX
- Jiawei Renewable Energy
- Etherba
- Nanoleaf
- Leedarson IoT Technology
Key Milestones in Intelligent Lighting Industry
- 2019: Increased adoption of AI in lighting control systems for predictive analytics.
- 2020: Significant growth in smart home lighting integration with voice assistants.
- 2021: Launch of new energy-efficient LED technologies with enhanced color rendering.
- 2022: Growing interest in human-centric lighting solutions for improved well-being.
- 2023: Expansion of smart city projects incorporating intelligent street lighting infrastructure.
- 2024: Increased M&A activity focused on IoT platform integration and data analytics capabilities.
Strategic Outlook for Intelligent Lighting Market
The strategic outlook for the Intelligent Lighting market is exceptionally positive, driven by an accelerating shift towards smart, sustainable, and interconnected environments. Key growth accelerators include the continued advancement of IoT and AI technologies, enabling more sophisticated automation and personalization. The increasing global focus on energy efficiency and carbon footprint reduction will further fuel demand for intelligent lighting solutions. Strategic opportunities lie in developing integrated smart building platforms, expanding into underserved markets, and focusing on cybersecurity to build trust and ensure seamless adoption. The market is expected to witness sustained innovation and strategic collaborations, positioning intelligent lighting as a cornerstone of future smart infrastructure.
Intelligent Lighting Segmentation
-
1. Application
- 1.1. Street Lighting
- 1.2. Commercial Building
- 1.3. Hospitality
- 1.4. Residential
- 1.5. Other
-
2. Types
- 2.1. Daylight Sensing
- 2.2. Occupancy Sensing
- 2.3. Ultrasonic
- 2.4. Other
Intelligent Lighting Segmentation By Geography
-
1. North America
- 1.1. United States
- 1.2. Canada
- 1.3. Mexico
-
2. South America
- 2.1. Brazil
- 2.2. Argentina
- 2.3. Rest of South America
-
3. Europe
- 3.1. United Kingdom
- 3.2. Germany
- 3.3. France
- 3.4. Italy
- 3.5. Spain
- 3.6. Russia
- 3.7. Benelux
- 3.8. Nordics
- 3.9. Rest of Europe
-
4. Middle East & Africa
- 4.1. Turkey
- 4.2. Israel
- 4.3. GCC
- 4.4. North Africa
- 4.5. South Africa
- 4.6. Rest of Middle East & Africa
-
5. Asia Pacific
- 5.1. China
- 5.2. India
- 5.3. Japan
- 5.4. South Korea
- 5.5. ASEAN
- 5.6. Oceania
- 5.7. Rest of Asia Pacific
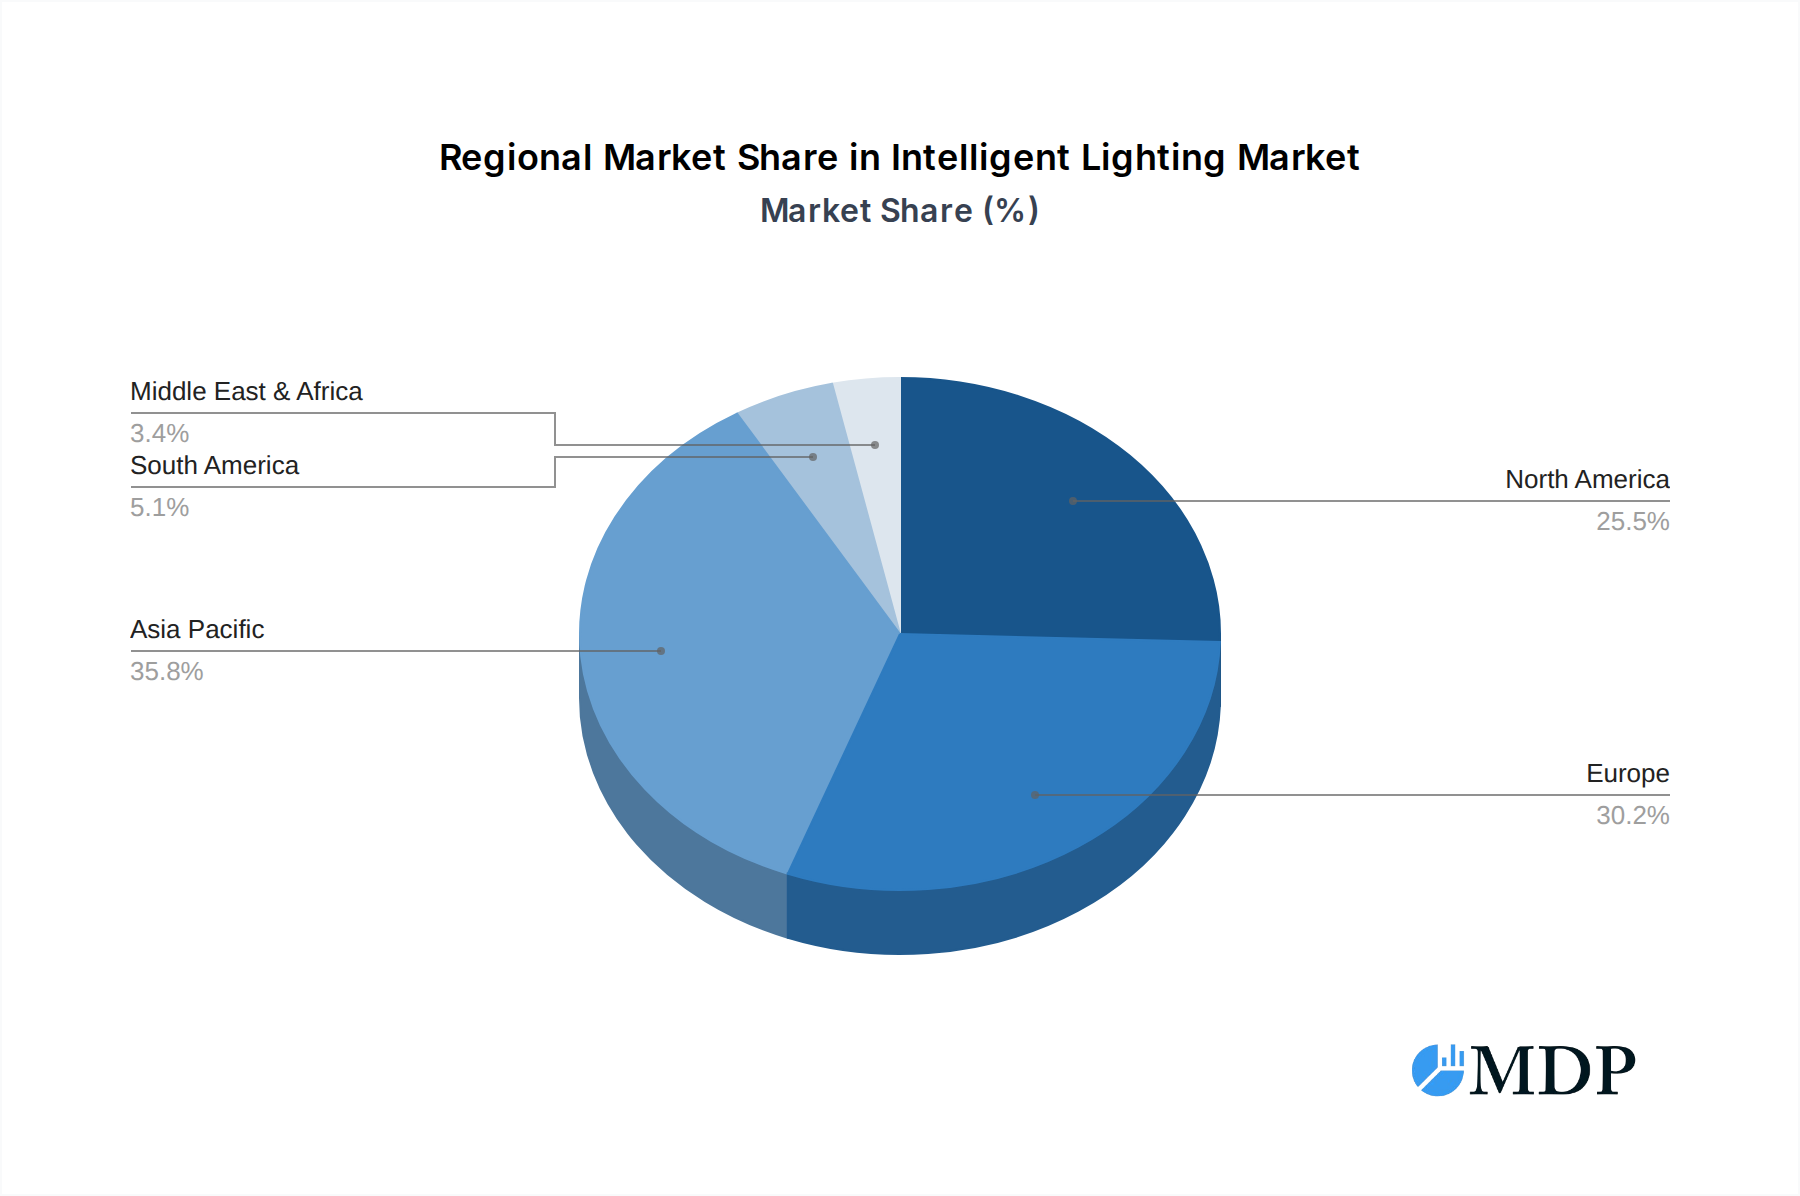
Intelligent Lighting Regional Market Share
Geographic Coverage of Intelligent Lighting
Intelligent Lighting REPORT HIGHLIGHTS
| Aspects | Details |
|---|---|
| Study Period | 2020-2034 |
| Base Year | 2025 |
| Estimated Year | 2026 |
| Forecast Period | 2026-2034 |
| Historical Period | 2020-2025 |
| Growth Rate | CAGR of 7.8% from 2020-2034 |
| Segmentation |
|
Table of Contents
- 1. Introduction
- 1.1. Research Scope
- 1.2. Market Segmentation
- 1.3. Research Methodology
- 1.4. Definitions and Assumptions
- 2. Executive Summary
- 2.1. Introduction
- 3. Market Dynamics
- 3.1. Introduction
- 3.2. Market Drivers
- 3.3. Market Restrains
- 3.4. Market Trends
- 4. Market Factor Analysis
- 4.1. Porters Five Forces
- 4.2. Supply/Value Chain
- 4.3. PESTEL analysis
- 4.4. Market Entropy
- 4.5. Patent/Trademark Analysis
- 5. Global Intelligent Lighting Analysis, Insights and Forecast, 2020-2032
- 5.1. Market Analysis, Insights and Forecast - by Application
- 5.1.1. Street Lighting
- 5.1.2. Commercial Building
- 5.1.3. Hospitality
- 5.1.4. Residential
- 5.1.5. Other
- 5.2. Market Analysis, Insights and Forecast - by Types
- 5.2.1. Daylight Sensing
- 5.2.2. Occupancy Sensing
- 5.2.3. Ultrasonic
- 5.2.4. Other
- 5.3. Market Analysis, Insights and Forecast - by Region
- 5.3.1. North America
- 5.3.2. South America
- 5.3.3. Europe
- 5.3.4. Middle East & Africa
- 5.3.5. Asia Pacific
- 5.1. Market Analysis, Insights and Forecast - by Application
- 6. North America Intelligent Lighting Analysis, Insights and Forecast, 2020-2032
- 6.1. Market Analysis, Insights and Forecast - by Application
- 6.1.1. Street Lighting
- 6.1.2. Commercial Building
- 6.1.3. Hospitality
- 6.1.4. Residential
- 6.1.5. Other
- 6.2. Market Analysis, Insights and Forecast - by Types
- 6.2.1. Daylight Sensing
- 6.2.2. Occupancy Sensing
- 6.2.3. Ultrasonic
- 6.2.4. Other
- 6.1. Market Analysis, Insights and Forecast - by Application
- 7. South America Intelligent Lighting Analysis, Insights and Forecast, 2020-2032
- 7.1. Market Analysis, Insights and Forecast - by Application
- 7.1.1. Street Lighting
- 7.1.2. Commercial Building
- 7.1.3. Hospitality
- 7.1.4. Residential
- 7.1.5. Other
- 7.2. Market Analysis, Insights and Forecast - by Types
- 7.2.1. Daylight Sensing
- 7.2.2. Occupancy Sensing
- 7.2.3. Ultrasonic
- 7.2.4. Other
- 7.1. Market Analysis, Insights and Forecast - by Application
- 8. Europe Intelligent Lighting Analysis, Insights and Forecast, 2020-2032
- 8.1. Market Analysis, Insights and Forecast - by Application
- 8.1.1. Street Lighting
- 8.1.2. Commercial Building
- 8.1.3. Hospitality
- 8.1.4. Residential
- 8.1.5. Other
- 8.2. Market Analysis, Insights and Forecast - by Types
- 8.2.1. Daylight Sensing
- 8.2.2. Occupancy Sensing
- 8.2.3. Ultrasonic
- 8.2.4. Other
- 8.1. Market Analysis, Insights and Forecast - by Application
- 9. Middle East & Africa Intelligent Lighting Analysis, Insights and Forecast, 2020-2032
- 9.1. Market Analysis, Insights and Forecast - by Application
- 9.1.1. Street Lighting
- 9.1.2. Commercial Building
- 9.1.3. Hospitality
- 9.1.4. Residential
- 9.1.5. Other
- 9.2. Market Analysis, Insights and Forecast - by Types
- 9.2.1. Daylight Sensing
- 9.2.2. Occupancy Sensing
- 9.2.3. Ultrasonic
- 9.2.4. Other
- 9.1. Market Analysis, Insights and Forecast - by Application
- 10. Asia Pacific Intelligent Lighting Analysis, Insights and Forecast, 2020-2032
- 10.1. Market Analysis, Insights and Forecast - by Application
- 10.1.1. Street Lighting
- 10.1.2. Commercial Building
- 10.1.3. Hospitality
- 10.1.4. Residential
- 10.1.5. Other
- 10.2. Market Analysis, Insights and Forecast - by Types
- 10.2.1. Daylight Sensing
- 10.2.2. Occupancy Sensing
- 10.2.3. Ultrasonic
- 10.2.4. Other
- 10.1. Market Analysis, Insights and Forecast - by Application
- 11. Competitive Analysis
- 11.1. Global Market Share Analysis 2025
- 11.2. Company Profiles
- 11.2.1 Signify
- 11.2.1.1. Overview
- 11.2.1.2. Products
- 11.2.1.3. SWOT Analysis
- 11.2.1.4. Recent Developments
- 11.2.1.5. Financials (Based on Availability)
- 11.2.2 OSRAM
- 11.2.2.1. Overview
- 11.2.2.2. Products
- 11.2.2.3. SWOT Analysis
- 11.2.2.4. Recent Developments
- 11.2.2.5. Financials (Based on Availability)
- 11.2.3 Acuity Brands
- 11.2.3.1. Overview
- 11.2.3.2. Products
- 11.2.3.3. SWOT Analysis
- 11.2.3.4. Recent Developments
- 11.2.3.5. Financials (Based on Availability)
- 11.2.4 Eaton
- 11.2.4.1. Overview
- 11.2.4.2. Products
- 11.2.4.3. SWOT Analysis
- 11.2.4.4. Recent Developments
- 11.2.4.5. Financials (Based on Availability)
- 11.2.5 Cree lighting
- 11.2.5.1. Overview
- 11.2.5.2. Products
- 11.2.5.3. SWOT Analysis
- 11.2.5.4. Recent Developments
- 11.2.5.5. Financials (Based on Availability)
- 11.2.6 GE Lighting
- 11.2.6.1. Overview
- 11.2.6.2. Products
- 11.2.6.3. SWOT Analysis
- 11.2.6.4. Recent Developments
- 11.2.6.5. Financials (Based on Availability)
- 11.2.7 Legrand SA
- 11.2.7.1. Overview
- 11.2.7.2. Products
- 11.2.7.3. SWOT Analysis
- 11.2.7.4. Recent Developments
- 11.2.7.5. Financials (Based on Availability)
- 11.2.8 Lutron Electronics Company
- 11.2.8.1. Overview
- 11.2.8.2. Products
- 11.2.8.3. SWOT Analysis
- 11.2.8.4. Recent Developments
- 11.2.8.5. Financials (Based on Availability)
- 11.2.9 Zumtobel AG
- 11.2.9.1. Overview
- 11.2.9.2. Products
- 11.2.9.3. SWOT Analysis
- 11.2.9.4. Recent Developments
- 11.2.9.5. Financials (Based on Availability)
- 11.2.10 LIFX
- 11.2.10.1. Overview
- 11.2.10.2. Products
- 11.2.10.3. SWOT Analysis
- 11.2.10.4. Recent Developments
- 11.2.10.5. Financials (Based on Availability)
- 11.2.11 Tvilight
- 11.2.11.1. Overview
- 11.2.11.2. Products
- 11.2.11.3. SWOT Analysis
- 11.2.11.4. Recent Developments
- 11.2.11.5. Financials (Based on Availability)
- 11.2.12 ESYLUX
- 11.2.12.1. Overview
- 11.2.12.2. Products
- 11.2.12.3. SWOT Analysis
- 11.2.12.4. Recent Developments
- 11.2.12.5. Financials (Based on Availability)
- 11.2.13 Jiawei Renewable Energy
- 11.2.13.1. Overview
- 11.2.13.2. Products
- 11.2.13.3. SWOT Analysis
- 11.2.13.4. Recent Developments
- 11.2.13.5. Financials (Based on Availability)
- 11.2.14 Etherba
- 11.2.14.1. Overview
- 11.2.14.2. Products
- 11.2.14.3. SWOT Analysis
- 11.2.14.4. Recent Developments
- 11.2.14.5. Financials (Based on Availability)
- 11.2.15 Nanoleaf
- 11.2.15.1. Overview
- 11.2.15.2. Products
- 11.2.15.3. SWOT Analysis
- 11.2.15.4. Recent Developments
- 11.2.15.5. Financials (Based on Availability)
- 11.2.16 Leedarson IoT Technology
- 11.2.16.1. Overview
- 11.2.16.2. Products
- 11.2.16.3. SWOT Analysis
- 11.2.16.4. Recent Developments
- 11.2.16.5. Financials (Based on Availability)
- 11.2.1 Signify
List of Figures
- Figure 1: Global Intelligent Lighting Revenue Breakdown (billion, %) by Region 2025 & 2033
- Figure 2: Global Intelligent Lighting Volume Breakdown (K, %) by Region 2025 & 2033
- Figure 3: North America Intelligent Lighting Revenue (billion), by Application 2025 & 2033
- Figure 4: North America Intelligent Lighting Volume (K), by Application 2025 & 2033
- Figure 5: North America Intelligent Lighting Revenue Share (%), by Application 2025 & 2033
- Figure 6: North America Intelligent Lighting Volume Share (%), by Application 2025 & 2033
- Figure 7: North America Intelligent Lighting Revenue (billion), by Types 2025 & 2033
- Figure 8: North America Intelligent Lighting Volume (K), by Types 2025 & 2033
- Figure 9: North America Intelligent Lighting Revenue Share (%), by Types 2025 & 2033
- Figure 10: North America Intelligent Lighting Volume Share (%), by Types 2025 & 2033
- Figure 11: North America Intelligent Lighting Revenue (billion), by Country 2025 & 2033
- Figure 12: North America Intelligent Lighting Volume (K), by Country 2025 & 2033
- Figure 13: North America Intelligent Lighting Revenue Share (%), by Country 2025 & 2033
- Figure 14: North America Intelligent Lighting Volume Share (%), by Country 2025 & 2033
- Figure 15: South America Intelligent Lighting Revenue (billion), by Application 2025 & 2033
- Figure 16: South America Intelligent Lighting Volume (K), by Application 2025 & 2033
- Figure 17: South America Intelligent Lighting Revenue Share (%), by Application 2025 & 2033
- Figure 18: South America Intelligent Lighting Volume Share (%), by Application 2025 & 2033
- Figure 19: South America Intelligent Lighting Revenue (billion), by Types 2025 & 2033
- Figure 20: South America Intelligent Lighting Volume (K), by Types 2025 & 2033
- Figure 21: South America Intelligent Lighting Revenue Share (%), by Types 2025 & 2033
- Figure 22: South America Intelligent Lighting Volume Share (%), by Types 2025 & 2033
- Figure 23: South America Intelligent Lighting Revenue (billion), by Country 2025 & 2033
- Figure 24: South America Intelligent Lighting Volume (K), by Country 2025 & 2033
- Figure 25: South America Intelligent Lighting Revenue Share (%), by Country 2025 & 2033
- Figure 26: South America Intelligent Lighting Volume Share (%), by Country 2025 & 2033
- Figure 27: Europe Intelligent Lighting Revenue (billion), by Application 2025 & 2033
- Figure 28: Europe Intelligent Lighting Volume (K), by Application 2025 & 2033
- Figure 29: Europe Intelligent Lighting Revenue Share (%), by Application 2025 & 2033
- Figure 30: Europe Intelligent Lighting Volume Share (%), by Application 2025 & 2033
- Figure 31: Europe Intelligent Lighting Revenue (billion), by Types 2025 & 2033
- Figure 32: Europe Intelligent Lighting Volume (K), by Types 2025 & 2033
- Figure 33: Europe Intelligent Lighting Revenue Share (%), by Types 2025 & 2033
- Figure 34: Europe Intelligent Lighting Volume Share (%), by Types 2025 & 2033
- Figure 35: Europe Intelligent Lighting Revenue (billion), by Country 2025 & 2033
- Figure 36: Europe Intelligent Lighting Volume (K), by Country 2025 & 2033
- Figure 37: Europe Intelligent Lighting Revenue Share (%), by Country 2025 & 2033
- Figure 38: Europe Intelligent Lighting Volume Share (%), by Country 2025 & 2033
- Figure 39: Middle East & Africa Intelligent Lighting Revenue (billion), by Application 2025 & 2033
- Figure 40: Middle East & Africa Intelligent Lighting Volume (K), by Application 2025 & 2033
- Figure 41: Middle East & Africa Intelligent Lighting Revenue Share (%), by Application 2025 & 2033
- Figure 42: Middle East & Africa Intelligent Lighting Volume Share (%), by Application 2025 & 2033
- Figure 43: Middle East & Africa Intelligent Lighting Revenue (billion), by Types 2025 & 2033
- Figure 44: Middle East & Africa Intelligent Lighting Volume (K), by Types 2025 & 2033
- Figure 45: Middle East & Africa Intelligent Lighting Revenue Share (%), by Types 2025 & 2033
- Figure 46: Middle East & Africa Intelligent Lighting Volume Share (%), by Types 2025 & 2033
- Figure 47: Middle East & Africa Intelligent Lighting Revenue (billion), by Country 2025 & 2033
- Figure 48: Middle East & Africa Intelligent Lighting Volume (K), by Country 2025 & 2033
- Figure 49: Middle East & Africa Intelligent Lighting Revenue Share (%), by Country 2025 & 2033
- Figure 50: Middle East & Africa Intelligent Lighting Volume Share (%), by Country 2025 & 2033
- Figure 51: Asia Pacific Intelligent Lighting Revenue (billion), by Application 2025 & 2033
- Figure 52: Asia Pacific Intelligent Lighting Volume (K), by Application 2025 & 2033
- Figure 53: Asia Pacific Intelligent Lighting Revenue Share (%), by Application 2025 & 2033
- Figure 54: Asia Pacific Intelligent Lighting Volume Share (%), by Application 2025 & 2033
- Figure 55: Asia Pacific Intelligent Lighting Revenue (billion), by Types 2025 & 2033
- Figure 56: Asia Pacific Intelligent Lighting Volume (K), by Types 2025 & 2033
- Figure 57: Asia Pacific Intelligent Lighting Revenue Share (%), by Types 2025 & 2033
- Figure 58: Asia Pacific Intelligent Lighting Volume Share (%), by Types 2025 & 2033
- Figure 59: Asia Pacific Intelligent Lighting Revenue (billion), by Country 2025 & 2033
- Figure 60: Asia Pacific Intelligent Lighting Volume (K), by Country 2025 & 2033
- Figure 61: Asia Pacific Intelligent Lighting Revenue Share (%), by Country 2025 & 2033
- Figure 62: Asia Pacific Intelligent Lighting Volume Share (%), by Country 2025 & 2033
List of Tables
- Table 1: Global Intelligent Lighting Revenue billion Forecast, by Application 2020 & 2033
- Table 2: Global Intelligent Lighting Volume K Forecast, by Application 2020 & 2033
- Table 3: Global Intelligent Lighting Revenue billion Forecast, by Types 2020 & 2033
- Table 4: Global Intelligent Lighting Volume K Forecast, by Types 2020 & 2033
- Table 5: Global Intelligent Lighting Revenue billion Forecast, by Region 2020 & 2033
- Table 6: Global Intelligent Lighting Volume K Forecast, by Region 2020 & 2033
- Table 7: Global Intelligent Lighting Revenue billion Forecast, by Application 2020 & 2033
- Table 8: Global Intelligent Lighting Volume K Forecast, by Application 2020 & 2033
- Table 9: Global Intelligent Lighting Revenue billion Forecast, by Types 2020 & 2033
- Table 10: Global Intelligent Lighting Volume K Forecast, by Types 2020 & 2033
- Table 11: Global Intelligent Lighting Revenue billion Forecast, by Country 2020 & 2033
- Table 12: Global Intelligent Lighting Volume K Forecast, by Country 2020 & 2033
- Table 13: United States Intelligent Lighting Revenue (billion) Forecast, by Application 2020 & 2033
- Table 14: United States Intelligent Lighting Volume (K) Forecast, by Application 2020 & 2033
- Table 15: Canada Intelligent Lighting Revenue (billion) Forecast, by Application 2020 & 2033
- Table 16: Canada Intelligent Lighting Volume (K) Forecast, by Application 2020 & 2033
- Table 17: Mexico Intelligent Lighting Revenue (billion) Forecast, by Application 2020 & 2033
- Table 18: Mexico Intelligent Lighting Volume (K) Forecast, by Application 2020 & 2033
- Table 19: Global Intelligent Lighting Revenue billion Forecast, by Application 2020 & 2033
- Table 20: Global Intelligent Lighting Volume K Forecast, by Application 2020 & 2033
- Table 21: Global Intelligent Lighting Revenue billion Forecast, by Types 2020 & 2033
- Table 22: Global Intelligent Lighting Volume K Forecast, by Types 2020 & 2033
- Table 23: Global Intelligent Lighting Revenue billion Forecast, by Country 2020 & 2033
- Table 24: Global Intelligent Lighting Volume K Forecast, by Country 2020 & 2033
- Table 25: Brazil Intelligent Lighting Revenue (billion) Forecast, by Application 2020 & 2033
- Table 26: Brazil Intelligent Lighting Volume (K) Forecast, by Application 2020 & 2033
- Table 27: Argentina Intelligent Lighting Revenue (billion) Forecast, by Application 2020 & 2033
- Table 28: Argentina Intelligent Lighting Volume (K) Forecast, by Application 2020 & 2033
- Table 29: Rest of South America Intelligent Lighting Revenue (billion) Forecast, by Application 2020 & 2033
- Table 30: Rest of South America Intelligent Lighting Volume (K) Forecast, by Application 2020 & 2033
- Table 31: Global Intelligent Lighting Revenue billion Forecast, by Application 2020 & 2033
- Table 32: Global Intelligent Lighting Volume K Forecast, by Application 2020 & 2033
- Table 33: Global Intelligent Lighting Revenue billion Forecast, by Types 2020 & 2033
- Table 34: Global Intelligent Lighting Volume K Forecast, by Types 2020 & 2033
- Table 35: Global Intelligent Lighting Revenue billion Forecast, by Country 2020 & 2033
- Table 36: Global Intelligent Lighting Volume K Forecast, by Country 2020 & 2033
- Table 37: United Kingdom Intelligent Lighting Revenue (billion) Forecast, by Application 2020 & 2033
- Table 38: United Kingdom Intelligent Lighting Volume (K) Forecast, by Application 2020 & 2033
- Table 39: Germany Intelligent Lighting Revenue (billion) Forecast, by Application 2020 & 2033
- Table 40: Germany Intelligent Lighting Volume (K) Forecast, by Application 2020 & 2033
- Table 41: France Intelligent Lighting Revenue (billion) Forecast, by Application 2020 & 2033
- Table 42: France Intelligent Lighting Volume (K) Forecast, by Application 2020 & 2033
- Table 43: Italy Intelligent Lighting Revenue (billion) Forecast, by Application 2020 & 2033
- Table 44: Italy Intelligent Lighting Volume (K) Forecast, by Application 2020 & 2033
- Table 45: Spain Intelligent Lighting Revenue (billion) Forecast, by Application 2020 & 2033
- Table 46: Spain Intelligent Lighting Volume (K) Forecast, by Application 2020 & 2033
- Table 47: Russia Intelligent Lighting Revenue (billion) Forecast, by Application 2020 & 2033
- Table 48: Russia Intelligent Lighting Volume (K) Forecast, by Application 2020 & 2033
- Table 49: Benelux Intelligent Lighting Revenue (billion) Forecast, by Application 2020 & 2033
- Table 50: Benelux Intelligent Lighting Volume (K) Forecast, by Application 2020 & 2033
- Table 51: Nordics Intelligent Lighting Revenue (billion) Forecast, by Application 2020 & 2033
- Table 52: Nordics Intelligent Lighting Volume (K) Forecast, by Application 2020 & 2033
- Table 53: Rest of Europe Intelligent Lighting Revenue (billion) Forecast, by Application 2020 & 2033
- Table 54: Rest of Europe Intelligent Lighting Volume (K) Forecast, by Application 2020 & 2033
- Table 55: Global Intelligent Lighting Revenue billion Forecast, by Application 2020 & 2033
- Table 56: Global Intelligent Lighting Volume K Forecast, by Application 2020 & 2033
- Table 57: Global Intelligent Lighting Revenue billion Forecast, by Types 2020 & 2033
- Table 58: Global Intelligent Lighting Volume K Forecast, by Types 2020 & 2033
- Table 59: Global Intelligent Lighting Revenue billion Forecast, by Country 2020 & 2033
- Table 60: Global Intelligent Lighting Volume K Forecast, by Country 2020 & 2033
- Table 61: Turkey Intelligent Lighting Revenue (billion) Forecast, by Application 2020 & 2033
- Table 62: Turkey Intelligent Lighting Volume (K) Forecast, by Application 2020 & 2033
- Table 63: Israel Intelligent Lighting Revenue (billion) Forecast, by Application 2020 & 2033
- Table 64: Israel Intelligent Lighting Volume (K) Forecast, by Application 2020 & 2033
- Table 65: GCC Intelligent Lighting Revenue (billion) Forecast, by Application 2020 & 2033
- Table 66: GCC Intelligent Lighting Volume (K) Forecast, by Application 2020 & 2033
- Table 67: North Africa Intelligent Lighting Revenue (billion) Forecast, by Application 2020 & 2033
- Table 68: North Africa Intelligent Lighting Volume (K) Forecast, by Application 2020 & 2033
- Table 69: South Africa Intelligent Lighting Revenue (billion) Forecast, by Application 2020 & 2033
- Table 70: South Africa Intelligent Lighting Volume (K) Forecast, by Application 2020 & 2033
- Table 71: Rest of Middle East & Africa Intelligent Lighting Revenue (billion) Forecast, by Application 2020 & 2033
- Table 72: Rest of Middle East & Africa Intelligent Lighting Volume (K) Forecast, by Application 2020 & 2033
- Table 73: Global Intelligent Lighting Revenue billion Forecast, by Application 2020 & 2033
- Table 74: Global Intelligent Lighting Volume K Forecast, by Application 2020 & 2033
- Table 75: Global Intelligent Lighting Revenue billion Forecast, by Types 2020 & 2033
- Table 76: Global Intelligent Lighting Volume K Forecast, by Types 2020 & 2033
- Table 77: Global Intelligent Lighting Revenue billion Forecast, by Country 2020 & 2033
- Table 78: Global Intelligent Lighting Volume K Forecast, by Country 2020 & 2033
- Table 79: China Intelligent Lighting Revenue (billion) Forecast, by Application 2020 & 2033
- Table 80: China Intelligent Lighting Volume (K) Forecast, by Application 2020 & 2033
- Table 81: India Intelligent Lighting Revenue (billion) Forecast, by Application 2020 & 2033
- Table 82: India Intelligent Lighting Volume (K) Forecast, by Application 2020 & 2033
- Table 83: Japan Intelligent Lighting Revenue (billion) Forecast, by Application 2020 & 2033
- Table 84: Japan Intelligent Lighting Volume (K) Forecast, by Application 2020 & 2033
- Table 85: South Korea Intelligent Lighting Revenue (billion) Forecast, by Application 2020 & 2033
- Table 86: South Korea Intelligent Lighting Volume (K) Forecast, by Application 2020 & 2033
- Table 87: ASEAN Intelligent Lighting Revenue (billion) Forecast, by Application 2020 & 2033
- Table 88: ASEAN Intelligent Lighting Volume (K) Forecast, by Application 2020 & 2033
- Table 89: Oceania Intelligent Lighting Revenue (billion) Forecast, by Application 2020 & 2033
- Table 90: Oceania Intelligent Lighting Volume (K) Forecast, by Application 2020 & 2033
- Table 91: Rest of Asia Pacific Intelligent Lighting Revenue (billion) Forecast, by Application 2020 & 2033
- Table 92: Rest of Asia Pacific Intelligent Lighting Volume (K) Forecast, by Application 2020 & 2033
Frequently Asked Questions
1. What is the projected Compound Annual Growth Rate (CAGR) of the Intelligent Lighting?
The projected CAGR is approximately 7.8%.
2. Which companies are prominent players in the Intelligent Lighting?
Key companies in the market include Signify, OSRAM, Acuity Brands, Eaton, Cree lighting, GE Lighting, Legrand SA, Lutron Electronics Company, Zumtobel AG, LIFX, Tvilight, ESYLUX, Jiawei Renewable Energy, Etherba, Nanoleaf, Leedarson IoT Technology.
3. What are the main segments of the Intelligent Lighting?
The market segments include Application, Types.
4. Can you provide details about the market size?
The market size is estimated to be USD 5 billion as of 2022.
5. What are some drivers contributing to market growth?
N/A
6. What are the notable trends driving market growth?
N/A
7. Are there any restraints impacting market growth?
N/A
8. Can you provide examples of recent developments in the market?
N/A
9. What pricing options are available for accessing the report?
Pricing options include single-user, multi-user, and enterprise licenses priced at USD 3950.00, USD 5925.00, and USD 7900.00 respectively.
10. Is the market size provided in terms of value or volume?
The market size is provided in terms of value, measured in billion and volume, measured in K.
11. Are there any specific market keywords associated with the report?
Yes, the market keyword associated with the report is "Intelligent Lighting," which aids in identifying and referencing the specific market segment covered.
12. How do I determine which pricing option suits my needs best?
The pricing options vary based on user requirements and access needs. Individual users may opt for single-user licenses, while businesses requiring broader access may choose multi-user or enterprise licenses for cost-effective access to the report.
13. Are there any additional resources or data provided in the Intelligent Lighting report?
While the report offers comprehensive insights, it's advisable to review the specific contents or supplementary materials provided to ascertain if additional resources or data are available.
14. How can I stay updated on further developments or reports in the Intelligent Lighting?
To stay informed about further developments, trends, and reports in the Intelligent Lighting, consider subscribing to industry newsletters, following relevant companies and organizations, or regularly checking reputable industry news sources and publications.
Methodology
Step 1 - Identification of Relevant Samples Size from Population Database


Step 2 - Approaches for Defining Global Market Size (Value, Volume* & Price*)

Note*: In applicable scenarios
Step 3 - Data Sources
Primary Research
- Web Analytics
- Survey Reports
- Research Institute
- Latest Research Reports
- Opinion Leaders
Secondary Research
- Annual Reports
- White Paper
- Latest Press Release
- Industry Association
- Paid Database
- Investor Presentations

Step 4 - Data Triangulation
Involves using different sources of information in order to increase the validity of a study
These sources are likely to be stakeholders in a program - participants, other researchers, program staff, other community members, and so on.
Then we put all data in single framework & apply various statistical tools to find out the dynamic on the market.
During the analysis stage, feedback from the stakeholder groups would be compared to determine areas of agreement as well as areas of divergence