

Key Insights
The global flocked swab market is poised for significant expansion, projected to reach $7.46 billion in 2025 with a robust Compound Annual Growth Rate (CAGR) of 6.8% from 2019 to 2033. This impressive growth trajectory is underpinned by escalating demand across critical sectors such as hospitals and research institutes, driven by the increasing prevalence of infectious diseases and the subsequent need for accurate and rapid diagnostic testing. The advancement in medical diagnostics, coupled with the growing emphasis on public health initiatives worldwide, fuels the adoption of flocked swabs, renowned for their superior sample collection efficiency and enhanced downstream testing capabilities compared to traditional swabs. Furthermore, the expanding healthcare infrastructure in emerging economies and the continuous innovation in swab designs, including mini and separable types catering to specialized applications, are anticipated to further propel market growth.

Flockeda Swab Market Size (In Billion)
The market's robust expansion is expected to be sustained by several key drivers, including the increasing global burden of infectious diseases and the subsequent surge in diagnostic testing needs. Technological advancements in sample collection and preservation methods, leading to more accurate and reliable test results, further bolster market demand. The expanding healthcare sector, particularly in developing regions, and increased government spending on public health programs are also significant growth enablers. While the market benefits from these positive trends, certain factors could present challenges. High manufacturing costs and stringent regulatory compliances for medical devices may pose restraints. However, the expanding applications in areas like drug delivery and forensic science, alongside ongoing research and development efforts to introduce novel flocked swab technologies, are expected to mitigate these restraints and ensure continued market growth. The competitive landscape features established players like Copan Group, Becton Dickinson, and Bio Merieux, actively engaged in strategic collaborations and product innovations to capture market share.

Flockeda Swab Company Market Share
Flockeda Swab Market: Global Industry Analysis, Trends, and Forecast (2019-2033)
This comprehensive report delves into the burgeoning Flockeda Swab market, providing an in-depth analysis of its dynamics, key trends, leading players, and future trajectory. With a study period spanning from 2019 to 2033, including a base year of 2025 and a forecast period from 2025 to 2033, this report offers invaluable insights for industry stakeholders seeking to understand and capitalize on the growth opportunities within this critical sector. The market is segmented by application into Hospitals, Research Institutes, and Others, and by type into Standard Type, Mini Type, and Separable Type. Key industry developments are also explored, providing a holistic view of the market landscape.
Flockeda Swab Market Dynamics & Concentration
The Flockeda Swab market exhibits a moderate to high concentration, with major players like Copan Group, Sirchie, Becton Dickinson, Bio Merieux, Medico, Puritan Medical Products, Sarstedt, MWE, and Orasure Technologies dominating a significant portion of the global share, estimated to be over 70 billion USD in market share. Innovation drivers, such as advancements in diagnostic technologies and increased demand for rapid and accurate sample collection, are propelling market growth. Regulatory frameworks, particularly those focused on infection control and medical device standards, play a crucial role in shaping market entry and product development. The threat of product substitutes, while present in the form of traditional swabs for certain applications, is largely mitigated by the superior collection efficiency and diagnostic accuracy offered by flocked swabs. End-user trends are shifting towards minimally invasive procedures and a greater emphasis on patient comfort, further bolstering the adoption of flocked swabs. Merger and Acquisition (M&A) activities are moderate, with approximately 5-7 significant deals in the historical period, indicating a consolidation phase driven by strategic expansion and portfolio diversification. The total M&A deal count is projected to reach over 15 billion USD in value by 2025.
Flockeda Swab Industry Trends & Analysis
The Flockeda Swab industry is poised for robust growth, driven by a confluence of technological advancements, escalating healthcare needs, and evolving diagnostic paradigms. The global flocked swab market is projected to witness a Compound Annual Growth Rate (CAGR) of approximately 8.5% from 2025 to 2033, reaching an estimated market size of over 120 billion USD by the end of the forecast period. Key growth drivers include the increasing prevalence of infectious diseases, the rising demand for molecular diagnostics, and the expanding applications in point-of-care testing. Technological disruptions, such as the integration of flocked swabs with automated sample processing systems and the development of novel materials for enhanced sample preservation, are further fueling market penetration. Consumer preferences are increasingly leaning towards user-friendly, high-performance sampling devices that minimize patient discomfort and maximize diagnostic yield. Competitive dynamics are characterized by a blend of innovation, strategic partnerships, and a focus on product differentiation. Companies are investing heavily in research and development to enhance flocked swab designs, improve sample elution efficiency, and expand their product portfolios to cater to diverse application needs. The market penetration of flocked swabs in critical diagnostic applications is expected to exceed 65% by 2028, underscoring their widespread adoption. The overall market value is anticipated to be over 90 billion USD by the base year 2025.
Leading Markets & Segments in Flockeda Swab
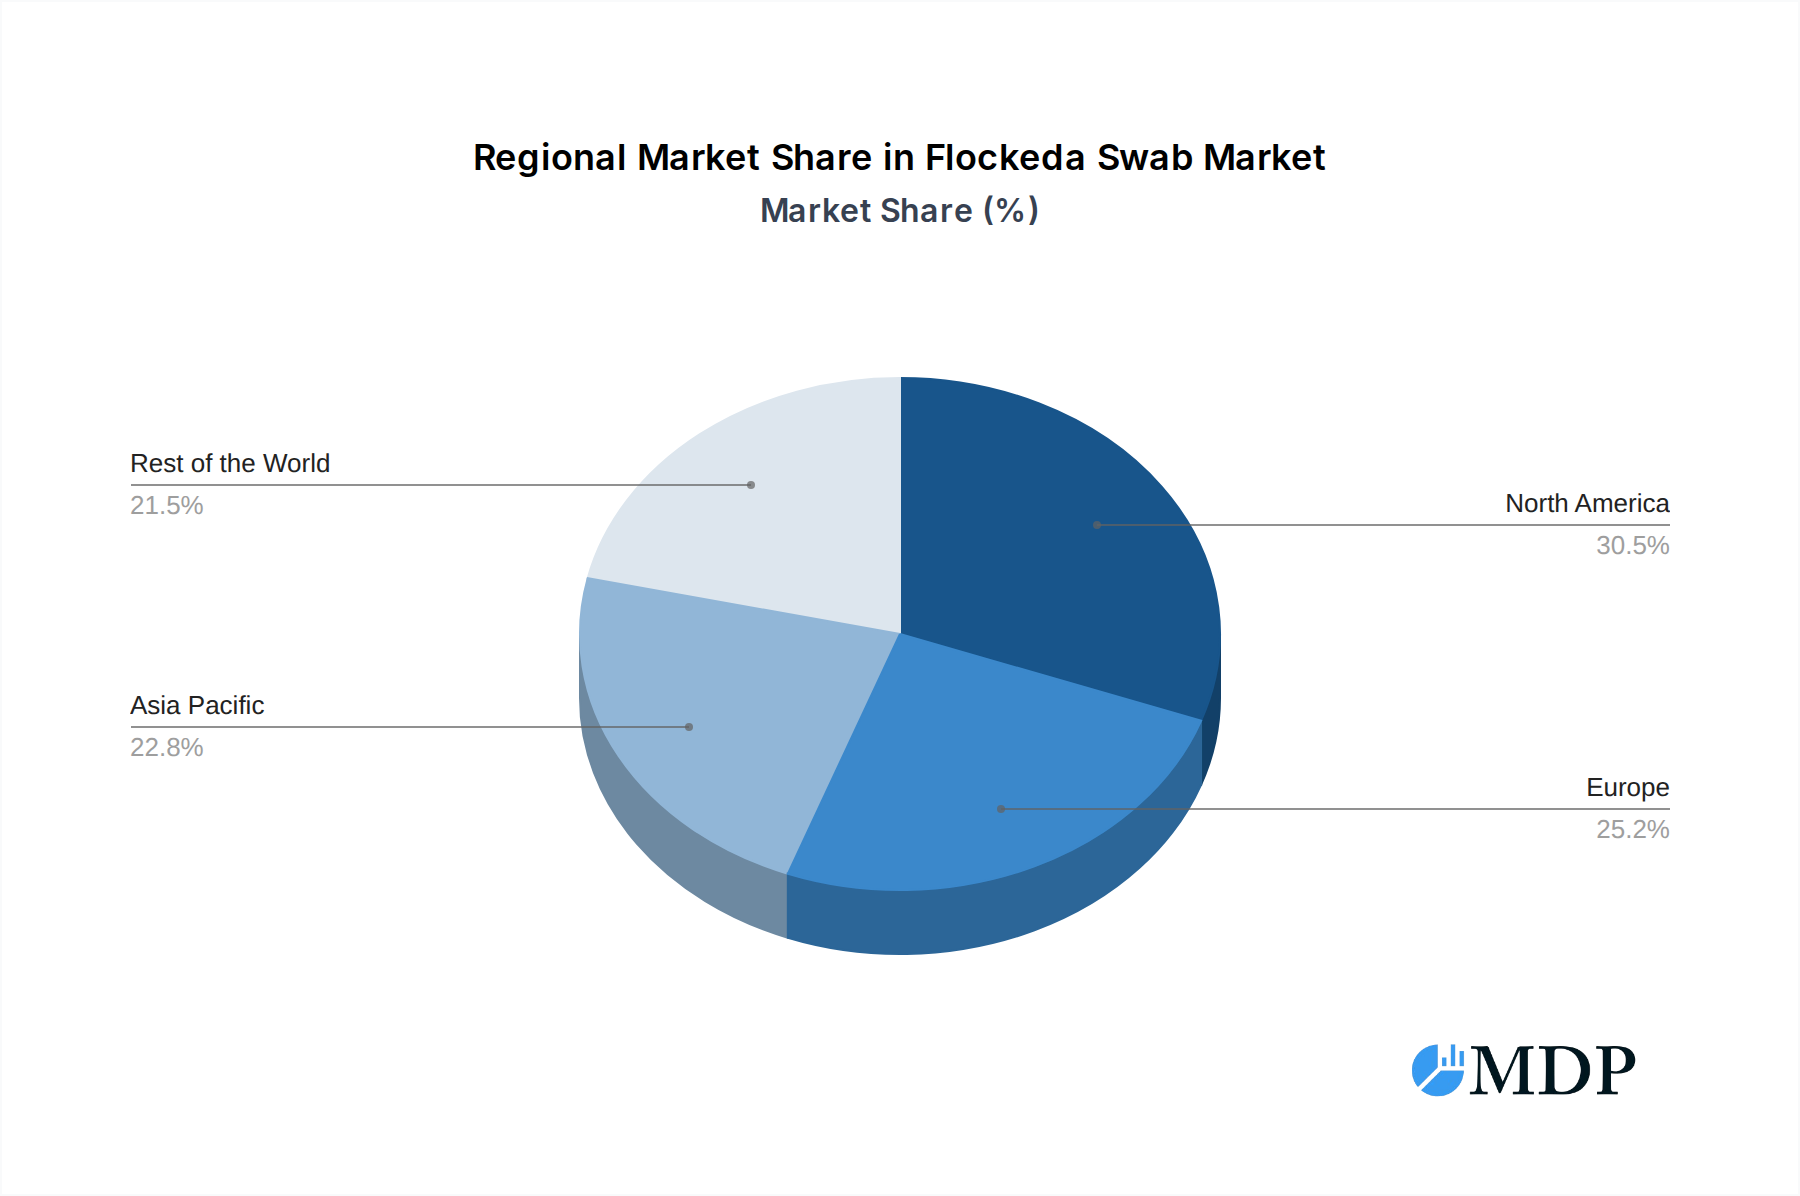
North America currently dominates the global Flockeda Swab market, driven by a well-established healthcare infrastructure, high healthcare expenditure, and a strong emphasis on advanced diagnostics. The United States, in particular, accounts for a significant portion of this regional dominance, owing to the presence of leading research institutions and hospitals, coupled with supportive government initiatives for public health.
Dominant Application Segment: Hospitals
- Key Drivers: The increasing incidence of hospital-acquired infections (HAIs), the growing volume of diagnostic testing within hospital settings, and the adoption of stringent infection control protocols are primary drivers for flocked swab demand in hospitals. The need for reliable sample collection for rapid diagnostics and molecular testing in emergency departments and intensive care units further propels this segment. Economic policies that prioritize healthcare spending and infrastructure development also contribute significantly.
- Detailed Dominance Analysis: Hospitals represent the largest application segment for flocked swabs due to their critical role in patient care and disease diagnosis. Flocked swabs are indispensable for collecting specimens for a wide range of tests, including respiratory panels, sexually transmitted infections (STIs), and bloodstream infections. The increasing focus on early disease detection and personalized medicine within hospital environments further solidifies the dominance of this segment. The sheer volume of patient throughput in hospitals ensures a consistent and substantial demand for flocked swabs.
Dominant Type Segment: Standard Type
- Key Drivers: The standard type flocked swab, characterized by its versatility and cost-effectiveness for general-purpose sample collection, continues to be the most widely adopted type. Its broad applicability across various clinical and research settings makes it a preferred choice.
- Detailed Dominance Analysis: The Standard Type flocked swab's widespread adoption stems from its proven efficacy in collecting a broad spectrum of biological samples, including nasopharyngeal, oropharyngeal, and wound specimens. Its compatibility with numerous downstream diagnostic assays, such as PCR, antigen tests, and viral cultures, makes it a go-to option for laboratories and healthcare providers. The accessibility and affordability of standard flocked swabs contribute to their high market penetration.
Emerging Markets & Segments: Asia Pacific, particularly China and India, presents significant growth potential due to the expanding healthcare sector, increasing disposable incomes, and rising awareness about diagnostic testing. Research Institutes are also witnessing substantial growth as molecular diagnostics and genomic research continue to expand globally.
Flockeda Swab Product Developments
Product developments in the Flockeda Swab market are characterized by a focus on enhanced sample collection efficiency, improved elusion rates, and user comfort. Innovations include the development of novel shaft materials for increased breakability and ergonomic designs for easier handling. Advancements in flocked tip technology, such as varying fiber densities and lengths, are tailored for specific applications like viral RNA stabilization and improved bacterial culture yields. Competitive advantages are being gained through the development of sterile, individually packaged flocked swabs for enhanced infection control and the creation of specialized flocked swabs for niche diagnostic assays, ensuring superior market fit and driving adoption. The estimated market value of innovative products is over 20 billion USD.
Key Drivers of Flockeda Swab Growth
The Flockeda Swab market is propelled by several key drivers. Technologically, the surge in molecular diagnostics and the increasing demand for rapid, accurate testing for infectious diseases are paramount. Economically, growing healthcare expenditure globally, particularly in emerging economies, fuels the adoption of advanced diagnostic tools. Regulatory factors, such as the emphasis on stringent infection control protocols and the increasing approval of diagnostic kits that utilize flocked swabs, also play a significant role. For instance, the widespread use of flocked swabs in COVID-19 testing significantly accelerated market growth. The projected market value for these drivers is over 10 billion USD.
Challenges in the Flockeda Swab Market
Despite its robust growth, the Flockeda Swab market faces certain challenges. Regulatory hurdles and evolving standards for medical devices can impact product development timelines and market entry strategies. Supply chain disruptions, as witnessed in recent global events, can affect the availability and cost of raw materials, impacting production. Intense competitive pressures from both established players and new entrants can lead to price erosion. Furthermore, the cost of specialized flocked swabs compared to traditional alternatives can be a restraint in price-sensitive markets, with an estimated quantifiable impact of over 5 billion USD on market potential.
Emerging Opportunities in Flockeda Swab
Catalysts for long-term growth in the Flockeda Swab market are numerous. Technological breakthroughs in sample stabilization and nucleic acid amplification technologies present significant opportunities for specialized flocked swabs. Strategic partnerships between flocked swab manufacturers and diagnostic assay developers can unlock new markets and applications. Market expansion into underdeveloped regions with growing healthcare needs, coupled with increased government investment in public health infrastructure, offers substantial untapped potential. The development of biodegradable flocked swabs also presents an environmentally conscious opportunity. The projected value of these opportunities is over 25 billion USD.
Leading Players in the Flockeda Swab Sector
- Copan Group
- Sirchie
- Becton Dickinson
- Bio Merieux
- Medico
- Puritan Medical Products
- Sarstedt
- MWE
- Orasure Technologies
Key Milestones in Flockeda Swab Industry
- 2019: Introduction of novel sterile flocked swab packaging for enhanced infection control.
- 2020: Significant surge in demand and production of flocked swabs for COVID-19 testing globally.
- 2021: Development of flocked swabs with improved nucleic acid preservation capabilities for molecular diagnostics.
- 2022: Strategic acquisitions by major players to expand product portfolios and market reach.
- 2023: Launch of flocked swabs with ergonomic designs for improved patient comfort and clinician usability.
- 2024: Advancements in flocked swab technology for point-of-care diagnostics and rapid test integration.
Strategic Outlook for Flockeda Swab Market
The strategic outlook for the Flockeda Swab market is exceptionally positive, driven by continued advancements in diagnostic technologies and an ever-growing global demand for reliable sample collection. Growth accelerators include the expansion of molecular diagnostics into routine clinical practice, the increasing adoption of flocked swabs in emerging markets, and the development of specialized flocked swabs for personalized medicine and companion diagnostics. Companies are expected to focus on innovation, strategic collaborations, and expanding their manufacturing capabilities to meet future demand. The market is poised for sustained growth, with an estimated potential of over 30 billion USD in the coming years.
Flockeda Swab Segmentation
-
1. Application
- 1.1. Hospitals
- 1.2. Research Institute
- 1.3. Others
-
2. Types
- 2.1. Standard Type
- 2.2. Mini Type
- 2.3. Separable Type
- 2.4. Others
Flockeda Swab Segmentation By Geography
-
1. North America
- 1.1. United States
- 1.2. Canada
- 1.3. Mexico
-
2. South America
- 2.1. Brazil
- 2.2. Argentina
- 2.3. Rest of South America
-
3. Europe
- 3.1. United Kingdom
- 3.2. Germany
- 3.3. France
- 3.4. Italy
- 3.5. Spain
- 3.6. Russia
- 3.7. Benelux
- 3.8. Nordics
- 3.9. Rest of Europe
-
4. Middle East & Africa
- 4.1. Turkey
- 4.2. Israel
- 4.3. GCC
- 4.4. North Africa
- 4.5. South Africa
- 4.6. Rest of Middle East & Africa
-
5. Asia Pacific
- 5.1. China
- 5.2. India
- 5.3. Japan
- 5.4. South Korea
- 5.5. ASEAN
- 5.6. Oceania
- 5.7. Rest of Asia Pacific
Flockeda Swab Regional Market Share
Geographic Coverage of Flockeda Swab
Flockeda Swab REPORT HIGHLIGHTS
| Aspects | Details |
|---|---|
| Study Period | 2020-2034 |
| Base Year | 2025 |
| Estimated Year | 2026 |
| Forecast Period | 2026-2034 |
| Historical Period | 2020-2025 |
| Growth Rate | CAGR of 6.8% from 2020-2034 |
| Segmentation |
|
Table of Contents
- 1. Introduction
- 1.1. Research Scope
- 1.2. Market Segmentation
- 1.3. Research Methodology
- 1.4. Definitions and Assumptions
- 2. Executive Summary
- 2.1. Introduction
- 3. Market Dynamics
- 3.1. Introduction
- 3.2. Market Drivers
- 3.3. Market Restrains
- 3.4. Market Trends
- 4. Market Factor Analysis
- 4.1. Porters Five Forces
- 4.2. Supply/Value Chain
- 4.3. PESTEL analysis
- 4.4. Market Entropy
- 4.5. Patent/Trademark Analysis
- 5. Global Flockeda Swab Analysis, Insights and Forecast, 2020-2032
- 5.1. Market Analysis, Insights and Forecast - by Application
- 5.1.1. Hospitals
- 5.1.2. Research Institute
- 5.1.3. Others
- 5.2. Market Analysis, Insights and Forecast - by Types
- 5.2.1. Standard Type
- 5.2.2. Mini Type
- 5.2.3. Separable Type
- 5.2.4. Others
- 5.3. Market Analysis, Insights and Forecast - by Region
- 5.3.1. North America
- 5.3.2. South America
- 5.3.3. Europe
- 5.3.4. Middle East & Africa
- 5.3.5. Asia Pacific
- 5.1. Market Analysis, Insights and Forecast - by Application
- 6. North America Flockeda Swab Analysis, Insights and Forecast, 2020-2032
- 6.1. Market Analysis, Insights and Forecast - by Application
- 6.1.1. Hospitals
- 6.1.2. Research Institute
- 6.1.3. Others
- 6.2. Market Analysis, Insights and Forecast - by Types
- 6.2.1. Standard Type
- 6.2.2. Mini Type
- 6.2.3. Separable Type
- 6.2.4. Others
- 6.1. Market Analysis, Insights and Forecast - by Application
- 7. South America Flockeda Swab Analysis, Insights and Forecast, 2020-2032
- 7.1. Market Analysis, Insights and Forecast - by Application
- 7.1.1. Hospitals
- 7.1.2. Research Institute
- 7.1.3. Others
- 7.2. Market Analysis, Insights and Forecast - by Types
- 7.2.1. Standard Type
- 7.2.2. Mini Type
- 7.2.3. Separable Type
- 7.2.4. Others
- 7.1. Market Analysis, Insights and Forecast - by Application
- 8. Europe Flockeda Swab Analysis, Insights and Forecast, 2020-2032
- 8.1. Market Analysis, Insights and Forecast - by Application
- 8.1.1. Hospitals
- 8.1.2. Research Institute
- 8.1.3. Others
- 8.2. Market Analysis, Insights and Forecast - by Types
- 8.2.1. Standard Type
- 8.2.2. Mini Type
- 8.2.3. Separable Type
- 8.2.4. Others
- 8.1. Market Analysis, Insights and Forecast - by Application
- 9. Middle East & Africa Flockeda Swab Analysis, Insights and Forecast, 2020-2032
- 9.1. Market Analysis, Insights and Forecast - by Application
- 9.1.1. Hospitals
- 9.1.2. Research Institute
- 9.1.3. Others
- 9.2. Market Analysis, Insights and Forecast - by Types
- 9.2.1. Standard Type
- 9.2.2. Mini Type
- 9.2.3. Separable Type
- 9.2.4. Others
- 9.1. Market Analysis, Insights and Forecast - by Application
- 10. Asia Pacific Flockeda Swab Analysis, Insights and Forecast, 2020-2032
- 10.1. Market Analysis, Insights and Forecast - by Application
- 10.1.1. Hospitals
- 10.1.2. Research Institute
- 10.1.3. Others
- 10.2. Market Analysis, Insights and Forecast - by Types
- 10.2.1. Standard Type
- 10.2.2. Mini Type
- 10.2.3. Separable Type
- 10.2.4. Others
- 10.1. Market Analysis, Insights and Forecast - by Application
- 11. Competitive Analysis
- 11.1. Global Market Share Analysis 2025
- 11.2. Company Profiles
- 11.2.1 Copan Group
- 11.2.1.1. Overview
- 11.2.1.2. Products
- 11.2.1.3. SWOT Analysis
- 11.2.1.4. Recent Developments
- 11.2.1.5. Financials (Based on Availability)
- 11.2.2 Sirchie
- 11.2.2.1. Overview
- 11.2.2.2. Products
- 11.2.2.3. SWOT Analysis
- 11.2.2.4. Recent Developments
- 11.2.2.5. Financials (Based on Availability)
- 11.2.3 Becton Dickinson
- 11.2.3.1. Overview
- 11.2.3.2. Products
- 11.2.3.3. SWOT Analysis
- 11.2.3.4. Recent Developments
- 11.2.3.5. Financials (Based on Availability)
- 11.2.4 Bio Merieux
- 11.2.4.1. Overview
- 11.2.4.2. Products
- 11.2.4.3. SWOT Analysis
- 11.2.4.4. Recent Developments
- 11.2.4.5. Financials (Based on Availability)
- 11.2.5 Medico
- 11.2.5.1. Overview
- 11.2.5.2. Products
- 11.2.5.3. SWOT Analysis
- 11.2.5.4. Recent Developments
- 11.2.5.5. Financials (Based on Availability)
- 11.2.6 Puritan Medical Products
- 11.2.6.1. Overview
- 11.2.6.2. Products
- 11.2.6.3. SWOT Analysis
- 11.2.6.4. Recent Developments
- 11.2.6.5. Financials (Based on Availability)
- 11.2.7 Sarstedt
- 11.2.7.1. Overview
- 11.2.7.2. Products
- 11.2.7.3. SWOT Analysis
- 11.2.7.4. Recent Developments
- 11.2.7.5. Financials (Based on Availability)
- 11.2.8 MWE
- 11.2.8.1. Overview
- 11.2.8.2. Products
- 11.2.8.3. SWOT Analysis
- 11.2.8.4. Recent Developments
- 11.2.8.5. Financials (Based on Availability)
- 11.2.9 Orasure Technologies
- 11.2.9.1. Overview
- 11.2.9.2. Products
- 11.2.9.3. SWOT Analysis
- 11.2.9.4. Recent Developments
- 11.2.9.5. Financials (Based on Availability)
- 11.2.1 Copan Group
List of Figures
- Figure 1: Global Flockeda Swab Revenue Breakdown (billion, %) by Region 2025 & 2033
- Figure 2: Global Flockeda Swab Volume Breakdown (K, %) by Region 2025 & 2033
- Figure 3: North America Flockeda Swab Revenue (billion), by Application 2025 & 2033
- Figure 4: North America Flockeda Swab Volume (K), by Application 2025 & 2033
- Figure 5: North America Flockeda Swab Revenue Share (%), by Application 2025 & 2033
- Figure 6: North America Flockeda Swab Volume Share (%), by Application 2025 & 2033
- Figure 7: North America Flockeda Swab Revenue (billion), by Types 2025 & 2033
- Figure 8: North America Flockeda Swab Volume (K), by Types 2025 & 2033
- Figure 9: North America Flockeda Swab Revenue Share (%), by Types 2025 & 2033
- Figure 10: North America Flockeda Swab Volume Share (%), by Types 2025 & 2033
- Figure 11: North America Flockeda Swab Revenue (billion), by Country 2025 & 2033
- Figure 12: North America Flockeda Swab Volume (K), by Country 2025 & 2033
- Figure 13: North America Flockeda Swab Revenue Share (%), by Country 2025 & 2033
- Figure 14: North America Flockeda Swab Volume Share (%), by Country 2025 & 2033
- Figure 15: South America Flockeda Swab Revenue (billion), by Application 2025 & 2033
- Figure 16: South America Flockeda Swab Volume (K), by Application 2025 & 2033
- Figure 17: South America Flockeda Swab Revenue Share (%), by Application 2025 & 2033
- Figure 18: South America Flockeda Swab Volume Share (%), by Application 2025 & 2033
- Figure 19: South America Flockeda Swab Revenue (billion), by Types 2025 & 2033
- Figure 20: South America Flockeda Swab Volume (K), by Types 2025 & 2033
- Figure 21: South America Flockeda Swab Revenue Share (%), by Types 2025 & 2033
- Figure 22: South America Flockeda Swab Volume Share (%), by Types 2025 & 2033
- Figure 23: South America Flockeda Swab Revenue (billion), by Country 2025 & 2033
- Figure 24: South America Flockeda Swab Volume (K), by Country 2025 & 2033
- Figure 25: South America Flockeda Swab Revenue Share (%), by Country 2025 & 2033
- Figure 26: South America Flockeda Swab Volume Share (%), by Country 2025 & 2033
- Figure 27: Europe Flockeda Swab Revenue (billion), by Application 2025 & 2033
- Figure 28: Europe Flockeda Swab Volume (K), by Application 2025 & 2033
- Figure 29: Europe Flockeda Swab Revenue Share (%), by Application 2025 & 2033
- Figure 30: Europe Flockeda Swab Volume Share (%), by Application 2025 & 2033
- Figure 31: Europe Flockeda Swab Revenue (billion), by Types 2025 & 2033
- Figure 32: Europe Flockeda Swab Volume (K), by Types 2025 & 2033
- Figure 33: Europe Flockeda Swab Revenue Share (%), by Types 2025 & 2033
- Figure 34: Europe Flockeda Swab Volume Share (%), by Types 2025 & 2033
- Figure 35: Europe Flockeda Swab Revenue (billion), by Country 2025 & 2033
- Figure 36: Europe Flockeda Swab Volume (K), by Country 2025 & 2033
- Figure 37: Europe Flockeda Swab Revenue Share (%), by Country 2025 & 2033
- Figure 38: Europe Flockeda Swab Volume Share (%), by Country 2025 & 2033
- Figure 39: Middle East & Africa Flockeda Swab Revenue (billion), by Application 2025 & 2033
- Figure 40: Middle East & Africa Flockeda Swab Volume (K), by Application 2025 & 2033
- Figure 41: Middle East & Africa Flockeda Swab Revenue Share (%), by Application 2025 & 2033
- Figure 42: Middle East & Africa Flockeda Swab Volume Share (%), by Application 2025 & 2033
- Figure 43: Middle East & Africa Flockeda Swab Revenue (billion), by Types 2025 & 2033
- Figure 44: Middle East & Africa Flockeda Swab Volume (K), by Types 2025 & 2033
- Figure 45: Middle East & Africa Flockeda Swab Revenue Share (%), by Types 2025 & 2033
- Figure 46: Middle East & Africa Flockeda Swab Volume Share (%), by Types 2025 & 2033
- Figure 47: Middle East & Africa Flockeda Swab Revenue (billion), by Country 2025 & 2033
- Figure 48: Middle East & Africa Flockeda Swab Volume (K), by Country 2025 & 2033
- Figure 49: Middle East & Africa Flockeda Swab Revenue Share (%), by Country 2025 & 2033
- Figure 50: Middle East & Africa Flockeda Swab Volume Share (%), by Country 2025 & 2033
- Figure 51: Asia Pacific Flockeda Swab Revenue (billion), by Application 2025 & 2033
- Figure 52: Asia Pacific Flockeda Swab Volume (K), by Application 2025 & 2033
- Figure 53: Asia Pacific Flockeda Swab Revenue Share (%), by Application 2025 & 2033
- Figure 54: Asia Pacific Flockeda Swab Volume Share (%), by Application 2025 & 2033
- Figure 55: Asia Pacific Flockeda Swab Revenue (billion), by Types 2025 & 2033
- Figure 56: Asia Pacific Flockeda Swab Volume (K), by Types 2025 & 2033
- Figure 57: Asia Pacific Flockeda Swab Revenue Share (%), by Types 2025 & 2033
- Figure 58: Asia Pacific Flockeda Swab Volume Share (%), by Types 2025 & 2033
- Figure 59: Asia Pacific Flockeda Swab Revenue (billion), by Country 2025 & 2033
- Figure 60: Asia Pacific Flockeda Swab Volume (K), by Country 2025 & 2033
- Figure 61: Asia Pacific Flockeda Swab Revenue Share (%), by Country 2025 & 2033
- Figure 62: Asia Pacific Flockeda Swab Volume Share (%), by Country 2025 & 2033
List of Tables
- Table 1: Global Flockeda Swab Revenue billion Forecast, by Application 2020 & 2033
- Table 2: Global Flockeda Swab Volume K Forecast, by Application 2020 & 2033
- Table 3: Global Flockeda Swab Revenue billion Forecast, by Types 2020 & 2033
- Table 4: Global Flockeda Swab Volume K Forecast, by Types 2020 & 2033
- Table 5: Global Flockeda Swab Revenue billion Forecast, by Region 2020 & 2033
- Table 6: Global Flockeda Swab Volume K Forecast, by Region 2020 & 2033
- Table 7: Global Flockeda Swab Revenue billion Forecast, by Application 2020 & 2033
- Table 8: Global Flockeda Swab Volume K Forecast, by Application 2020 & 2033
- Table 9: Global Flockeda Swab Revenue billion Forecast, by Types 2020 & 2033
- Table 10: Global Flockeda Swab Volume K Forecast, by Types 2020 & 2033
- Table 11: Global Flockeda Swab Revenue billion Forecast, by Country 2020 & 2033
- Table 12: Global Flockeda Swab Volume K Forecast, by Country 2020 & 2033
- Table 13: United States Flockeda Swab Revenue (billion) Forecast, by Application 2020 & 2033
- Table 14: United States Flockeda Swab Volume (K) Forecast, by Application 2020 & 2033
- Table 15: Canada Flockeda Swab Revenue (billion) Forecast, by Application 2020 & 2033
- Table 16: Canada Flockeda Swab Volume (K) Forecast, by Application 2020 & 2033
- Table 17: Mexico Flockeda Swab Revenue (billion) Forecast, by Application 2020 & 2033
- Table 18: Mexico Flockeda Swab Volume (K) Forecast, by Application 2020 & 2033
- Table 19: Global Flockeda Swab Revenue billion Forecast, by Application 2020 & 2033
- Table 20: Global Flockeda Swab Volume K Forecast, by Application 2020 & 2033
- Table 21: Global Flockeda Swab Revenue billion Forecast, by Types 2020 & 2033
- Table 22: Global Flockeda Swab Volume K Forecast, by Types 2020 & 2033
- Table 23: Global Flockeda Swab Revenue billion Forecast, by Country 2020 & 2033
- Table 24: Global Flockeda Swab Volume K Forecast, by Country 2020 & 2033
- Table 25: Brazil Flockeda Swab Revenue (billion) Forecast, by Application 2020 & 2033
- Table 26: Brazil Flockeda Swab Volume (K) Forecast, by Application 2020 & 2033
- Table 27: Argentina Flockeda Swab Revenue (billion) Forecast, by Application 2020 & 2033
- Table 28: Argentina Flockeda Swab Volume (K) Forecast, by Application 2020 & 2033
- Table 29: Rest of South America Flockeda Swab Revenue (billion) Forecast, by Application 2020 & 2033
- Table 30: Rest of South America Flockeda Swab Volume (K) Forecast, by Application 2020 & 2033
- Table 31: Global Flockeda Swab Revenue billion Forecast, by Application 2020 & 2033
- Table 32: Global Flockeda Swab Volume K Forecast, by Application 2020 & 2033
- Table 33: Global Flockeda Swab Revenue billion Forecast, by Types 2020 & 2033
- Table 34: Global Flockeda Swab Volume K Forecast, by Types 2020 & 2033
- Table 35: Global Flockeda Swab Revenue billion Forecast, by Country 2020 & 2033
- Table 36: Global Flockeda Swab Volume K Forecast, by Country 2020 & 2033
- Table 37: United Kingdom Flockeda Swab Revenue (billion) Forecast, by Application 2020 & 2033
- Table 38: United Kingdom Flockeda Swab Volume (K) Forecast, by Application 2020 & 2033
- Table 39: Germany Flockeda Swab Revenue (billion) Forecast, by Application 2020 & 2033
- Table 40: Germany Flockeda Swab Volume (K) Forecast, by Application 2020 & 2033
- Table 41: France Flockeda Swab Revenue (billion) Forecast, by Application 2020 & 2033
- Table 42: France Flockeda Swab Volume (K) Forecast, by Application 2020 & 2033
- Table 43: Italy Flockeda Swab Revenue (billion) Forecast, by Application 2020 & 2033
- Table 44: Italy Flockeda Swab Volume (K) Forecast, by Application 2020 & 2033
- Table 45: Spain Flockeda Swab Revenue (billion) Forecast, by Application 2020 & 2033
- Table 46: Spain Flockeda Swab Volume (K) Forecast, by Application 2020 & 2033
- Table 47: Russia Flockeda Swab Revenue (billion) Forecast, by Application 2020 & 2033
- Table 48: Russia Flockeda Swab Volume (K) Forecast, by Application 2020 & 2033
- Table 49: Benelux Flockeda Swab Revenue (billion) Forecast, by Application 2020 & 2033
- Table 50: Benelux Flockeda Swab Volume (K) Forecast, by Application 2020 & 2033
- Table 51: Nordics Flockeda Swab Revenue (billion) Forecast, by Application 2020 & 2033
- Table 52: Nordics Flockeda Swab Volume (K) Forecast, by Application 2020 & 2033
- Table 53: Rest of Europe Flockeda Swab Revenue (billion) Forecast, by Application 2020 & 2033
- Table 54: Rest of Europe Flockeda Swab Volume (K) Forecast, by Application 2020 & 2033
- Table 55: Global Flockeda Swab Revenue billion Forecast, by Application 2020 & 2033
- Table 56: Global Flockeda Swab Volume K Forecast, by Application 2020 & 2033
- Table 57: Global Flockeda Swab Revenue billion Forecast, by Types 2020 & 2033
- Table 58: Global Flockeda Swab Volume K Forecast, by Types 2020 & 2033
- Table 59: Global Flockeda Swab Revenue billion Forecast, by Country 2020 & 2033
- Table 60: Global Flockeda Swab Volume K Forecast, by Country 2020 & 2033
- Table 61: Turkey Flockeda Swab Revenue (billion) Forecast, by Application 2020 & 2033
- Table 62: Turkey Flockeda Swab Volume (K) Forecast, by Application 2020 & 2033
- Table 63: Israel Flockeda Swab Revenue (billion) Forecast, by Application 2020 & 2033
- Table 64: Israel Flockeda Swab Volume (K) Forecast, by Application 2020 & 2033
- Table 65: GCC Flockeda Swab Revenue (billion) Forecast, by Application 2020 & 2033
- Table 66: GCC Flockeda Swab Volume (K) Forecast, by Application 2020 & 2033
- Table 67: North Africa Flockeda Swab Revenue (billion) Forecast, by Application 2020 & 2033
- Table 68: North Africa Flockeda Swab Volume (K) Forecast, by Application 2020 & 2033
- Table 69: South Africa Flockeda Swab Revenue (billion) Forecast, by Application 2020 & 2033
- Table 70: South Africa Flockeda Swab Volume (K) Forecast, by Application 2020 & 2033
- Table 71: Rest of Middle East & Africa Flockeda Swab Revenue (billion) Forecast, by Application 2020 & 2033
- Table 72: Rest of Middle East & Africa Flockeda Swab Volume (K) Forecast, by Application 2020 & 2033
- Table 73: Global Flockeda Swab Revenue billion Forecast, by Application 2020 & 2033
- Table 74: Global Flockeda Swab Volume K Forecast, by Application 2020 & 2033
- Table 75: Global Flockeda Swab Revenue billion Forecast, by Types 2020 & 2033
- Table 76: Global Flockeda Swab Volume K Forecast, by Types 2020 & 2033
- Table 77: Global Flockeda Swab Revenue billion Forecast, by Country 2020 & 2033
- Table 78: Global Flockeda Swab Volume K Forecast, by Country 2020 & 2033
- Table 79: China Flockeda Swab Revenue (billion) Forecast, by Application 2020 & 2033
- Table 80: China Flockeda Swab Volume (K) Forecast, by Application 2020 & 2033
- Table 81: India Flockeda Swab Revenue (billion) Forecast, by Application 2020 & 2033
- Table 82: India Flockeda Swab Volume (K) Forecast, by Application 2020 & 2033
- Table 83: Japan Flockeda Swab Revenue (billion) Forecast, by Application 2020 & 2033
- Table 84: Japan Flockeda Swab Volume (K) Forecast, by Application 2020 & 2033
- Table 85: South Korea Flockeda Swab Revenue (billion) Forecast, by Application 2020 & 2033
- Table 86: South Korea Flockeda Swab Volume (K) Forecast, by Application 2020 & 2033
- Table 87: ASEAN Flockeda Swab Revenue (billion) Forecast, by Application 2020 & 2033
- Table 88: ASEAN Flockeda Swab Volume (K) Forecast, by Application 2020 & 2033
- Table 89: Oceania Flockeda Swab Revenue (billion) Forecast, by Application 2020 & 2033
- Table 90: Oceania Flockeda Swab Volume (K) Forecast, by Application 2020 & 2033
- Table 91: Rest of Asia Pacific Flockeda Swab Revenue (billion) Forecast, by Application 2020 & 2033
- Table 92: Rest of Asia Pacific Flockeda Swab Volume (K) Forecast, by Application 2020 & 2033
Frequently Asked Questions
1. What is the projected Compound Annual Growth Rate (CAGR) of the Flockeda Swab?
The projected CAGR is approximately 6.8%.
2. Which companies are prominent players in the Flockeda Swab?
Key companies in the market include Copan Group, Sirchie, Becton Dickinson, Bio Merieux, Medico, Puritan Medical Products, Sarstedt, MWE, Orasure Technologies.
3. What are the main segments of the Flockeda Swab?
The market segments include Application, Types.
4. Can you provide details about the market size?
The market size is estimated to be USD 7.46 billion as of 2022.
5. What are some drivers contributing to market growth?
N/A
6. What are the notable trends driving market growth?
N/A
7. Are there any restraints impacting market growth?
N/A
8. Can you provide examples of recent developments in the market?
N/A
9. What pricing options are available for accessing the report?
Pricing options include single-user, multi-user, and enterprise licenses priced at USD 3950.00, USD 5925.00, and USD 7900.00 respectively.
10. Is the market size provided in terms of value or volume?
The market size is provided in terms of value, measured in billion and volume, measured in K.
11. Are there any specific market keywords associated with the report?
Yes, the market keyword associated with the report is "Flockeda Swab," which aids in identifying and referencing the specific market segment covered.
12. How do I determine which pricing option suits my needs best?
The pricing options vary based on user requirements and access needs. Individual users may opt for single-user licenses, while businesses requiring broader access may choose multi-user or enterprise licenses for cost-effective access to the report.
13. Are there any additional resources or data provided in the Flockeda Swab report?
While the report offers comprehensive insights, it's advisable to review the specific contents or supplementary materials provided to ascertain if additional resources or data are available.
14. How can I stay updated on further developments or reports in the Flockeda Swab?
To stay informed about further developments, trends, and reports in the Flockeda Swab, consider subscribing to industry newsletters, following relevant companies and organizations, or regularly checking reputable industry news sources and publications.
Methodology
Step 1 - Identification of Relevant Samples Size from Population Database


Step 2 - Approaches for Defining Global Market Size (Value, Volume* & Price*)

Note*: In applicable scenarios
Step 3 - Data Sources
Primary Research
- Web Analytics
- Survey Reports
- Research Institute
- Latest Research Reports
- Opinion Leaders
Secondary Research
- Annual Reports
- White Paper
- Latest Press Release
- Industry Association
- Paid Database
- Investor Presentations

Step 4 - Data Triangulation
Involves using different sources of information in order to increase the validity of a study
These sources are likely to be stakeholders in a program - participants, other researchers, program staff, other community members, and so on.
Then we put all data in single framework & apply various statistical tools to find out the dynamic on the market.
During the analysis stage, feedback from the stakeholder groups would be compared to determine areas of agreement as well as areas of divergence