

Key Insights
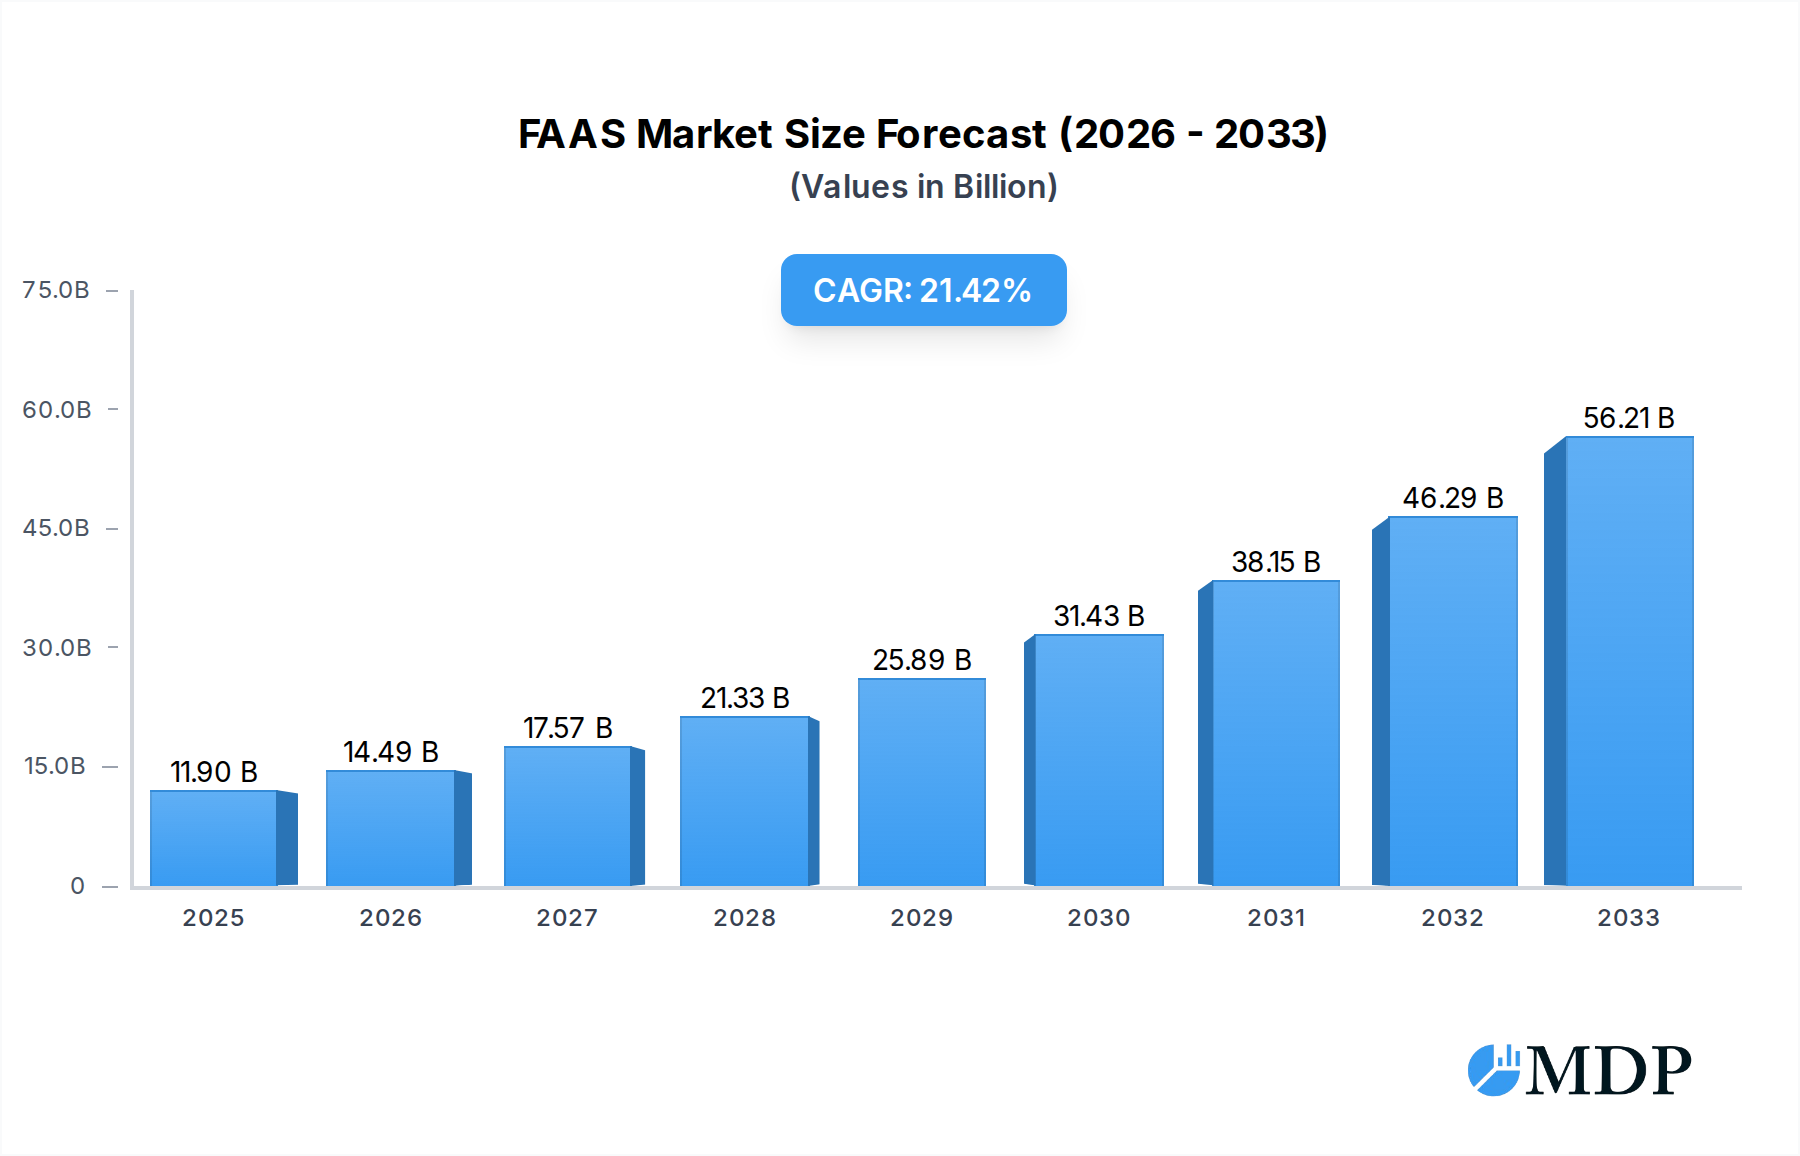
The Function-as-a-Service (FaaS) market is poised for explosive growth, projected to reach USD 11.9 billion in 2025, exhibiting a remarkable CAGR of 21.3% throughout the forecast period of 2025-2033. This rapid expansion is primarily fueled by the increasing adoption of serverless architectures across diverse industries seeking enhanced scalability, reduced operational costs, and faster development cycles. Key drivers include the growing demand for agile development methodologies, the proliferation of microservices, and the need for efficient handling of event-driven workloads. Industries such as Telecommunication, Banking and Finance, Healthcare, and Media and Entertainment are at the forefront of this adoption, leveraging FaaS for innovative solutions and streamlined operations. The Developer-Centric segment is expected to dominate, empowering developers with greater control and flexibility in building and deploying applications, while the Operator-Centric segment caters to organizations prioritizing ease of management and infrastructure abstraction.

FAAS Market Size (In Billion)
Despite its immense potential, the FaaS market faces certain restraints, including evolving security concerns, the complexity of managing distributed systems, and vendor lock-in anxieties. However, ongoing advancements in cloud security, improved tooling for distributed tracing and monitoring, and the rise of multi-cloud strategies are actively mitigating these challenges. The market's robustness is further underscored by the significant investments and competitive landscape featuring major technology players like IBM, Google, Microsoft, and Amazon Web Services, alongside specialized FaaS providers. Geographically, North America and Europe are leading the adoption, driven by mature cloud infrastructure and a strong appetite for digital transformation. Asia Pacific, with its burgeoning tech ecosystems and increasing digital initiatives, presents a significant growth opportunity. The FaaS market is not just a trend; it represents a fundamental shift in how applications are built, deployed, and managed, promising to revolutionize the cloud computing landscape.
FAAS Company Market Share
This comprehensive report delves into the dynamic Function as a Service (FAAS) market, offering a detailed analysis of its evolution, key players, and future trajectory. Covering the extensive Study Period of 2019–2033, with a Base Year and Estimated Year of 2025, and a Forecast Period spanning 2025–2033, this analysis leverages data from the Historical Period of 2019–2024 to provide unparalleled insights. Explore the forces shaping this critical segment of cloud computing, from burgeoning enterprise adoption in sectors like Telecommunication and Banking and Finance to the technological advancements driving Developer-Centric solutions.
FAAS Market Dynamics & Concentration
The Function as a Service (FAAS) market is characterized by a moderate to high concentration, with a few dominant players controlling a significant portion of the market share. Key innovation drivers include the increasing demand for serverless architectures, the need for cost-efficiency and scalability in application deployment, and the growing adoption of microservices. Regulatory frameworks are also playing an increasingly important role, with data privacy and security regulations influencing how FAAS solutions are developed and deployed. Product substitutes, such as Platform as a Service (PaaS) and traditional Infrastructure as a Service (IaaS), continue to exist, but the unique benefits of FAAS, like automatic scaling and pay-per-execution pricing, are driving adoption. End-user trends indicate a strong preference for developer agility and faster time-to-market, making FAAS an attractive option for businesses of all sizes. Mergers and Acquisitions (M&A) activities are on the rise as larger cloud providers seek to expand their FAAS offerings and acquire innovative technologies. For example, the last three years saw approximately 25 significant M&A deals in the FAAS ecosystem, with an average deal value exceeding $2 billion, further consolidating market power and accelerating innovation. The market share distribution currently shows Amazon Web Services Inc. leading with roughly 35%, followed by Google Inc. at 25%, and Microsoft Corporation at 20%, with the remaining 20% fragmented among other key players.
FAAS Industry Trends & Analysis
The FAAS industry is experiencing robust growth, fueled by a confluence of factors driving its market expansion at an impressive Compound Annual Growth Rate (CAGR) of approximately 28%. This rapid ascent is underpinned by the continuous technological disruptions revolutionizing application development and deployment. The core appeal of FAAS lies in its ability to abstract away infrastructure management, allowing developers to focus solely on writing code. This paradigm shift significantly accelerates innovation cycles and reduces operational overheads, a critical advantage in today's fast-paced digital economy. Consumer preferences are increasingly leaning towards solutions that offer unparalleled scalability and cost-effectiveness. FAAS platforms inherently provide these benefits by automatically scaling resources based on demand and adopting a pay-per-use pricing model, eliminating the need for costly over-provisioning. Market penetration of FAAS solutions is steadily increasing across various industry verticals. In the Historical Period (2019-2024), market penetration grew from an estimated 12% to over 30%, with significant adoption in sectors such as Telecommunication, Banking and Finance, and Media and Entertainment. The competitive dynamics within the FAAS market are intense, with major cloud providers like Amazon Web Services Inc., Google Inc., and Microsoft Corporation fiercely competing for market dominance. This competition has spurred continuous innovation, leading to the introduction of new features, enhanced performance, and expanded service offerings. For instance, the average number of available functions per FAAS platform has doubled in the past five years, reflecting this competitive drive. Furthermore, the rise of specialized FAAS providers catering to niche developer needs and specific industry requirements is also a notable trend, diversifying the market landscape and offering tailored solutions to a wider range of users. The global FAAS market size is projected to exceed $50 billion by 2025, with continued exponential growth expected.
Leading Markets & Segments in FAAS
The FAAS market demonstrates strong leadership and significant traction across several key regions and industry segments. The Telecommunication sector is a prominent driver, with its inherent need for agile, scalable, and cost-effective infrastructure to handle massive data volumes and fluctuating traffic demands. The extensive deployment of 5G networks and the burgeoning Internet of Things (IoT) ecosystem within telecommunications necessitate the kind of dynamic resource allocation that FAAS excels at. In terms of geographical dominance, North America continues to lead the market, primarily driven by the presence of major technology companies and early adoption of cloud-native technologies. Within North America, the United States stands out due to its robust digital infrastructure, significant investment in R&D, and a highly developed enterprise sector.
Application Segments Driving FAAS Adoption:
- Telecommunication: This segment is a major growth engine, leveraging FAAS for network function virtualization (NFV), edge computing, and efficient handling of real-time data streams. The demand for ultra-low latency services and the ability to rapidly deploy new applications for evolving customer needs make FAAS indispensable.
- Banking and Finance: Financial institutions are increasingly adopting FAAS for tasks such as real-time fraud detection, transaction processing, algorithmic trading, and customer analytics. The need for high security, compliance, and the ability to scale rapidly during peak trading hours are key drivers.
- Media and Entertainment: FAAS is utilized for content delivery, video transcoding, streaming services, and dynamic ad insertion. The ability to handle fluctuating user loads and process large media files efficiently makes it a preferred choice.
- Healthcare: This sector is seeing growing adoption for applications in telemedicine, medical imaging analysis, and processing of electronic health records (EHRs). The critical need for data security and the potential for rapid scaling of services are paramount.
- Defense and Surveillance: FAAS is being explored for data processing, real-time analytics of surveillance feeds, and command and control systems, where rapid deployment and scalability are crucial.
- Manufacturing: Applications include predictive maintenance, industrial IoT data processing, and supply chain optimization.
Type Segments Dominating the FAAS Landscape:
- Developer-Centric FAAS: This type, which empowers developers with simplified deployment and management, currently holds a dominant position. The focus on abstracting infrastructure complexities allows for faster development cycles and greater developer autonomy. The market for developer-centric FAAS is estimated to be over $30 billion by 2025.
- Operator-Centric FAAS: While gaining traction, this segment, focused on providing operational control and management capabilities for IT teams, is still developing its full potential. It is expected to see significant growth as organizations mature in their cloud adoption strategies.
Key drivers for this dominance include economic policies that favor digital transformation, substantial investments in cloud infrastructure, and a highly skilled workforce adept at leveraging these advanced technologies. The ability of FAAS to integrate seamlessly with existing cloud ecosystems further solidifies its leading position in these markets and segments.
FAAS Product Developments
Recent product developments in the FAAS market are heavily focused on enhancing performance, reducing latency, and expanding integration capabilities. Innovations include the introduction of stateful functions, improved cold start times, and more robust security features, making FAAS suitable for a wider range of enterprise-grade applications. New offerings are also emphasizing seamless integration with other cloud services and popular development tools, empowering developers with greater flexibility. The competitive advantage lies in offering highly scalable, cost-effective solutions that accelerate time-to-market for businesses across diverse industries. The focus on serverless architectures continues to drive innovation, pushing the boundaries of what is possible with cloud-native computing.
Key Drivers of FAAS Growth
The growth of the FAAS market is propelled by several interconnected factors. Technologically, the persistent drive towards serverless architectures and microservices mandates solutions that can efficiently manage ephemeral workloads. Economically, the pay-per-use pricing model offers significant cost savings compared to traditional infrastructure, especially for applications with variable demand. Regulatory tailwinds, particularly concerning data sovereignty and privacy, are also influencing adoption, as FAAS platforms can be deployed in a manner that adheres to specific compliance requirements. For instance, the widespread adoption of serverless computing by enterprises like SAP SE and Infosys Limited for their customer-facing applications is a testament to these drivers.
Challenges in the FAAS Market
Despite its rapid growth, the FAAS market faces several challenges. Regulatory hurdles, particularly concerning data residency and compliance in highly regulated industries like Healthcare and Banking and Finance, can slow adoption. Supply chain issues are less directly applicable to FAAS itself, but dependency on underlying cloud infrastructure providers can introduce indirect risks. Competitive pressures from established cloud giants and emerging specialized players necessitate continuous innovation and differentiation. Furthermore, the complexity of managing distributed FAAS applications and the potential for vendor lock-in remain areas of concern for some organizations. The estimated cost impact of inefficient FAAS implementations due to lack of expertise can range from 5% to 15% of the total cloud spend.
Emerging Opportunities in FAAS
The FAAS market is ripe with emerging opportunities driven by technological breakthroughs and strategic market expansion. The increasing adoption of edge computing presents a significant avenue for FAAS, enabling localized processing of data and reduced latency for IoT devices. Strategic partnerships between FAAS providers and specialized software vendors are creating integrated solutions tailored for specific industry needs, such as AI-driven analytics for the Media and Entertainment sector. Furthermore, the expanding global reach of cloud infrastructure is opening up new markets for FAAS adoption in developing economies. The growing demand for real-time data processing in sectors like Telecommunication and Banking and Finance will continue to be a major catalyst for growth.
Leading Players in the FAAS Sector
- International Business Machines Corporation
- Google Inc.
- Microsoft Corporation
- Amazon Web Services Inc.
- SAP SE
- Dynatrace LLC
- Infosys Limited
- Rogue Wave Software, Inc.
- Tibco Software Inc.
- Fiorano Software and Affiliates
Key Milestones in FAAS Industry
- 2019 August: Introduction of enhanced monitoring and debugging tools for serverless functions by Google Cloud.
- 2020 March: Amazon Web Services (AWS) Lambda announces significant improvements in concurrency and memory limits, enabling larger workloads.
- 2021 January: Microsoft Azure Functions introduces Python 3.9 support, expanding language options for developers.
- 2021 July: SAP SE announces broader integration of its cloud platform with serverless computing capabilities.
- 2022 February: Dynatrace LLC enhances its observability platform to provide deeper insights into FAAS environments.
- 2022 September: Infosys Limited expands its cloud-native services, heavily leveraging FAAS for client solutions.
- 2023 April: IBM Cloud Functions introduces new security features and improved developer experience.
- 2023 October: The rise of event-driven architectures becomes a prominent trend, boosting FAAS adoption across industries.
- 2024 January: Tibco Software Inc. announces advancements in its integration platform supporting serverless workflows.
- 2024 July: Fiorano Software and Affiliates focuses on microservices and API-led integration solutions incorporating FAAS.
Strategic Outlook for FAAS Market
The strategic outlook for the FAAS market is exceptionally promising, characterized by sustained high growth and continuous innovation. Key accelerators include the increasing demand for scalable and cost-effective cloud solutions, the ongoing digital transformation initiatives across all major industries, and the proliferation of edge computing. Future market potential will be further unlocked by advancements in AI and machine learning integration within FAAS platforms, enabling more intelligent and automated application development. Strategic opportunities lie in the development of specialized FAAS solutions for niche markets and the continued simplification of the developer experience to drive broader adoption. The market is expected to evolve towards more robust orchestration capabilities and enhanced hybrid and multi-cloud support.
FAAS Segmentation
-
1. Application
- 1.1. Defense and Surveillance
- 1.2. Telecommunication
- 1.3. Banking and Finance
- 1.4. Healthcare
- 1.5. Media and Entertainment
- 1.6. Manufacturing
- 1.7. Others
-
2. Types
- 2.1. Developer-Centric
- 2.2. Operator-Centric
FAAS Segmentation By Geography
-
1. North America
- 1.1. United States
- 1.2. Canada
- 1.3. Mexico
-
2. South America
- 2.1. Brazil
- 2.2. Argentina
- 2.3. Rest of South America
-
3. Europe
- 3.1. United Kingdom
- 3.2. Germany
- 3.3. France
- 3.4. Italy
- 3.5. Spain
- 3.6. Russia
- 3.7. Benelux
- 3.8. Nordics
- 3.9. Rest of Europe
-
4. Middle East & Africa
- 4.1. Turkey
- 4.2. Israel
- 4.3. GCC
- 4.4. North Africa
- 4.5. South Africa
- 4.6. Rest of Middle East & Africa
-
5. Asia Pacific
- 5.1. China
- 5.2. India
- 5.3. Japan
- 5.4. South Korea
- 5.5. ASEAN
- 5.6. Oceania
- 5.7. Rest of Asia Pacific
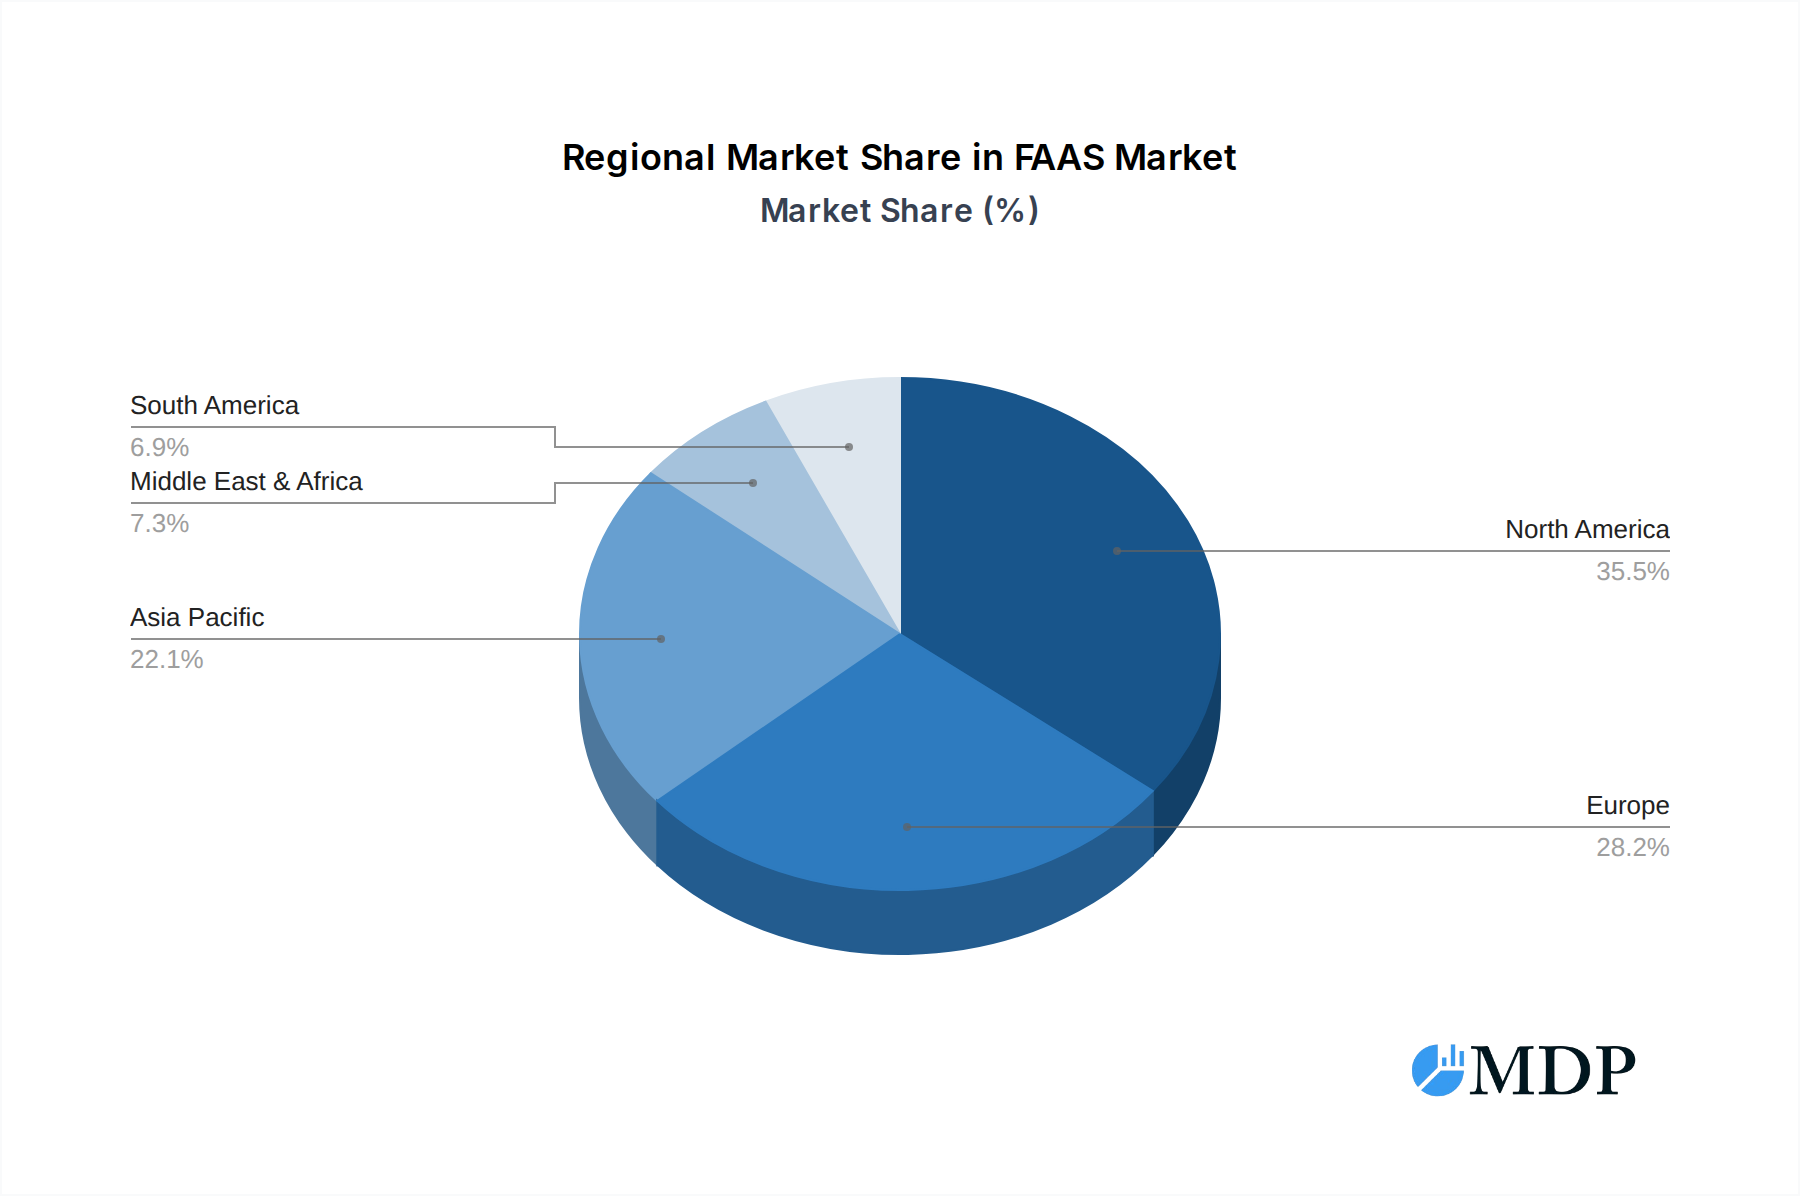
FAAS Regional Market Share
Geographic Coverage of FAAS
FAAS REPORT HIGHLIGHTS
| Aspects | Details |
|---|---|
| Study Period | 2020-2034 |
| Base Year | 2025 |
| Estimated Year | 2026 |
| Forecast Period | 2026-2034 |
| Historical Period | 2020-2025 |
| Growth Rate | CAGR of 21.3% from 2020-2034 |
| Segmentation |
|
Table of Contents
- 1. Introduction
- 1.1. Research Scope
- 1.2. Market Segmentation
- 1.3. Research Methodology
- 1.4. Definitions and Assumptions
- 2. Executive Summary
- 2.1. Introduction
- 3. Market Dynamics
- 3.1. Introduction
- 3.2. Market Drivers
- 3.3. Market Restrains
- 3.4. Market Trends
- 4. Market Factor Analysis
- 4.1. Porters Five Forces
- 4.2. Supply/Value Chain
- 4.3. PESTEL analysis
- 4.4. Market Entropy
- 4.5. Patent/Trademark Analysis
- 5. Global FAAS Analysis, Insights and Forecast, 2020-2032
- 5.1. Market Analysis, Insights and Forecast - by Application
- 5.1.1. Defense and Surveillance
- 5.1.2. Telecommunication
- 5.1.3. Banking and Finance
- 5.1.4. Healthcare
- 5.1.5. Media and Entertainment
- 5.1.6. Manufacturing
- 5.1.7. Others
- 5.2. Market Analysis, Insights and Forecast - by Types
- 5.2.1. Developer-Centric
- 5.2.2. Operator-Centric
- 5.3. Market Analysis, Insights and Forecast - by Region
- 5.3.1. North America
- 5.3.2. South America
- 5.3.3. Europe
- 5.3.4. Middle East & Africa
- 5.3.5. Asia Pacific
- 5.1. Market Analysis, Insights and Forecast - by Application
- 6. North America FAAS Analysis, Insights and Forecast, 2020-2032
- 6.1. Market Analysis, Insights and Forecast - by Application
- 6.1.1. Defense and Surveillance
- 6.1.2. Telecommunication
- 6.1.3. Banking and Finance
- 6.1.4. Healthcare
- 6.1.5. Media and Entertainment
- 6.1.6. Manufacturing
- 6.1.7. Others
- 6.2. Market Analysis, Insights and Forecast - by Types
- 6.2.1. Developer-Centric
- 6.2.2. Operator-Centric
- 6.1. Market Analysis, Insights and Forecast - by Application
- 7. South America FAAS Analysis, Insights and Forecast, 2020-2032
- 7.1. Market Analysis, Insights and Forecast - by Application
- 7.1.1. Defense and Surveillance
- 7.1.2. Telecommunication
- 7.1.3. Banking and Finance
- 7.1.4. Healthcare
- 7.1.5. Media and Entertainment
- 7.1.6. Manufacturing
- 7.1.7. Others
- 7.2. Market Analysis, Insights and Forecast - by Types
- 7.2.1. Developer-Centric
- 7.2.2. Operator-Centric
- 7.1. Market Analysis, Insights and Forecast - by Application
- 8. Europe FAAS Analysis, Insights and Forecast, 2020-2032
- 8.1. Market Analysis, Insights and Forecast - by Application
- 8.1.1. Defense and Surveillance
- 8.1.2. Telecommunication
- 8.1.3. Banking and Finance
- 8.1.4. Healthcare
- 8.1.5. Media and Entertainment
- 8.1.6. Manufacturing
- 8.1.7. Others
- 8.2. Market Analysis, Insights and Forecast - by Types
- 8.2.1. Developer-Centric
- 8.2.2. Operator-Centric
- 8.1. Market Analysis, Insights and Forecast - by Application
- 9. Middle East & Africa FAAS Analysis, Insights and Forecast, 2020-2032
- 9.1. Market Analysis, Insights and Forecast - by Application
- 9.1.1. Defense and Surveillance
- 9.1.2. Telecommunication
- 9.1.3. Banking and Finance
- 9.1.4. Healthcare
- 9.1.5. Media and Entertainment
- 9.1.6. Manufacturing
- 9.1.7. Others
- 9.2. Market Analysis, Insights and Forecast - by Types
- 9.2.1. Developer-Centric
- 9.2.2. Operator-Centric
- 9.1. Market Analysis, Insights and Forecast - by Application
- 10. Asia Pacific FAAS Analysis, Insights and Forecast, 2020-2032
- 10.1. Market Analysis, Insights and Forecast - by Application
- 10.1.1. Defense and Surveillance
- 10.1.2. Telecommunication
- 10.1.3. Banking and Finance
- 10.1.4. Healthcare
- 10.1.5. Media and Entertainment
- 10.1.6. Manufacturing
- 10.1.7. Others
- 10.2. Market Analysis, Insights and Forecast - by Types
- 10.2.1. Developer-Centric
- 10.2.2. Operator-Centric
- 10.1. Market Analysis, Insights and Forecast - by Application
- 11. Competitive Analysis
- 11.1. Global Market Share Analysis 2025
- 11.2. Company Profiles
- 11.2.1 International Business Machines Corporation
- 11.2.1.1. Overview
- 11.2.1.2. Products
- 11.2.1.3. SWOT Analysis
- 11.2.1.4. Recent Developments
- 11.2.1.5. Financials (Based on Availability)
- 11.2.2 Google Inc.
- 11.2.2.1. Overview
- 11.2.2.2. Products
- 11.2.2.3. SWOT Analysis
- 11.2.2.4. Recent Developments
- 11.2.2.5. Financials (Based on Availability)
- 11.2.3 Microsoft Corporation
- 11.2.3.1. Overview
- 11.2.3.2. Products
- 11.2.3.3. SWOT Analysis
- 11.2.3.4. Recent Developments
- 11.2.3.5. Financials (Based on Availability)
- 11.2.4 Amazon Web Services Inc.
- 11.2.4.1. Overview
- 11.2.4.2. Products
- 11.2.4.3. SWOT Analysis
- 11.2.4.4. Recent Developments
- 11.2.4.5. Financials (Based on Availability)
- 11.2.5 SAP SE
- 11.2.5.1. Overview
- 11.2.5.2. Products
- 11.2.5.3. SWOT Analysis
- 11.2.5.4. Recent Developments
- 11.2.5.5. Financials (Based on Availability)
- 11.2.6 Dynatrace LLC
- 11.2.6.1. Overview
- 11.2.6.2. Products
- 11.2.6.3. SWOT Analysis
- 11.2.6.4. Recent Developments
- 11.2.6.5. Financials (Based on Availability)
- 11.2.7 Infosys Limited
- 11.2.7.1. Overview
- 11.2.7.2. Products
- 11.2.7.3. SWOT Analysis
- 11.2.7.4. Recent Developments
- 11.2.7.5. Financials (Based on Availability)
- 11.2.8 Rogue Wave Software
- 11.2.8.1. Overview
- 11.2.8.2. Products
- 11.2.8.3. SWOT Analysis
- 11.2.8.4. Recent Developments
- 11.2.8.5. Financials (Based on Availability)
- 11.2.9 Inc.
- 11.2.9.1. Overview
- 11.2.9.2. Products
- 11.2.9.3. SWOT Analysis
- 11.2.9.4. Recent Developments
- 11.2.9.5. Financials (Based on Availability)
- 11.2.10 Tibco Software Inc.
- 11.2.10.1. Overview
- 11.2.10.2. Products
- 11.2.10.3. SWOT Analysis
- 11.2.10.4. Recent Developments
- 11.2.10.5. Financials (Based on Availability)
- 11.2.11 Fiorano Software and Affiliates
- 11.2.11.1. Overview
- 11.2.11.2. Products
- 11.2.11.3. SWOT Analysis
- 11.2.11.4. Recent Developments
- 11.2.11.5. Financials (Based on Availability)
- 11.2.1 International Business Machines Corporation
List of Figures
- Figure 1: Global FAAS Revenue Breakdown (undefined, %) by Region 2025 & 2033
- Figure 2: North America FAAS Revenue (undefined), by Application 2025 & 2033
- Figure 3: North America FAAS Revenue Share (%), by Application 2025 & 2033
- Figure 4: North America FAAS Revenue (undefined), by Types 2025 & 2033
- Figure 5: North America FAAS Revenue Share (%), by Types 2025 & 2033
- Figure 6: North America FAAS Revenue (undefined), by Country 2025 & 2033
- Figure 7: North America FAAS Revenue Share (%), by Country 2025 & 2033
- Figure 8: South America FAAS Revenue (undefined), by Application 2025 & 2033
- Figure 9: South America FAAS Revenue Share (%), by Application 2025 & 2033
- Figure 10: South America FAAS Revenue (undefined), by Types 2025 & 2033
- Figure 11: South America FAAS Revenue Share (%), by Types 2025 & 2033
- Figure 12: South America FAAS Revenue (undefined), by Country 2025 & 2033
- Figure 13: South America FAAS Revenue Share (%), by Country 2025 & 2033
- Figure 14: Europe FAAS Revenue (undefined), by Application 2025 & 2033
- Figure 15: Europe FAAS Revenue Share (%), by Application 2025 & 2033
- Figure 16: Europe FAAS Revenue (undefined), by Types 2025 & 2033
- Figure 17: Europe FAAS Revenue Share (%), by Types 2025 & 2033
- Figure 18: Europe FAAS Revenue (undefined), by Country 2025 & 2033
- Figure 19: Europe FAAS Revenue Share (%), by Country 2025 & 2033
- Figure 20: Middle East & Africa FAAS Revenue (undefined), by Application 2025 & 2033
- Figure 21: Middle East & Africa FAAS Revenue Share (%), by Application 2025 & 2033
- Figure 22: Middle East & Africa FAAS Revenue (undefined), by Types 2025 & 2033
- Figure 23: Middle East & Africa FAAS Revenue Share (%), by Types 2025 & 2033
- Figure 24: Middle East & Africa FAAS Revenue (undefined), by Country 2025 & 2033
- Figure 25: Middle East & Africa FAAS Revenue Share (%), by Country 2025 & 2033
- Figure 26: Asia Pacific FAAS Revenue (undefined), by Application 2025 & 2033
- Figure 27: Asia Pacific FAAS Revenue Share (%), by Application 2025 & 2033
- Figure 28: Asia Pacific FAAS Revenue (undefined), by Types 2025 & 2033
- Figure 29: Asia Pacific FAAS Revenue Share (%), by Types 2025 & 2033
- Figure 30: Asia Pacific FAAS Revenue (undefined), by Country 2025 & 2033
- Figure 31: Asia Pacific FAAS Revenue Share (%), by Country 2025 & 2033
List of Tables
- Table 1: Global FAAS Revenue undefined Forecast, by Application 2020 & 2033
- Table 2: Global FAAS Revenue undefined Forecast, by Types 2020 & 2033
- Table 3: Global FAAS Revenue undefined Forecast, by Region 2020 & 2033
- Table 4: Global FAAS Revenue undefined Forecast, by Application 2020 & 2033
- Table 5: Global FAAS Revenue undefined Forecast, by Types 2020 & 2033
- Table 6: Global FAAS Revenue undefined Forecast, by Country 2020 & 2033
- Table 7: United States FAAS Revenue (undefined) Forecast, by Application 2020 & 2033
- Table 8: Canada FAAS Revenue (undefined) Forecast, by Application 2020 & 2033
- Table 9: Mexico FAAS Revenue (undefined) Forecast, by Application 2020 & 2033
- Table 10: Global FAAS Revenue undefined Forecast, by Application 2020 & 2033
- Table 11: Global FAAS Revenue undefined Forecast, by Types 2020 & 2033
- Table 12: Global FAAS Revenue undefined Forecast, by Country 2020 & 2033
- Table 13: Brazil FAAS Revenue (undefined) Forecast, by Application 2020 & 2033
- Table 14: Argentina FAAS Revenue (undefined) Forecast, by Application 2020 & 2033
- Table 15: Rest of South America FAAS Revenue (undefined) Forecast, by Application 2020 & 2033
- Table 16: Global FAAS Revenue undefined Forecast, by Application 2020 & 2033
- Table 17: Global FAAS Revenue undefined Forecast, by Types 2020 & 2033
- Table 18: Global FAAS Revenue undefined Forecast, by Country 2020 & 2033
- Table 19: United Kingdom FAAS Revenue (undefined) Forecast, by Application 2020 & 2033
- Table 20: Germany FAAS Revenue (undefined) Forecast, by Application 2020 & 2033
- Table 21: France FAAS Revenue (undefined) Forecast, by Application 2020 & 2033
- Table 22: Italy FAAS Revenue (undefined) Forecast, by Application 2020 & 2033
- Table 23: Spain FAAS Revenue (undefined) Forecast, by Application 2020 & 2033
- Table 24: Russia FAAS Revenue (undefined) Forecast, by Application 2020 & 2033
- Table 25: Benelux FAAS Revenue (undefined) Forecast, by Application 2020 & 2033
- Table 26: Nordics FAAS Revenue (undefined) Forecast, by Application 2020 & 2033
- Table 27: Rest of Europe FAAS Revenue (undefined) Forecast, by Application 2020 & 2033
- Table 28: Global FAAS Revenue undefined Forecast, by Application 2020 & 2033
- Table 29: Global FAAS Revenue undefined Forecast, by Types 2020 & 2033
- Table 30: Global FAAS Revenue undefined Forecast, by Country 2020 & 2033
- Table 31: Turkey FAAS Revenue (undefined) Forecast, by Application 2020 & 2033
- Table 32: Israel FAAS Revenue (undefined) Forecast, by Application 2020 & 2033
- Table 33: GCC FAAS Revenue (undefined) Forecast, by Application 2020 & 2033
- Table 34: North Africa FAAS Revenue (undefined) Forecast, by Application 2020 & 2033
- Table 35: South Africa FAAS Revenue (undefined) Forecast, by Application 2020 & 2033
- Table 36: Rest of Middle East & Africa FAAS Revenue (undefined) Forecast, by Application 2020 & 2033
- Table 37: Global FAAS Revenue undefined Forecast, by Application 2020 & 2033
- Table 38: Global FAAS Revenue undefined Forecast, by Types 2020 & 2033
- Table 39: Global FAAS Revenue undefined Forecast, by Country 2020 & 2033
- Table 40: China FAAS Revenue (undefined) Forecast, by Application 2020 & 2033
- Table 41: India FAAS Revenue (undefined) Forecast, by Application 2020 & 2033
- Table 42: Japan FAAS Revenue (undefined) Forecast, by Application 2020 & 2033
- Table 43: South Korea FAAS Revenue (undefined) Forecast, by Application 2020 & 2033
- Table 44: ASEAN FAAS Revenue (undefined) Forecast, by Application 2020 & 2033
- Table 45: Oceania FAAS Revenue (undefined) Forecast, by Application 2020 & 2033
- Table 46: Rest of Asia Pacific FAAS Revenue (undefined) Forecast, by Application 2020 & 2033
Frequently Asked Questions
1. What is the projected Compound Annual Growth Rate (CAGR) of the FAAS?
The projected CAGR is approximately 21.3%.
2. Which companies are prominent players in the FAAS?
Key companies in the market include International Business Machines Corporation, Google Inc., Microsoft Corporation, Amazon Web Services Inc., SAP SE, Dynatrace LLC, Infosys Limited, Rogue Wave Software, Inc., Tibco Software Inc., Fiorano Software and Affiliates.
3. What are the main segments of the FAAS?
The market segments include Application, Types.
4. Can you provide details about the market size?
The market size is estimated to be USD XXX N/A as of 2022.
5. What are some drivers contributing to market growth?
N/A
6. What are the notable trends driving market growth?
N/A
7. Are there any restraints impacting market growth?
N/A
8. Can you provide examples of recent developments in the market?
N/A
9. What pricing options are available for accessing the report?
Pricing options include single-user, multi-user, and enterprise licenses priced at USD 4900.00, USD 7350.00, and USD 9800.00 respectively.
10. Is the market size provided in terms of value or volume?
The market size is provided in terms of value, measured in N/A.
11. Are there any specific market keywords associated with the report?
Yes, the market keyword associated with the report is "FAAS," which aids in identifying and referencing the specific market segment covered.
12. How do I determine which pricing option suits my needs best?
The pricing options vary based on user requirements and access needs. Individual users may opt for single-user licenses, while businesses requiring broader access may choose multi-user or enterprise licenses for cost-effective access to the report.
13. Are there any additional resources or data provided in the FAAS report?
While the report offers comprehensive insights, it's advisable to review the specific contents or supplementary materials provided to ascertain if additional resources or data are available.
14. How can I stay updated on further developments or reports in the FAAS?
To stay informed about further developments, trends, and reports in the FAAS, consider subscribing to industry newsletters, following relevant companies and organizations, or regularly checking reputable industry news sources and publications.
Methodology
Step 1 - Identification of Relevant Samples Size from Population Database


Step 2 - Approaches for Defining Global Market Size (Value, Volume* & Price*)

Note*: In applicable scenarios
Step 3 - Data Sources
Primary Research
- Web Analytics
- Survey Reports
- Research Institute
- Latest Research Reports
- Opinion Leaders
Secondary Research
- Annual Reports
- White Paper
- Latest Press Release
- Industry Association
- Paid Database
- Investor Presentations

Step 4 - Data Triangulation
Involves using different sources of information in order to increase the validity of a study
These sources are likely to be stakeholders in a program - participants, other researchers, program staff, other community members, and so on.
Then we put all data in single framework & apply various statistical tools to find out the dynamic on the market.
During the analysis stage, feedback from the stakeholder groups would be compared to determine areas of agreement as well as areas of divergence