

Key Insights
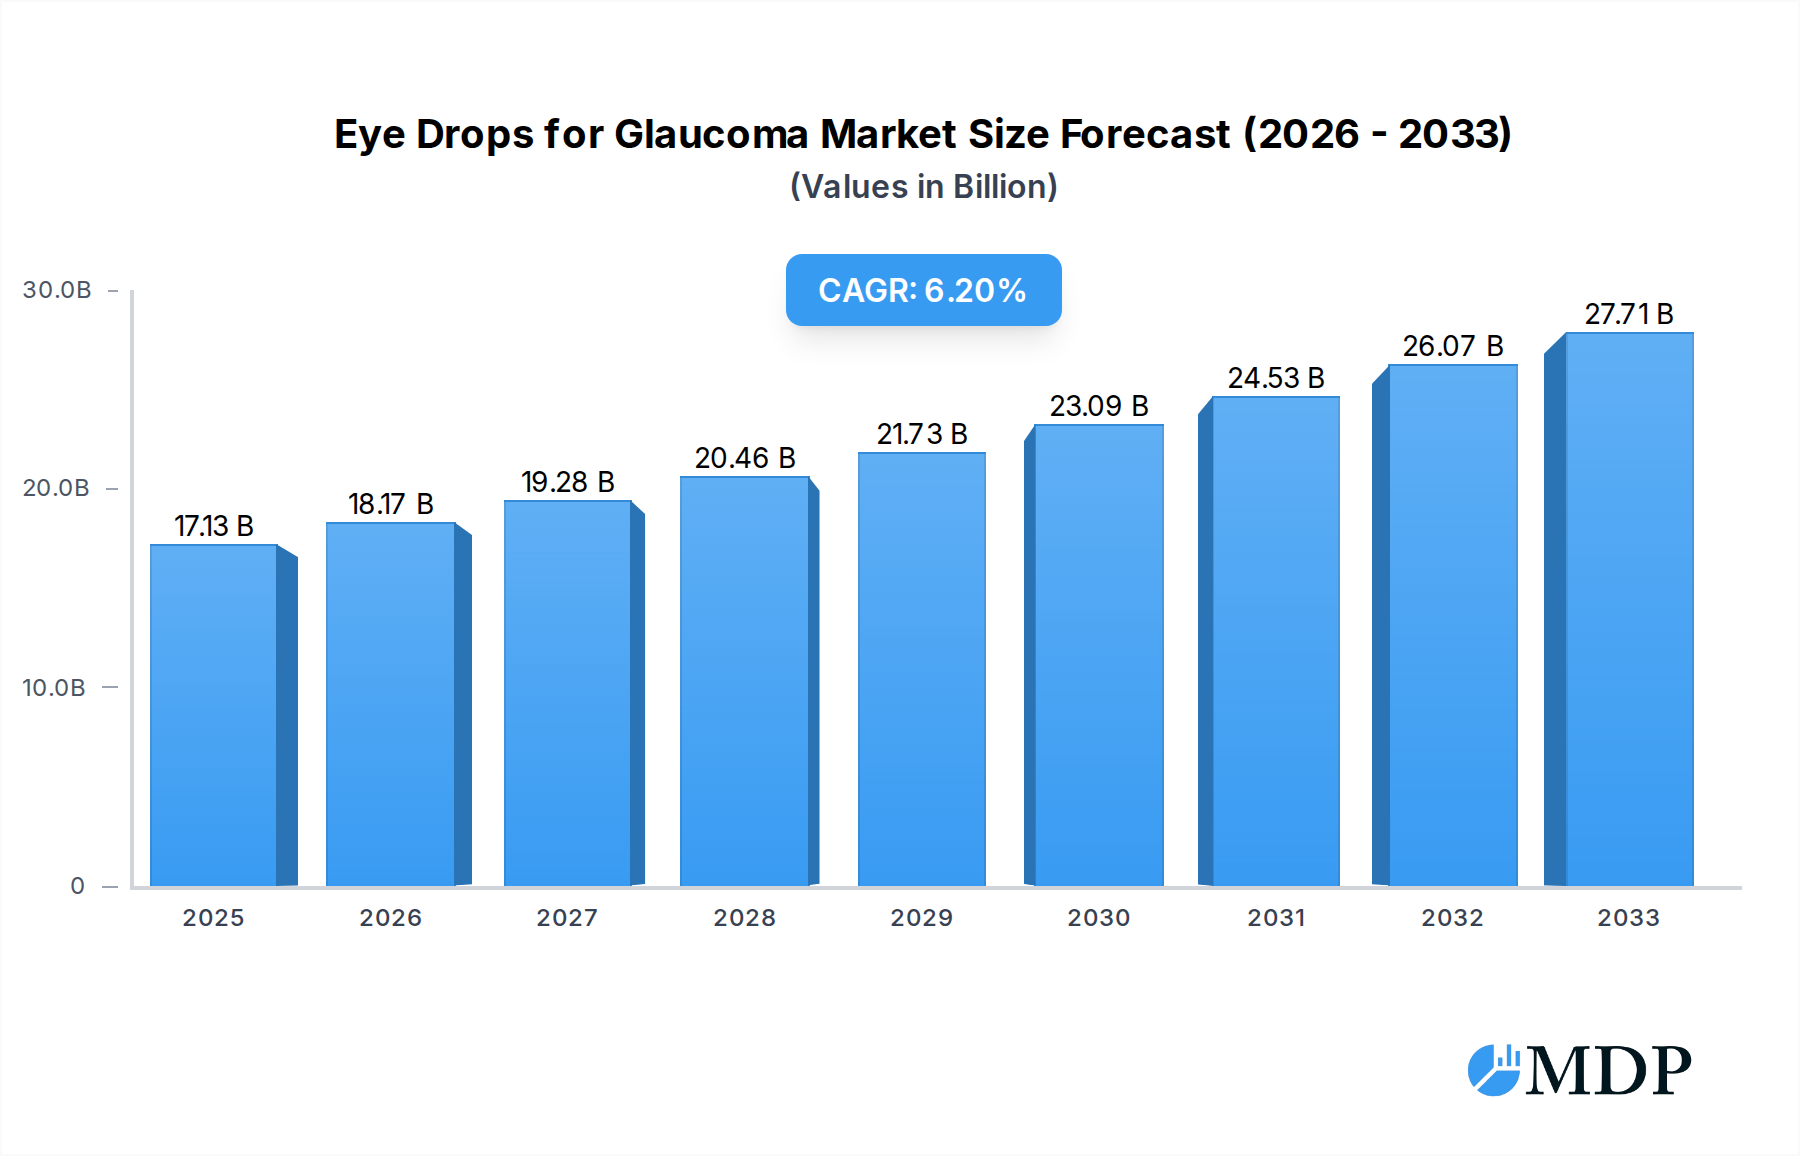
The global market for Eye Drops for Glaucoma is poised for significant expansion, projected to reach $16.15 billion in 2024 and sustain a robust Compound Annual Growth Rate (CAGR) of 6.1% through 2033. This upward trajectory is primarily fueled by the escalating prevalence of glaucoma worldwide, a leading cause of irreversible blindness, which necessitates consistent and accessible treatment options. Advancements in pharmaceutical research and development are leading to the introduction of more effective and well-tolerated glaucoma eye drop formulations, including novel prostaglandin analogs and combination therapies. These innovations are enhancing patient compliance and treatment outcomes, thereby driving market demand. Furthermore, increasing healthcare expenditure, coupled with growing awareness among both patients and healthcare professionals about early diagnosis and management of glaucoma, further underpins the market's growth. The expanding geriatric population, a demographic highly susceptible to ocular diseases like glaucoma, also represents a substantial market driver.

Eye Drops for Glaucoma Market Size (In Billion)
The market is segmented into key applications, with hospitals and ophthalmic clinics emerging as primary consumption hubs due to specialized diagnostic and treatment facilities. Pharmacies also play a crucial role in dispensing these essential medications. The types of eye drops available, including Bimatoprost, Latanoprost, Tafluprost, and Travoprost, cater to diverse patient needs and treatment protocols, with a growing preference for those offering improved efficacy and reduced side effects. Geographically, North America and Europe currently lead the market, driven by advanced healthcare infrastructure and high disposable incomes. However, the Asia Pacific region is anticipated to witness the fastest growth, propelled by a burgeoning population, increasing incidence of lifestyle-related eye conditions, and improving access to healthcare services. Key players like Novartis, AbbVie, and Accord Healthcare are actively engaged in product innovation, strategic collaborations, and market expansion initiatives to capitalize on these growth opportunities.
Eye Drops for Glaucoma Company Market Share
Eye Drops for Glaucoma Market Analysis: Strategic Report 2019–2033
This comprehensive report offers an in-depth analysis of the global Eye Drops for Glaucoma market, providing critical insights for industry stakeholders. Spanning the historical period of 2019–2024, with a base year of 2025 and a forecast period extending to 2033, this report leverages high-traffic keywords to ensure maximum search visibility. Our analysis encompasses market dynamics, industry trends, leading segments, product innovations, growth drivers, challenges, and emerging opportunities, positioning key players and outlining a strategic outlook for this vital sector. The projected market size is expected to reach several billion dollars by 2033, driven by an increasing prevalence of glaucoma and advancements in ophthalmic treatments.
Eye Drops for Glaucoma Market Dynamics & Concentration
The global Eye Drops for Glaucoma market exhibits a moderate to high level of concentration, with several multinational pharmaceutical companies dominating the landscape. Innovation drivers are primarily fueled by research and development efforts focused on enhanced efficacy, reduced side effects, and improved patient compliance. Regulatory frameworks, governed by bodies like the FDA and EMA, play a crucial role in market access and product approval. Product substitutes, though limited in the direct glaucoma treatment space, include surgical interventions and alternative therapies. End-user trends indicate a growing preference for convenient, at-home treatment options. Merger and acquisition (M&A) activities, estimated to account for a significant number of billion-dollar deals within the forecast period, are strategically employed by leading players to expand their product portfolios and market reach. Key market share holders are actively engaged in consolidating their positions.
- Innovation Drivers: Novel drug delivery systems, combination therapies, and prostaglandin analog advancements.
- Regulatory Frameworks: Strict approval processes for efficacy and safety, post-market surveillance.
- End-User Trends: Growing demand for preservative-free formulations and patient-friendly packaging.
- M&A Activities: Strategic acquisitions for market expansion and portfolio diversification, with an estimated several billion dollars in deal value over the study period.
Eye Drops for Glaucoma Industry Trends & Analysis
The Eye Drops for Glaucoma industry is poised for substantial growth, driven by an aging global population, a rising incidence of age-related eye conditions like glaucoma, and increasing awareness among patients and healthcare professionals. The projected Compound Annual Growth Rate (CAGR) for the forecast period is robust, contributing to an estimated market valuation in the billions of dollars. Technological disruptions are continuously reshaping the market, with advancements in drug formulation leading to more potent and well-tolerated eye drop solutions. Consumer preferences are shifting towards treatments that offer improved patient outcomes and fewer adverse effects, such as stinging or burning sensations upon application. Competitive dynamics are intensifying, characterized by significant investments in R&D, strategic partnerships, and aggressive marketing strategies by leading pharmaceutical entities to capture market share. Market penetration is steadily increasing, particularly in emerging economies, as access to advanced healthcare solutions improves.
- Market Growth Drivers: Increasing prevalence of glaucoma, aging demographics, and rising healthcare expenditure.
- Technological Disruptions: Development of sustained-release formulations, combination therapies, and novel drug delivery mechanisms.
- Consumer Preferences: Demand for effective, safe, and convenient treatment options with minimal side effects.
- Competitive Dynamics: Intense R&D efforts, strategic alliances, and market expansion initiatives by key players.
Leading Markets & Segments in Eye Drops for Glaucoma
The global Eye Drops for Glaucoma market is led by North America, with the United States representing a significant portion of the market value due to high healthcare spending and advanced diagnostic capabilities. Asia Pacific is emerging as a rapidly growing region, fueled by increasing awareness, improving healthcare infrastructure, and a large patient pool. Within the application segments, Ophthalmic Clinics are the dominant channel, followed closely by Hospitals and Pharmacies, reflecting the specialized nature of glaucoma diagnosis and management. The Others segment, encompassing direct-to-patient sales and specialized healthcare providers, also contributes to market growth.
In terms of product types, prostaglandin analogs remain the cornerstone of glaucoma treatment. Latanoprost and Travoprost currently hold significant market share due to their established efficacy and availability, with projected sales in the billions. Bimatoprost also commands a substantial market presence. Tafluprost is gaining traction due to its favorable safety profile.
- Dominant Region: North America, with the United States leading in market value.
- Emerging Region: Asia Pacific, driven by increasing healthcare access and awareness.
- Leading Application Segment: Ophthalmic Clinics, followed by Hospitals and Pharmacies.
- Key Product Types:
- Latanoprost: Established efficacy, significant market share.
- Travoprost: Widely prescribed, strong market penetration.
- Bimatoprost: Effective in managing intraocular pressure, substantial market value.
- Tafluprost: Growing adoption due to favorable safety profile and reduced side effects.
Eye Drops for Glaucoma Product Developments
Product developments in the Eye Drops for Glaucoma market are focused on enhancing therapeutic efficacy, improving patient adherence, and minimizing adverse effects. Innovations include the development of preservative-free formulations, combination therapies to reduce the number of daily eye drop administrations, and novel drug delivery systems for sustained release. These advancements aim to provide better intraocular pressure (IOP) control and a more comfortable patient experience, contributing to improved disease management and a projected market value in the billions. Companies are actively investing in R&D to secure a competitive advantage through differentiated product offerings.
Key Drivers of Eye Drops for Glaucoma Growth
The growth of the Eye Drops for Glaucoma market is propelled by several interconnected factors. The increasing global prevalence of glaucoma, largely attributed to an aging population and rising rates of diabetes and hypertension, creates a sustained demand for effective treatments. Technological advancements in drug formulation and delivery systems are leading to the development of more potent and patient-friendly eye drops, fostering higher adherence rates and improved therapeutic outcomes. Furthermore, favorable reimbursement policies in many developed nations and expanding healthcare access in emerging economies contribute to increased market penetration and overall market expansion, driving revenue to billions.
- Demographic Shifts: Aging global population and increased incidence of age-related eye diseases.
- Technological Innovations: Development of advanced drug delivery systems and preservative-free formulations.
- Healthcare Policy: Supportive reimbursement policies and expanding healthcare infrastructure.
Challenges in the Eye Drops for Glaucoma Market
Despite robust growth prospects, the Eye Drops for Glaucoma market faces several challenges. Stringent regulatory approval processes can lead to lengthy development timelines and high R&D costs. Supply chain disruptions, exacerbated by global events, can impact the availability of essential raw materials and finished products, potentially leading to billions in lost revenue. Intense competition from established players and the emergence of generics also exert pricing pressures. Furthermore, patient adherence remains a concern, with some individuals struggling with the daily regimen of eye drop application, impacting treatment effectiveness and market potential.
- Regulatory Hurdles: Lengthy and costly approval processes for new formulations.
- Supply Chain Vulnerabilities: Potential disruptions affecting raw material sourcing and product distribution.
- Pricing Pressures: Competition from generic alternatives and market saturation.
Emerging Opportunities in Eye Drops for Glaucoma
The Eye Drops for Glaucoma market is ripe with emerging opportunities for innovation and expansion. The development of novel therapeutic agents that target different pathways involved in glaucoma pathogenesis presents a significant opportunity for breakthrough treatments, potentially reaching billions in market value. Strategic partnerships between pharmaceutical companies and academic institutions can accelerate research and development, leading to the faster introduction of groundbreaking therapies. Furthermore, expanding market penetration into underserved regions with high unmet needs and increasing awareness about glaucoma screening and management can unlock substantial growth potential.
Leading Players in the Eye Drops for Glaucoma Sector
- Thea Pharmaceuticals Ltd
- FDC International Ltd
- Martindale Pharma
- Zentiva
- Upjohn UK Limited
- Beacon Pharmaceuticals
- Novartis Pharmaceuticals UK Ltd
- Mylan
- Accord Healthcare Limited
- Sandoz Limited
- Thornton & Ross Ltd
- Aspire Pharma Ltd
- AbbVie Ltd
Key Milestones in Eye Drops for Glaucoma Industry
- 2019: Introduction of new fixed-combination eye drops offering improved IOP control.
- 2020: Increased focus on preservative-free formulations due to growing patient awareness of ocular surface disease.
- 2021: Significant investment in R&D for novel glaucoma treatments targeting neuroprotection.
- 2022: Advancements in drug delivery systems enabling once-daily dosing for certain prostaglandin analogs.
- 2023: Expansion of telehealth services for glaucoma monitoring and prescription management.
Strategic Outlook for Eye Drops for Glaucoma Market
The strategic outlook for the Eye Drops for Glaucoma market remains highly positive, with continued innovation and market expansion as key growth accelerators. The ongoing development of novel therapeutic classes and combination therapies will address unmet clinical needs and enhance patient compliance, driving market value into the billions. Strategic collaborations and acquisitions will continue to shape the competitive landscape, enabling companies to broaden their portfolios and geographical reach. A strong emphasis on patient-centric solutions, including user-friendly packaging and digital health integration, will be crucial for sustained success in this dynamic and vital sector of ophthalmic care.
Eye Drops for Glaucoma Segmentation
-
1. Application
- 1.1. Hospital
- 1.2. Ophthalmic Clinic
- 1.3. Pharmacy
- 1.4. Others
-
2. Types
- 2.1. Bimatoprost
- 2.2. Latanoprost
- 2.3. Tafluprost
- 2.4. Travoprost
Eye Drops for Glaucoma Segmentation By Geography
-
1. North America
- 1.1. United States
- 1.2. Canada
- 1.3. Mexico
-
2. South America
- 2.1. Brazil
- 2.2. Argentina
- 2.3. Rest of South America
-
3. Europe
- 3.1. United Kingdom
- 3.2. Germany
- 3.3. France
- 3.4. Italy
- 3.5. Spain
- 3.6. Russia
- 3.7. Benelux
- 3.8. Nordics
- 3.9. Rest of Europe
-
4. Middle East & Africa
- 4.1. Turkey
- 4.2. Israel
- 4.3. GCC
- 4.4. North Africa
- 4.5. South Africa
- 4.6. Rest of Middle East & Africa
-
5. Asia Pacific
- 5.1. China
- 5.2. India
- 5.3. Japan
- 5.4. South Korea
- 5.5. ASEAN
- 5.6. Oceania
- 5.7. Rest of Asia Pacific
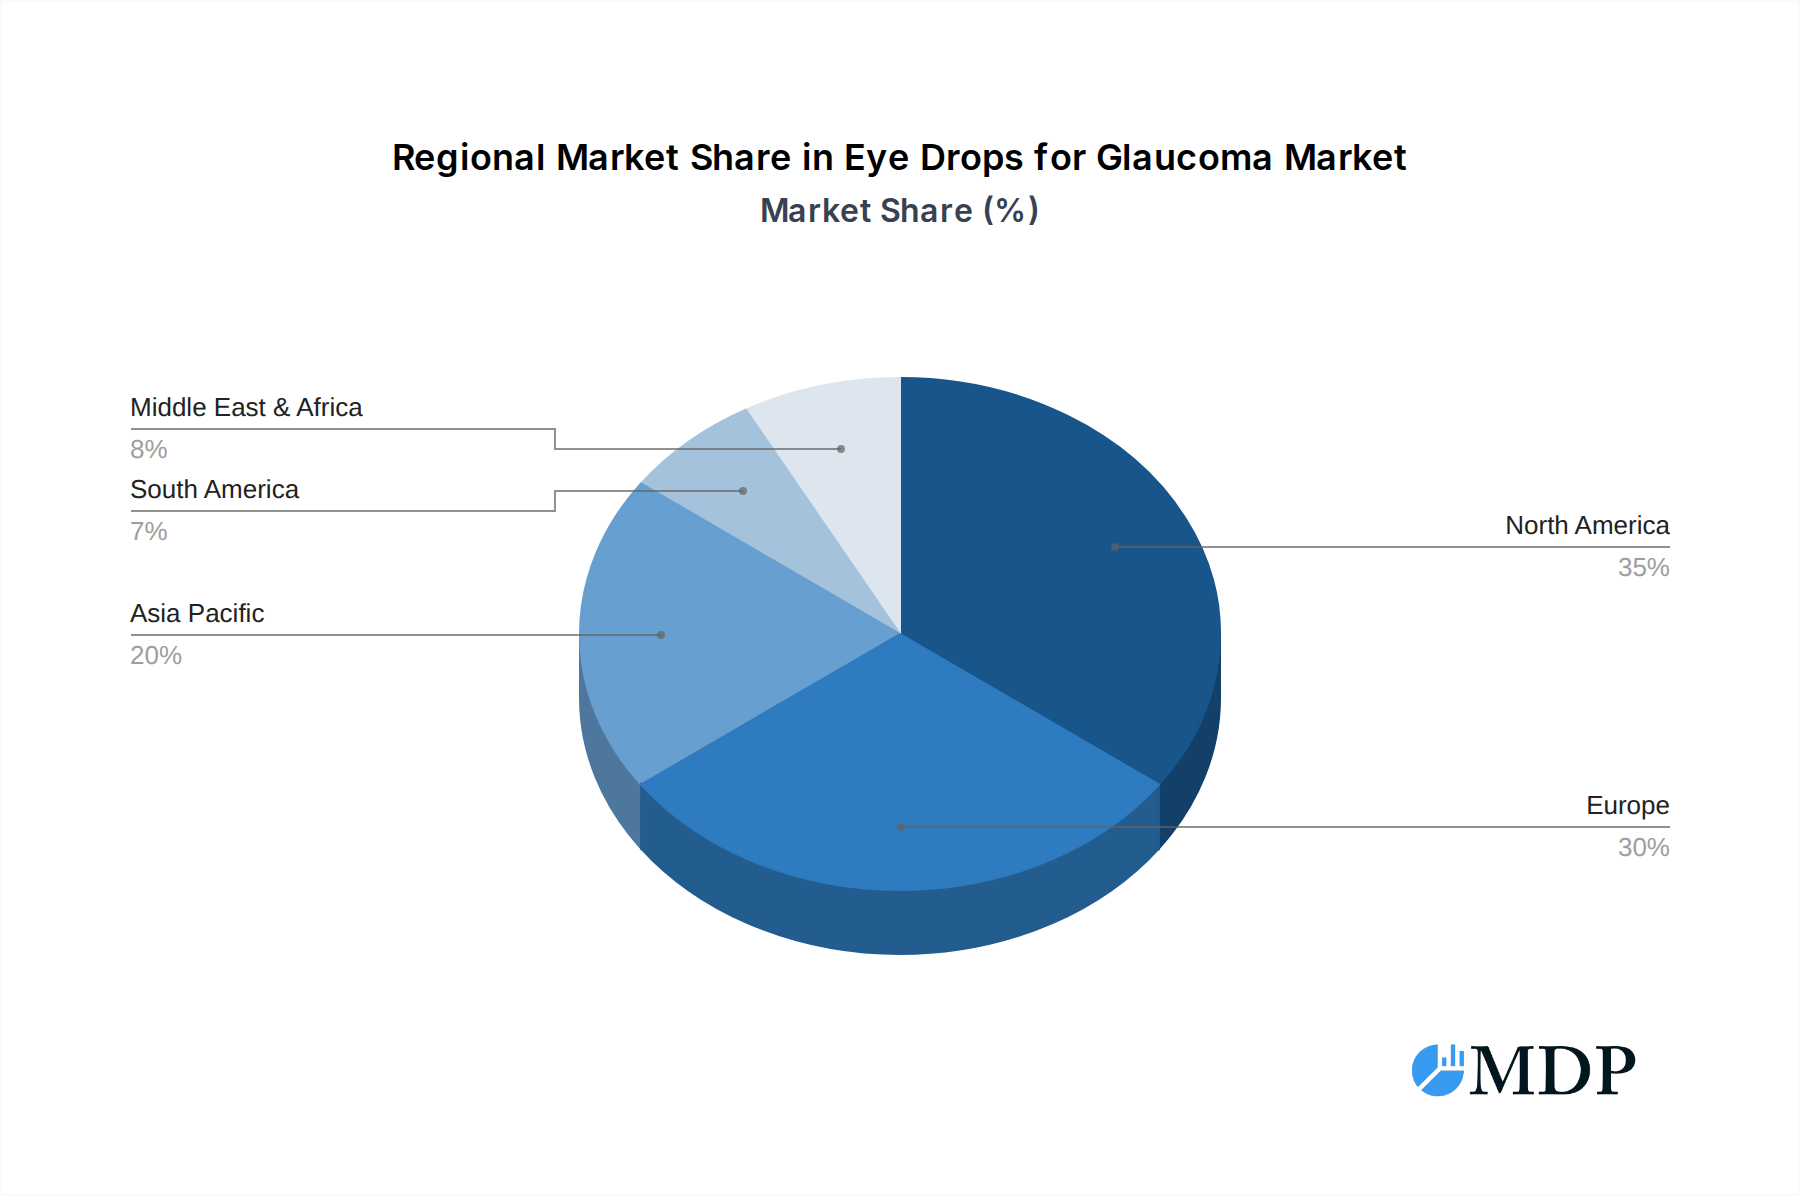
Eye Drops for Glaucoma Regional Market Share
Geographic Coverage of Eye Drops for Glaucoma
Eye Drops for Glaucoma REPORT HIGHLIGHTS
| Aspects | Details |
|---|---|
| Study Period | 2020-2034 |
| Base Year | 2025 |
| Estimated Year | 2026 |
| Forecast Period | 2026-2034 |
| Historical Period | 2020-2025 |
| Growth Rate | CAGR of 6.1% from 2020-2034 |
| Segmentation |
|
Table of Contents
- 1. Introduction
- 1.1. Research Scope
- 1.2. Market Segmentation
- 1.3. Research Methodology
- 1.4. Definitions and Assumptions
- 2. Executive Summary
- 2.1. Introduction
- 3. Market Dynamics
- 3.1. Introduction
- 3.2. Market Drivers
- 3.3. Market Restrains
- 3.4. Market Trends
- 4. Market Factor Analysis
- 4.1. Porters Five Forces
- 4.2. Supply/Value Chain
- 4.3. PESTEL analysis
- 4.4. Market Entropy
- 4.5. Patent/Trademark Analysis
- 5. Global Eye Drops for Glaucoma Analysis, Insights and Forecast, 2020-2032
- 5.1. Market Analysis, Insights and Forecast - by Application
- 5.1.1. Hospital
- 5.1.2. Ophthalmic Clinic
- 5.1.3. Pharmacy
- 5.1.4. Others
- 5.2. Market Analysis, Insights and Forecast - by Types
- 5.2.1. Bimatoprost
- 5.2.2. Latanoprost
- 5.2.3. Tafluprost
- 5.2.4. Travoprost
- 5.3. Market Analysis, Insights and Forecast - by Region
- 5.3.1. North America
- 5.3.2. South America
- 5.3.3. Europe
- 5.3.4. Middle East & Africa
- 5.3.5. Asia Pacific
- 5.1. Market Analysis, Insights and Forecast - by Application
- 6. North America Eye Drops for Glaucoma Analysis, Insights and Forecast, 2020-2032
- 6.1. Market Analysis, Insights and Forecast - by Application
- 6.1.1. Hospital
- 6.1.2. Ophthalmic Clinic
- 6.1.3. Pharmacy
- 6.1.4. Others
- 6.2. Market Analysis, Insights and Forecast - by Types
- 6.2.1. Bimatoprost
- 6.2.2. Latanoprost
- 6.2.3. Tafluprost
- 6.2.4. Travoprost
- 6.1. Market Analysis, Insights and Forecast - by Application
- 7. South America Eye Drops for Glaucoma Analysis, Insights and Forecast, 2020-2032
- 7.1. Market Analysis, Insights and Forecast - by Application
- 7.1.1. Hospital
- 7.1.2. Ophthalmic Clinic
- 7.1.3. Pharmacy
- 7.1.4. Others
- 7.2. Market Analysis, Insights and Forecast - by Types
- 7.2.1. Bimatoprost
- 7.2.2. Latanoprost
- 7.2.3. Tafluprost
- 7.2.4. Travoprost
- 7.1. Market Analysis, Insights and Forecast - by Application
- 8. Europe Eye Drops for Glaucoma Analysis, Insights and Forecast, 2020-2032
- 8.1. Market Analysis, Insights and Forecast - by Application
- 8.1.1. Hospital
- 8.1.2. Ophthalmic Clinic
- 8.1.3. Pharmacy
- 8.1.4. Others
- 8.2. Market Analysis, Insights and Forecast - by Types
- 8.2.1. Bimatoprost
- 8.2.2. Latanoprost
- 8.2.3. Tafluprost
- 8.2.4. Travoprost
- 8.1. Market Analysis, Insights and Forecast - by Application
- 9. Middle East & Africa Eye Drops for Glaucoma Analysis, Insights and Forecast, 2020-2032
- 9.1. Market Analysis, Insights and Forecast - by Application
- 9.1.1. Hospital
- 9.1.2. Ophthalmic Clinic
- 9.1.3. Pharmacy
- 9.1.4. Others
- 9.2. Market Analysis, Insights and Forecast - by Types
- 9.2.1. Bimatoprost
- 9.2.2. Latanoprost
- 9.2.3. Tafluprost
- 9.2.4. Travoprost
- 9.1. Market Analysis, Insights and Forecast - by Application
- 10. Asia Pacific Eye Drops for Glaucoma Analysis, Insights and Forecast, 2020-2032
- 10.1. Market Analysis, Insights and Forecast - by Application
- 10.1.1. Hospital
- 10.1.2. Ophthalmic Clinic
- 10.1.3. Pharmacy
- 10.1.4. Others
- 10.2. Market Analysis, Insights and Forecast - by Types
- 10.2.1. Bimatoprost
- 10.2.2. Latanoprost
- 10.2.3. Tafluprost
- 10.2.4. Travoprost
- 10.1. Market Analysis, Insights and Forecast - by Application
- 11. Competitive Analysis
- 11.1. Global Market Share Analysis 2025
- 11.2. Company Profiles
- 11.2.1 Thea Pharmaceuticals Ltd
- 11.2.1.1. Overview
- 11.2.1.2. Products
- 11.2.1.3. SWOT Analysis
- 11.2.1.4. Recent Developments
- 11.2.1.5. Financials (Based on Availability)
- 11.2.2 FDC International Ltd
- 11.2.2.1. Overview
- 11.2.2.2. Products
- 11.2.2.3. SWOT Analysis
- 11.2.2.4. Recent Developments
- 11.2.2.5. Financials (Based on Availability)
- 11.2.3 Martindale Pharma
- 11.2.3.1. Overview
- 11.2.3.2. Products
- 11.2.3.3. SWOT Analysis
- 11.2.3.4. Recent Developments
- 11.2.3.5. Financials (Based on Availability)
- 11.2.4 Zentiva
- 11.2.4.1. Overview
- 11.2.4.2. Products
- 11.2.4.3. SWOT Analysis
- 11.2.4.4. Recent Developments
- 11.2.4.5. Financials (Based on Availability)
- 11.2.5 Upjohn UK Limited
- 11.2.5.1. Overview
- 11.2.5.2. Products
- 11.2.5.3. SWOT Analysis
- 11.2.5.4. Recent Developments
- 11.2.5.5. Financials (Based on Availability)
- 11.2.6 Beacon Pharmaceuticals
- 11.2.6.1. Overview
- 11.2.6.2. Products
- 11.2.6.3. SWOT Analysis
- 11.2.6.4. Recent Developments
- 11.2.6.5. Financials (Based on Availability)
- 11.2.7 Novartis Pharmaceuticals UK Ltd
- 11.2.7.1. Overview
- 11.2.7.2. Products
- 11.2.7.3. SWOT Analysis
- 11.2.7.4. Recent Developments
- 11.2.7.5. Financials (Based on Availability)
- 11.2.8 Mylan
- 11.2.8.1. Overview
- 11.2.8.2. Products
- 11.2.8.3. SWOT Analysis
- 11.2.8.4. Recent Developments
- 11.2.8.5. Financials (Based on Availability)
- 11.2.9 Accord Healthcare Limited
- 11.2.9.1. Overview
- 11.2.9.2. Products
- 11.2.9.3. SWOT Analysis
- 11.2.9.4. Recent Developments
- 11.2.9.5. Financials (Based on Availability)
- 11.2.10 Sandoz Limited
- 11.2.10.1. Overview
- 11.2.10.2. Products
- 11.2.10.3. SWOT Analysis
- 11.2.10.4. Recent Developments
- 11.2.10.5. Financials (Based on Availability)
- 11.2.11 Thornton & Ross Ltd
- 11.2.11.1. Overview
- 11.2.11.2. Products
- 11.2.11.3. SWOT Analysis
- 11.2.11.4. Recent Developments
- 11.2.11.5. Financials (Based on Availability)
- 11.2.12 Aspire Pharma Ltd
- 11.2.12.1. Overview
- 11.2.12.2. Products
- 11.2.12.3. SWOT Analysis
- 11.2.12.4. Recent Developments
- 11.2.12.5. Financials (Based on Availability)
- 11.2.13 AbbVie Ltd
- 11.2.13.1. Overview
- 11.2.13.2. Products
- 11.2.13.3. SWOT Analysis
- 11.2.13.4. Recent Developments
- 11.2.13.5. Financials (Based on Availability)
- 11.2.1 Thea Pharmaceuticals Ltd
List of Figures
- Figure 1: Global Eye Drops for Glaucoma Revenue Breakdown (undefined, %) by Region 2025 & 2033
- Figure 2: Global Eye Drops for Glaucoma Volume Breakdown (K, %) by Region 2025 & 2033
- Figure 3: North America Eye Drops for Glaucoma Revenue (undefined), by Application 2025 & 2033
- Figure 4: North America Eye Drops for Glaucoma Volume (K), by Application 2025 & 2033
- Figure 5: North America Eye Drops for Glaucoma Revenue Share (%), by Application 2025 & 2033
- Figure 6: North America Eye Drops for Glaucoma Volume Share (%), by Application 2025 & 2033
- Figure 7: North America Eye Drops for Glaucoma Revenue (undefined), by Types 2025 & 2033
- Figure 8: North America Eye Drops for Glaucoma Volume (K), by Types 2025 & 2033
- Figure 9: North America Eye Drops for Glaucoma Revenue Share (%), by Types 2025 & 2033
- Figure 10: North America Eye Drops for Glaucoma Volume Share (%), by Types 2025 & 2033
- Figure 11: North America Eye Drops for Glaucoma Revenue (undefined), by Country 2025 & 2033
- Figure 12: North America Eye Drops for Glaucoma Volume (K), by Country 2025 & 2033
- Figure 13: North America Eye Drops for Glaucoma Revenue Share (%), by Country 2025 & 2033
- Figure 14: North America Eye Drops for Glaucoma Volume Share (%), by Country 2025 & 2033
- Figure 15: South America Eye Drops for Glaucoma Revenue (undefined), by Application 2025 & 2033
- Figure 16: South America Eye Drops for Glaucoma Volume (K), by Application 2025 & 2033
- Figure 17: South America Eye Drops for Glaucoma Revenue Share (%), by Application 2025 & 2033
- Figure 18: South America Eye Drops for Glaucoma Volume Share (%), by Application 2025 & 2033
- Figure 19: South America Eye Drops for Glaucoma Revenue (undefined), by Types 2025 & 2033
- Figure 20: South America Eye Drops for Glaucoma Volume (K), by Types 2025 & 2033
- Figure 21: South America Eye Drops for Glaucoma Revenue Share (%), by Types 2025 & 2033
- Figure 22: South America Eye Drops for Glaucoma Volume Share (%), by Types 2025 & 2033
- Figure 23: South America Eye Drops for Glaucoma Revenue (undefined), by Country 2025 & 2033
- Figure 24: South America Eye Drops for Glaucoma Volume (K), by Country 2025 & 2033
- Figure 25: South America Eye Drops for Glaucoma Revenue Share (%), by Country 2025 & 2033
- Figure 26: South America Eye Drops for Glaucoma Volume Share (%), by Country 2025 & 2033
- Figure 27: Europe Eye Drops for Glaucoma Revenue (undefined), by Application 2025 & 2033
- Figure 28: Europe Eye Drops for Glaucoma Volume (K), by Application 2025 & 2033
- Figure 29: Europe Eye Drops for Glaucoma Revenue Share (%), by Application 2025 & 2033
- Figure 30: Europe Eye Drops for Glaucoma Volume Share (%), by Application 2025 & 2033
- Figure 31: Europe Eye Drops for Glaucoma Revenue (undefined), by Types 2025 & 2033
- Figure 32: Europe Eye Drops for Glaucoma Volume (K), by Types 2025 & 2033
- Figure 33: Europe Eye Drops for Glaucoma Revenue Share (%), by Types 2025 & 2033
- Figure 34: Europe Eye Drops for Glaucoma Volume Share (%), by Types 2025 & 2033
- Figure 35: Europe Eye Drops for Glaucoma Revenue (undefined), by Country 2025 & 2033
- Figure 36: Europe Eye Drops for Glaucoma Volume (K), by Country 2025 & 2033
- Figure 37: Europe Eye Drops for Glaucoma Revenue Share (%), by Country 2025 & 2033
- Figure 38: Europe Eye Drops for Glaucoma Volume Share (%), by Country 2025 & 2033
- Figure 39: Middle East & Africa Eye Drops for Glaucoma Revenue (undefined), by Application 2025 & 2033
- Figure 40: Middle East & Africa Eye Drops for Glaucoma Volume (K), by Application 2025 & 2033
- Figure 41: Middle East & Africa Eye Drops for Glaucoma Revenue Share (%), by Application 2025 & 2033
- Figure 42: Middle East & Africa Eye Drops for Glaucoma Volume Share (%), by Application 2025 & 2033
- Figure 43: Middle East & Africa Eye Drops for Glaucoma Revenue (undefined), by Types 2025 & 2033
- Figure 44: Middle East & Africa Eye Drops for Glaucoma Volume (K), by Types 2025 & 2033
- Figure 45: Middle East & Africa Eye Drops for Glaucoma Revenue Share (%), by Types 2025 & 2033
- Figure 46: Middle East & Africa Eye Drops for Glaucoma Volume Share (%), by Types 2025 & 2033
- Figure 47: Middle East & Africa Eye Drops for Glaucoma Revenue (undefined), by Country 2025 & 2033
- Figure 48: Middle East & Africa Eye Drops for Glaucoma Volume (K), by Country 2025 & 2033
- Figure 49: Middle East & Africa Eye Drops for Glaucoma Revenue Share (%), by Country 2025 & 2033
- Figure 50: Middle East & Africa Eye Drops for Glaucoma Volume Share (%), by Country 2025 & 2033
- Figure 51: Asia Pacific Eye Drops for Glaucoma Revenue (undefined), by Application 2025 & 2033
- Figure 52: Asia Pacific Eye Drops for Glaucoma Volume (K), by Application 2025 & 2033
- Figure 53: Asia Pacific Eye Drops for Glaucoma Revenue Share (%), by Application 2025 & 2033
- Figure 54: Asia Pacific Eye Drops for Glaucoma Volume Share (%), by Application 2025 & 2033
- Figure 55: Asia Pacific Eye Drops for Glaucoma Revenue (undefined), by Types 2025 & 2033
- Figure 56: Asia Pacific Eye Drops for Glaucoma Volume (K), by Types 2025 & 2033
- Figure 57: Asia Pacific Eye Drops for Glaucoma Revenue Share (%), by Types 2025 & 2033
- Figure 58: Asia Pacific Eye Drops for Glaucoma Volume Share (%), by Types 2025 & 2033
- Figure 59: Asia Pacific Eye Drops for Glaucoma Revenue (undefined), by Country 2025 & 2033
- Figure 60: Asia Pacific Eye Drops for Glaucoma Volume (K), by Country 2025 & 2033
- Figure 61: Asia Pacific Eye Drops for Glaucoma Revenue Share (%), by Country 2025 & 2033
- Figure 62: Asia Pacific Eye Drops for Glaucoma Volume Share (%), by Country 2025 & 2033
List of Tables
- Table 1: Global Eye Drops for Glaucoma Revenue undefined Forecast, by Application 2020 & 2033
- Table 2: Global Eye Drops for Glaucoma Volume K Forecast, by Application 2020 & 2033
- Table 3: Global Eye Drops for Glaucoma Revenue undefined Forecast, by Types 2020 & 2033
- Table 4: Global Eye Drops for Glaucoma Volume K Forecast, by Types 2020 & 2033
- Table 5: Global Eye Drops for Glaucoma Revenue undefined Forecast, by Region 2020 & 2033
- Table 6: Global Eye Drops for Glaucoma Volume K Forecast, by Region 2020 & 2033
- Table 7: Global Eye Drops for Glaucoma Revenue undefined Forecast, by Application 2020 & 2033
- Table 8: Global Eye Drops for Glaucoma Volume K Forecast, by Application 2020 & 2033
- Table 9: Global Eye Drops for Glaucoma Revenue undefined Forecast, by Types 2020 & 2033
- Table 10: Global Eye Drops for Glaucoma Volume K Forecast, by Types 2020 & 2033
- Table 11: Global Eye Drops for Glaucoma Revenue undefined Forecast, by Country 2020 & 2033
- Table 12: Global Eye Drops for Glaucoma Volume K Forecast, by Country 2020 & 2033
- Table 13: United States Eye Drops for Glaucoma Revenue (undefined) Forecast, by Application 2020 & 2033
- Table 14: United States Eye Drops for Glaucoma Volume (K) Forecast, by Application 2020 & 2033
- Table 15: Canada Eye Drops for Glaucoma Revenue (undefined) Forecast, by Application 2020 & 2033
- Table 16: Canada Eye Drops for Glaucoma Volume (K) Forecast, by Application 2020 & 2033
- Table 17: Mexico Eye Drops for Glaucoma Revenue (undefined) Forecast, by Application 2020 & 2033
- Table 18: Mexico Eye Drops for Glaucoma Volume (K) Forecast, by Application 2020 & 2033
- Table 19: Global Eye Drops for Glaucoma Revenue undefined Forecast, by Application 2020 & 2033
- Table 20: Global Eye Drops for Glaucoma Volume K Forecast, by Application 2020 & 2033
- Table 21: Global Eye Drops for Glaucoma Revenue undefined Forecast, by Types 2020 & 2033
- Table 22: Global Eye Drops for Glaucoma Volume K Forecast, by Types 2020 & 2033
- Table 23: Global Eye Drops for Glaucoma Revenue undefined Forecast, by Country 2020 & 2033
- Table 24: Global Eye Drops for Glaucoma Volume K Forecast, by Country 2020 & 2033
- Table 25: Brazil Eye Drops for Glaucoma Revenue (undefined) Forecast, by Application 2020 & 2033
- Table 26: Brazil Eye Drops for Glaucoma Volume (K) Forecast, by Application 2020 & 2033
- Table 27: Argentina Eye Drops for Glaucoma Revenue (undefined) Forecast, by Application 2020 & 2033
- Table 28: Argentina Eye Drops for Glaucoma Volume (K) Forecast, by Application 2020 & 2033
- Table 29: Rest of South America Eye Drops for Glaucoma Revenue (undefined) Forecast, by Application 2020 & 2033
- Table 30: Rest of South America Eye Drops for Glaucoma Volume (K) Forecast, by Application 2020 & 2033
- Table 31: Global Eye Drops for Glaucoma Revenue undefined Forecast, by Application 2020 & 2033
- Table 32: Global Eye Drops for Glaucoma Volume K Forecast, by Application 2020 & 2033
- Table 33: Global Eye Drops for Glaucoma Revenue undefined Forecast, by Types 2020 & 2033
- Table 34: Global Eye Drops for Glaucoma Volume K Forecast, by Types 2020 & 2033
- Table 35: Global Eye Drops for Glaucoma Revenue undefined Forecast, by Country 2020 & 2033
- Table 36: Global Eye Drops for Glaucoma Volume K Forecast, by Country 2020 & 2033
- Table 37: United Kingdom Eye Drops for Glaucoma Revenue (undefined) Forecast, by Application 2020 & 2033
- Table 38: United Kingdom Eye Drops for Glaucoma Volume (K) Forecast, by Application 2020 & 2033
- Table 39: Germany Eye Drops for Glaucoma Revenue (undefined) Forecast, by Application 2020 & 2033
- Table 40: Germany Eye Drops for Glaucoma Volume (K) Forecast, by Application 2020 & 2033
- Table 41: France Eye Drops for Glaucoma Revenue (undefined) Forecast, by Application 2020 & 2033
- Table 42: France Eye Drops for Glaucoma Volume (K) Forecast, by Application 2020 & 2033
- Table 43: Italy Eye Drops for Glaucoma Revenue (undefined) Forecast, by Application 2020 & 2033
- Table 44: Italy Eye Drops for Glaucoma Volume (K) Forecast, by Application 2020 & 2033
- Table 45: Spain Eye Drops for Glaucoma Revenue (undefined) Forecast, by Application 2020 & 2033
- Table 46: Spain Eye Drops for Glaucoma Volume (K) Forecast, by Application 2020 & 2033
- Table 47: Russia Eye Drops for Glaucoma Revenue (undefined) Forecast, by Application 2020 & 2033
- Table 48: Russia Eye Drops for Glaucoma Volume (K) Forecast, by Application 2020 & 2033
- Table 49: Benelux Eye Drops for Glaucoma Revenue (undefined) Forecast, by Application 2020 & 2033
- Table 50: Benelux Eye Drops for Glaucoma Volume (K) Forecast, by Application 2020 & 2033
- Table 51: Nordics Eye Drops for Glaucoma Revenue (undefined) Forecast, by Application 2020 & 2033
- Table 52: Nordics Eye Drops for Glaucoma Volume (K) Forecast, by Application 2020 & 2033
- Table 53: Rest of Europe Eye Drops for Glaucoma Revenue (undefined) Forecast, by Application 2020 & 2033
- Table 54: Rest of Europe Eye Drops for Glaucoma Volume (K) Forecast, by Application 2020 & 2033
- Table 55: Global Eye Drops for Glaucoma Revenue undefined Forecast, by Application 2020 & 2033
- Table 56: Global Eye Drops for Glaucoma Volume K Forecast, by Application 2020 & 2033
- Table 57: Global Eye Drops for Glaucoma Revenue undefined Forecast, by Types 2020 & 2033
- Table 58: Global Eye Drops for Glaucoma Volume K Forecast, by Types 2020 & 2033
- Table 59: Global Eye Drops for Glaucoma Revenue undefined Forecast, by Country 2020 & 2033
- Table 60: Global Eye Drops for Glaucoma Volume K Forecast, by Country 2020 & 2033
- Table 61: Turkey Eye Drops for Glaucoma Revenue (undefined) Forecast, by Application 2020 & 2033
- Table 62: Turkey Eye Drops for Glaucoma Volume (K) Forecast, by Application 2020 & 2033
- Table 63: Israel Eye Drops for Glaucoma Revenue (undefined) Forecast, by Application 2020 & 2033
- Table 64: Israel Eye Drops for Glaucoma Volume (K) Forecast, by Application 2020 & 2033
- Table 65: GCC Eye Drops for Glaucoma Revenue (undefined) Forecast, by Application 2020 & 2033
- Table 66: GCC Eye Drops for Glaucoma Volume (K) Forecast, by Application 2020 & 2033
- Table 67: North Africa Eye Drops for Glaucoma Revenue (undefined) Forecast, by Application 2020 & 2033
- Table 68: North Africa Eye Drops for Glaucoma Volume (K) Forecast, by Application 2020 & 2033
- Table 69: South Africa Eye Drops for Glaucoma Revenue (undefined) Forecast, by Application 2020 & 2033
- Table 70: South Africa Eye Drops for Glaucoma Volume (K) Forecast, by Application 2020 & 2033
- Table 71: Rest of Middle East & Africa Eye Drops for Glaucoma Revenue (undefined) Forecast, by Application 2020 & 2033
- Table 72: Rest of Middle East & Africa Eye Drops for Glaucoma Volume (K) Forecast, by Application 2020 & 2033
- Table 73: Global Eye Drops for Glaucoma Revenue undefined Forecast, by Application 2020 & 2033
- Table 74: Global Eye Drops for Glaucoma Volume K Forecast, by Application 2020 & 2033
- Table 75: Global Eye Drops for Glaucoma Revenue undefined Forecast, by Types 2020 & 2033
- Table 76: Global Eye Drops for Glaucoma Volume K Forecast, by Types 2020 & 2033
- Table 77: Global Eye Drops for Glaucoma Revenue undefined Forecast, by Country 2020 & 2033
- Table 78: Global Eye Drops for Glaucoma Volume K Forecast, by Country 2020 & 2033
- Table 79: China Eye Drops for Glaucoma Revenue (undefined) Forecast, by Application 2020 & 2033
- Table 80: China Eye Drops for Glaucoma Volume (K) Forecast, by Application 2020 & 2033
- Table 81: India Eye Drops for Glaucoma Revenue (undefined) Forecast, by Application 2020 & 2033
- Table 82: India Eye Drops for Glaucoma Volume (K) Forecast, by Application 2020 & 2033
- Table 83: Japan Eye Drops for Glaucoma Revenue (undefined) Forecast, by Application 2020 & 2033
- Table 84: Japan Eye Drops for Glaucoma Volume (K) Forecast, by Application 2020 & 2033
- Table 85: South Korea Eye Drops for Glaucoma Revenue (undefined) Forecast, by Application 2020 & 2033
- Table 86: South Korea Eye Drops for Glaucoma Volume (K) Forecast, by Application 2020 & 2033
- Table 87: ASEAN Eye Drops for Glaucoma Revenue (undefined) Forecast, by Application 2020 & 2033
- Table 88: ASEAN Eye Drops for Glaucoma Volume (K) Forecast, by Application 2020 & 2033
- Table 89: Oceania Eye Drops for Glaucoma Revenue (undefined) Forecast, by Application 2020 & 2033
- Table 90: Oceania Eye Drops for Glaucoma Volume (K) Forecast, by Application 2020 & 2033
- Table 91: Rest of Asia Pacific Eye Drops for Glaucoma Revenue (undefined) Forecast, by Application 2020 & 2033
- Table 92: Rest of Asia Pacific Eye Drops for Glaucoma Volume (K) Forecast, by Application 2020 & 2033
Frequently Asked Questions
1. What is the projected Compound Annual Growth Rate (CAGR) of the Eye Drops for Glaucoma?
The projected CAGR is approximately 6.1%.
2. Which companies are prominent players in the Eye Drops for Glaucoma?
Key companies in the market include Thea Pharmaceuticals Ltd, FDC International Ltd, Martindale Pharma, Zentiva, Upjohn UK Limited, Beacon Pharmaceuticals, Novartis Pharmaceuticals UK Ltd, Mylan, Accord Healthcare Limited, Sandoz Limited, Thornton & Ross Ltd, Aspire Pharma Ltd, AbbVie Ltd.
3. What are the main segments of the Eye Drops for Glaucoma?
The market segments include Application, Types.
4. Can you provide details about the market size?
The market size is estimated to be USD XXX N/A as of 2022.
5. What are some drivers contributing to market growth?
N/A
6. What are the notable trends driving market growth?
N/A
7. Are there any restraints impacting market growth?
N/A
8. Can you provide examples of recent developments in the market?
N/A
9. What pricing options are available for accessing the report?
Pricing options include single-user, multi-user, and enterprise licenses priced at USD 3350.00, USD 5025.00, and USD 6700.00 respectively.
10. Is the market size provided in terms of value or volume?
The market size is provided in terms of value, measured in N/A and volume, measured in K.
11. Are there any specific market keywords associated with the report?
Yes, the market keyword associated with the report is "Eye Drops for Glaucoma," which aids in identifying and referencing the specific market segment covered.
12. How do I determine which pricing option suits my needs best?
The pricing options vary based on user requirements and access needs. Individual users may opt for single-user licenses, while businesses requiring broader access may choose multi-user or enterprise licenses for cost-effective access to the report.
13. Are there any additional resources or data provided in the Eye Drops for Glaucoma report?
While the report offers comprehensive insights, it's advisable to review the specific contents or supplementary materials provided to ascertain if additional resources or data are available.
14. How can I stay updated on further developments or reports in the Eye Drops for Glaucoma?
To stay informed about further developments, trends, and reports in the Eye Drops for Glaucoma, consider subscribing to industry newsletters, following relevant companies and organizations, or regularly checking reputable industry news sources and publications.
Methodology
Step 1 - Identification of Relevant Samples Size from Population Database


Step 2 - Approaches for Defining Global Market Size (Value, Volume* & Price*)

Note*: In applicable scenarios
Step 3 - Data Sources
Primary Research
- Web Analytics
- Survey Reports
- Research Institute
- Latest Research Reports
- Opinion Leaders
Secondary Research
- Annual Reports
- White Paper
- Latest Press Release
- Industry Association
- Paid Database
- Investor Presentations

Step 4 - Data Triangulation
Involves using different sources of information in order to increase the validity of a study
These sources are likely to be stakeholders in a program - participants, other researchers, program staff, other community members, and so on.
Then we put all data in single framework & apply various statistical tools to find out the dynamic on the market.
During the analysis stage, feedback from the stakeholder groups would be compared to determine areas of agreement as well as areas of divergence