

Key Insights
The global e-pharmacy market is poised for substantial growth, projected to reach USD 85,190 million by the end of the forecast period. Driven by an impressive CAGR of 8.4%, this expansion is fueled by a confluence of factors that are fundamentally reshaping healthcare access and consumer behavior. The increasing adoption of smartphones and high-speed internet, coupled with a growing consumer preference for convenience and home delivery, are significant catalysts. Furthermore, the rising prevalence of chronic diseases and the aging global population necessitate more accessible and continuous healthcare solutions, which e-pharmacies are well-positioned to provide. The convenience of comparing prices, accessing a wider range of products, and obtaining prescription refills online without the need for physical visits is increasingly appealing to a broad demographic. Regulatory advancements and increased investment in digital health infrastructure are also paving the way for broader market penetration and service diversification.

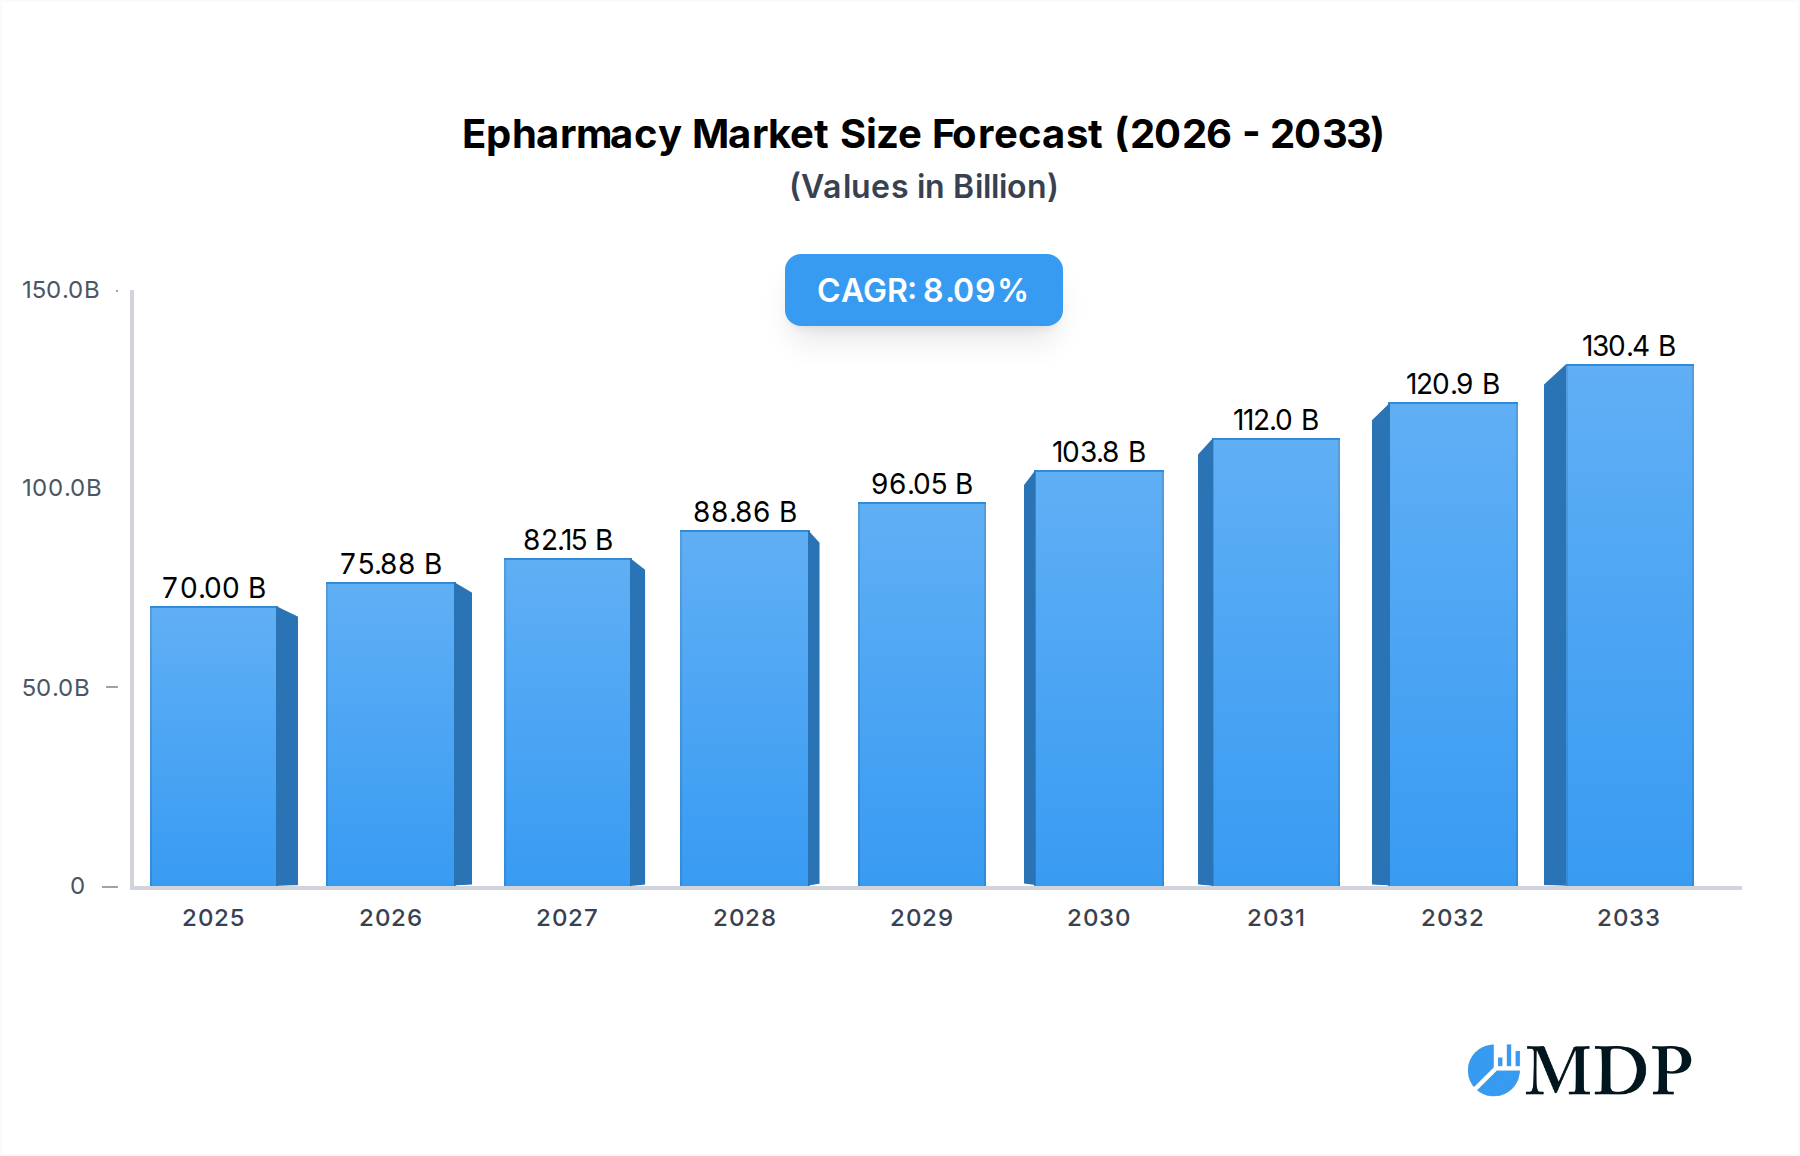
Epharmacy Market Size (In Billion)
The market is segmented into various applications, with Vitamins and Cold and Flu categories demonstrating robust demand due to their over-the-counter nature and frequent consumer need. The Weight Loss segment is also experiencing considerable traction, reflecting growing health consciousness and the demand for discreet purchasing options. In terms of type, both Prescription Drugs and Over the Counter (OTC) Drugs are experiencing healthy growth, with e-pharmacies effectively bridging the gap between traditional healthcare providers and patients. Major players like Walmart Stores, CVS Health, and Express Scripts are making significant investments in their online platforms, enhancing user experience, and expanding their product portfolios. Geographically, North America and Europe currently dominate the market, owing to well-established healthcare systems and high digital penetration. However, the Asia Pacific region, particularly China and India, is emerging as a high-growth market, driven by rapid digitalization and an expanding middle class with increasing disposable incomes and a growing awareness of health and wellness.
Epharmacy Company Market Share
Unveiling the Future of Healthcare: The Comprehensive Epharmacy Market Report
This in-depth report provides a strategic analysis of the global Epharmacy market, projecting its trajectory from 2019 to 2033. With a base year of 2025 and an estimated year of 2025, the report offers critical insights into the forecast period of 2025–2033, building upon the historical period of 2019–2024. Explore millions of dollars in market value and understand the intricate dynamics driving this rapidly evolving sector.
Epharmacy Market Dynamics & Concentration
The global Epharmacy market exhibits a moderate to high level of concentration, with key players like CVS Health, Walgreens, Express Scripts, Optum Rx, and The Kroger holding substantial market share, estimated to be in the hundreds of millions of dollars collectively. Innovation is a significant driver, fueled by advancements in telemedicine, AI-powered diagnostics, and personalized medicine, leading to an estimated hundreds of millions of dollars invested in R&D annually. The regulatory framework, while evolving, presents a complex landscape, with varying compliance requirements across different regions impacting market entry and operations. Product substitutes, primarily traditional brick-and-mortar pharmacies and direct-to-consumer (DTC) health product manufacturers, pose a challenge, though the convenience and accessibility of e-pharmacies are gaining traction. End-user trends indicate a growing preference for home delivery of medications, chronic disease management tools, and a demand for transparent pricing, all contributing to market expansion valued in the hundreds of millions of dollars. Mergers and Acquisitions (M&A) activities, such as potential deals involving Walmart Stores and Giant Eagle, are anticipated to further shape the market landscape, with an estimated tens of millions of dollars in M&A deal counts over the forecast period.
Epharmacy Industry Trends & Analysis
The Epharmacy industry is poised for significant expansion, driven by a robust Compound Annual Growth Rate (CAGR) estimated to be in the high single digits to low double digits, translating into market value projected to reach hundreds of billions of dollars by 2033. Technological disruptions are at the forefront, with the integration of artificial intelligence (AI) for prescription verification and fraud detection, blockchain for supply chain transparency, and advanced data analytics for personalized patient recommendations driving operational efficiency and enhancing customer experience, contributing to an estimated hundreds of millions of dollars in technological investment. Consumer preferences are rapidly shifting towards convenience, accessibility, and cost-effectiveness, with a growing demand for online consultations, prescription refills, and the discreet delivery of medications. This shift is further amplified by an increasing penetration of smartphones and internet connectivity across all demographics, estimated to be in the hundreds of millions of users. Competitive dynamics are intensifying, with established retail giants like Walmart Stores and CVS Health vying for market dominance against specialized online pharmacies like Express Scripts and Optum Rx, and international players like DocMorris (Zur Rose) and Canada Drugs. The market penetration of e-pharmacy services is expected to surge, reaching tens of millions of households globally by the end of the forecast period.
Leading Markets & Segments in Epharmacy
North America currently dominates the global Epharmacy market, with the United States and Canada at the forefront, driven by strong economic policies that support digital health initiatives and a well-established healthcare infrastructure facilitating widespread internet and smartphone adoption. The market size in this region alone is estimated to be in the tens of billions of dollars.
Dominant Segments:
- Type: Prescription Drugs: This segment holds the largest market share, estimated to be in the tens of billions of dollars, due to the inherent need for chronic condition management and the convenience of home delivery for recurring medications. Key drivers include an aging population, increasing prevalence of chronic diseases, and favorable reimbursement policies for telehealth and prescription delivery services.
- Application: Vitamins and Supplements: This segment is experiencing substantial growth, projected to reach billions of dollars, driven by rising health consciousness, a proactive approach to wellness, and the ease of purchasing a wide variety of products online. Increased availability of specialized dietary supplements and personalized nutrition plans further fuels this segment.
- Application: Skin Care: The global skin care segment within e-pharmacy is valued in the billions of dollars, propelled by the accessibility of a wide range of dermatologist-recommended products and innovative skincare solutions. Online consultations with skincare professionals and personalized product recommendations are significant growth catalysts.
- Application: Cold and Flu: While seasonal, this segment remains a consistent contributor, estimated to be in the hundreds of millions of dollars, with the convenience of ordering over-the-counter (OTC) and prescription remedies for immediate relief.
- Type: Over the Counter (OTC) Drugs: This segment, valued in the billions of dollars, benefits from the ease of purchasing everyday health necessities without a prescription, further boosted by promotional offers and bundled deals.
Epharmacy Product Developments
Product innovation in the e-pharmacy sector is characterized by the development of user-friendly mobile applications offering seamless prescription management, telemedicine integration for consultations with healthcare professionals, and advanced inventory management systems for efficient order fulfillment. Key innovations include AI-powered drug interaction checkers, personalized medication reminders, and subscription-based delivery models for chronic care patients. These developments aim to enhance patient adherence, improve health outcomes, and provide a competitive advantage by offering a more integrated and personalized healthcare experience, with an estimated hundreds of millions of dollars invested in these technologies.
Key Drivers of Epharmacy Growth
The Epharmacy market is propelled by several key drivers. Technological advancements, including the widespread adoption of smartphones and high-speed internet, enable greater accessibility and convenience for consumers. The increasing prevalence of chronic diseases and an aging global population create a sustained demand for medications and healthcare services. Furthermore, supportive government initiatives and favorable regulatory frameworks in various regions, promoting telehealth and digital health solutions, are significantly boosting market expansion. The growing emphasis on preventative healthcare and wellness, coupled with the convenience of home delivery, further accelerates growth, creating opportunities valued in the hundreds of billions of dollars.
Challenges in the Epharmacy Market
Despite robust growth, the Epharmacy market faces significant challenges. Stringent regulatory compliance across different jurisdictions can create hurdles for market entry and operational scalability, with potential fines amounting to tens of millions of dollars. Supply chain disruptions, including issues with drug sourcing and last-mile delivery, can impact product availability and lead times. Intense competition from both established brick-and-mortar pharmacies and other online retailers necessitates continuous innovation and competitive pricing strategies, potentially leading to hundreds of millions of dollars in price wars. Ensuring data security and patient privacy is paramount, requiring substantial investments in cybersecurity infrastructure, estimated to be in the hundreds of millions of dollars.
Emerging Opportunities in Epharmacy
Emerging opportunities in the Epharmacy market lie in the continuous integration of telehealth services, offering a holistic approach to patient care. The development of specialized e-pharmacies catering to niche therapeutic areas, such as oncology or rare diseases, presents significant growth potential. Strategic partnerships with wearable technology companies and health tracking apps can create a more personalized and proactive healthcare ecosystem, valued in the billions of dollars. Furthermore, expansion into emerging economies with rapidly growing internet penetration and healthcare needs offers substantial untapped market potential, driving global revenue in the tens of billions of dollars.
Leading Players in the Epharmacy Sector
- CVS Health
- The Kroger
- Walmart Stores
- Express Scripts
- Optum Rx
- Walgreens
- Giant Eagle
- Sanicare
- Rowlands Pharmacy
- Secure Medical
- DocMorris (Zur Rose)
- PlanetRx
- eDrugstore.com
- drugstore.com
- Canada Drugs
- Lloyds Pharmacy
- Medisave
Key Milestones in Epharmacy Industry
- 2019: Increased adoption of subscription-based models for chronic medication delivery.
- 2020: Surge in demand for e-pharmacy services due to the global pandemic, leading to an estimated tens of millions of new users.
- 2021: Enhanced integration of AI and machine learning for prescription verification and fraud detection.
- 2022: Introduction of blockchain technology for improved pharmaceutical supply chain transparency.
- 2023: Growing investment in direct-to-consumer (DTC) marketing by e-pharmacy players, reaching hundreds of millions of dollars.
- 2024: Expansion of telehealth services to include remote patient monitoring and chronic disease management programs.
Strategic Outlook for Epharmacy Market
The strategic outlook for the Epharmacy market is exceptionally positive, driven by continued technological innovation and a growing global acceptance of digital healthcare solutions. Key growth accelerators include the expansion of personalized medicine, the seamless integration of e-pharmacies with broader healthcare ecosystems, and strategic M&A activities to consolidate market share and expand service offerings. The focus will increasingly shift towards value-based care models, where e-pharmacies play a crucial role in improving patient outcomes and reducing healthcare costs, projecting a market expansion valued in the hundreds of billions of dollars.
Epharmacy Segmentation
-
1. Application
- 1.1. Dental
- 1.2. Skin Care
- 1.3. Vitamins
- 1.4. Cold and Flu
- 1.5. Weight Loss
- 1.6. Others
-
2. Type
- 2.1. Prescription Drugs
- 2.2. Over the Counter (OTC) Drugs
Epharmacy Segmentation By Geography
-
1. North America
- 1.1. United States
- 1.2. Canada
- 1.3. Mexico
-
2. South America
- 2.1. Brazil
- 2.2. Argentina
- 2.3. Rest of South America
-
3. Europe
- 3.1. United Kingdom
- 3.2. Germany
- 3.3. France
- 3.4. Italy
- 3.5. Spain
- 3.6. Russia
- 3.7. Benelux
- 3.8. Nordics
- 3.9. Rest of Europe
-
4. Middle East & Africa
- 4.1. Turkey
- 4.2. Israel
- 4.3. GCC
- 4.4. North Africa
- 4.5. South Africa
- 4.6. Rest of Middle East & Africa
-
5. Asia Pacific
- 5.1. China
- 5.2. India
- 5.3. Japan
- 5.4. South Korea
- 5.5. ASEAN
- 5.6. Oceania
- 5.7. Rest of Asia Pacific

Epharmacy Regional Market Share
Geographic Coverage of Epharmacy
Epharmacy REPORT HIGHLIGHTS
| Aspects | Details |
|---|---|
| Study Period | 2020-2034 |
| Base Year | 2025 |
| Estimated Year | 2026 |
| Forecast Period | 2026-2034 |
| Historical Period | 2020-2025 |
| Growth Rate | CAGR of 8.4% from 2020-2034 |
| Segmentation |
|
Table of Contents
- 1. Introduction
- 1.1. Research Scope
- 1.2. Market Segmentation
- 1.3. Research Methodology
- 1.4. Definitions and Assumptions
- 2. Executive Summary
- 2.1. Introduction
- 3. Market Dynamics
- 3.1. Introduction
- 3.2. Market Drivers
- 3.3. Market Restrains
- 3.4. Market Trends
- 4. Market Factor Analysis
- 4.1. Porters Five Forces
- 4.2. Supply/Value Chain
- 4.3. PESTEL analysis
- 4.4. Market Entropy
- 4.5. Patent/Trademark Analysis
- 5. Global Epharmacy Analysis, Insights and Forecast, 2020-2032
- 5.1. Market Analysis, Insights and Forecast - by Application
- 5.1.1. Dental
- 5.1.2. Skin Care
- 5.1.3. Vitamins
- 5.1.4. Cold and Flu
- 5.1.5. Weight Loss
- 5.1.6. Others
- 5.2. Market Analysis, Insights and Forecast - by Type
- 5.2.1. Prescription Drugs
- 5.2.2. Over the Counter (OTC) Drugs
- 5.3. Market Analysis, Insights and Forecast - by Region
- 5.3.1. North America
- 5.3.2. South America
- 5.3.3. Europe
- 5.3.4. Middle East & Africa
- 5.3.5. Asia Pacific
- 5.1. Market Analysis, Insights and Forecast - by Application
- 6. North America Epharmacy Analysis, Insights and Forecast, 2020-2032
- 6.1. Market Analysis, Insights and Forecast - by Application
- 6.1.1. Dental
- 6.1.2. Skin Care
- 6.1.3. Vitamins
- 6.1.4. Cold and Flu
- 6.1.5. Weight Loss
- 6.1.6. Others
- 6.2. Market Analysis, Insights and Forecast - by Type
- 6.2.1. Prescription Drugs
- 6.2.2. Over the Counter (OTC) Drugs
- 6.1. Market Analysis, Insights and Forecast - by Application
- 7. South America Epharmacy Analysis, Insights and Forecast, 2020-2032
- 7.1. Market Analysis, Insights and Forecast - by Application
- 7.1.1. Dental
- 7.1.2. Skin Care
- 7.1.3. Vitamins
- 7.1.4. Cold and Flu
- 7.1.5. Weight Loss
- 7.1.6. Others
- 7.2. Market Analysis, Insights and Forecast - by Type
- 7.2.1. Prescription Drugs
- 7.2.2. Over the Counter (OTC) Drugs
- 7.1. Market Analysis, Insights and Forecast - by Application
- 8. Europe Epharmacy Analysis, Insights and Forecast, 2020-2032
- 8.1. Market Analysis, Insights and Forecast - by Application
- 8.1.1. Dental
- 8.1.2. Skin Care
- 8.1.3. Vitamins
- 8.1.4. Cold and Flu
- 8.1.5. Weight Loss
- 8.1.6. Others
- 8.2. Market Analysis, Insights and Forecast - by Type
- 8.2.1. Prescription Drugs
- 8.2.2. Over the Counter (OTC) Drugs
- 8.1. Market Analysis, Insights and Forecast - by Application
- 9. Middle East & Africa Epharmacy Analysis, Insights and Forecast, 2020-2032
- 9.1. Market Analysis, Insights and Forecast - by Application
- 9.1.1. Dental
- 9.1.2. Skin Care
- 9.1.3. Vitamins
- 9.1.4. Cold and Flu
- 9.1.5. Weight Loss
- 9.1.6. Others
- 9.2. Market Analysis, Insights and Forecast - by Type
- 9.2.1. Prescription Drugs
- 9.2.2. Over the Counter (OTC) Drugs
- 9.1. Market Analysis, Insights and Forecast - by Application
- 10. Asia Pacific Epharmacy Analysis, Insights and Forecast, 2020-2032
- 10.1. Market Analysis, Insights and Forecast - by Application
- 10.1.1. Dental
- 10.1.2. Skin Care
- 10.1.3. Vitamins
- 10.1.4. Cold and Flu
- 10.1.5. Weight Loss
- 10.1.6. Others
- 10.2. Market Analysis, Insights and Forecast - by Type
- 10.2.1. Prescription Drugs
- 10.2.2. Over the Counter (OTC) Drugs
- 10.1. Market Analysis, Insights and Forecast - by Application
- 11. Competitive Analysis
- 11.1. Global Market Share Analysis 2025
- 11.2. Company Profiles
- 11.2.1 The Kroger
- 11.2.1.1. Overview
- 11.2.1.2. Products
- 11.2.1.3. SWOT Analysis
- 11.2.1.4. Recent Developments
- 11.2.1.5. Financials (Based on Availability)
- 11.2.2 Giant Eagle
- 11.2.2.1. Overview
- 11.2.2.2. Products
- 11.2.2.3. SWOT Analysis
- 11.2.2.4. Recent Developments
- 11.2.2.5. Financials (Based on Availability)
- 11.2.3 Walgreen
- 11.2.3.1. Overview
- 11.2.3.2. Products
- 11.2.3.3. SWOT Analysis
- 11.2.3.4. Recent Developments
- 11.2.3.5. Financials (Based on Availability)
- 11.2.4 Express Scripts
- 11.2.4.1. Overview
- 11.2.4.2. Products
- 11.2.4.3. SWOT Analysis
- 11.2.4.4. Recent Developments
- 11.2.4.5. Financials (Based on Availability)
- 11.2.5 Medisave
- 11.2.5.1. Overview
- 11.2.5.2. Products
- 11.2.5.3. SWOT Analysis
- 11.2.5.4. Recent Developments
- 11.2.5.5. Financials (Based on Availability)
- 11.2.6 Walmart Stores
- 11.2.6.1. Overview
- 11.2.6.2. Products
- 11.2.6.3. SWOT Analysis
- 11.2.6.4. Recent Developments
- 11.2.6.5. Financials (Based on Availability)
- 11.2.7 CVS Health
- 11.2.7.1. Overview
- 11.2.7.2. Products
- 11.2.7.3. SWOT Analysis
- 11.2.7.4. Recent Developments
- 11.2.7.5. Financials (Based on Availability)
- 11.2.8 Sanicare
- 11.2.8.1. Overview
- 11.2.8.2. Products
- 11.2.8.3. SWOT Analysis
- 11.2.8.4. Recent Developments
- 11.2.8.5. Financials (Based on Availability)
- 11.2.9 Rowlands Pharmacy
- 11.2.9.1. Overview
- 11.2.9.2. Products
- 11.2.9.3. SWOT Analysis
- 11.2.9.4. Recent Developments
- 11.2.9.5. Financials (Based on Availability)
- 11.2.10 Secure Medical
- 11.2.10.1. Overview
- 11.2.10.2. Products
- 11.2.10.3. SWOT Analysis
- 11.2.10.4. Recent Developments
- 11.2.10.5. Financials (Based on Availability)
- 11.2.11 Optum Rx
- 11.2.11.1. Overview
- 11.2.11.2. Products
- 11.2.11.3. SWOT Analysis
- 11.2.11.4. Recent Developments
- 11.2.11.5. Financials (Based on Availability)
- 11.2.12 DocMorris (Zur Rose)
- 11.2.12.1. Overview
- 11.2.12.2. Products
- 11.2.12.3. SWOT Analysis
- 11.2.12.4. Recent Developments
- 11.2.12.5. Financials (Based on Availability)
- 11.2.13 PlanetRx
- 11.2.13.1. Overview
- 11.2.13.2. Products
- 11.2.13.3. SWOT Analysis
- 11.2.13.4. Recent Developments
- 11.2.13.5. Financials (Based on Availability)
- 11.2.14 eDrugstore.com
- 11.2.14.1. Overview
- 11.2.14.2. Products
- 11.2.14.3. SWOT Analysis
- 11.2.14.4. Recent Developments
- 11.2.14.5. Financials (Based on Availability)
- 11.2.15 drugstore.com
- 11.2.15.1. Overview
- 11.2.15.2. Products
- 11.2.15.3. SWOT Analysis
- 11.2.15.4. Recent Developments
- 11.2.15.5. Financials (Based on Availability)
- 11.2.16 Canada Drugs
- 11.2.16.1. Overview
- 11.2.16.2. Products
- 11.2.16.3. SWOT Analysis
- 11.2.16.4. Recent Developments
- 11.2.16.5. Financials (Based on Availability)
- 11.2.17 Lloyds Pharmacy
- 11.2.17.1. Overview
- 11.2.17.2. Products
- 11.2.17.3. SWOT Analysis
- 11.2.17.4. Recent Developments
- 11.2.17.5. Financials (Based on Availability)
- 11.2.1 The Kroger
List of Figures
- Figure 1: Global Epharmacy Revenue Breakdown (million, %) by Region 2025 & 2033
- Figure 2: North America Epharmacy Revenue (million), by Application 2025 & 2033
- Figure 3: North America Epharmacy Revenue Share (%), by Application 2025 & 2033
- Figure 4: North America Epharmacy Revenue (million), by Type 2025 & 2033
- Figure 5: North America Epharmacy Revenue Share (%), by Type 2025 & 2033
- Figure 6: North America Epharmacy Revenue (million), by Country 2025 & 2033
- Figure 7: North America Epharmacy Revenue Share (%), by Country 2025 & 2033
- Figure 8: South America Epharmacy Revenue (million), by Application 2025 & 2033
- Figure 9: South America Epharmacy Revenue Share (%), by Application 2025 & 2033
- Figure 10: South America Epharmacy Revenue (million), by Type 2025 & 2033
- Figure 11: South America Epharmacy Revenue Share (%), by Type 2025 & 2033
- Figure 12: South America Epharmacy Revenue (million), by Country 2025 & 2033
- Figure 13: South America Epharmacy Revenue Share (%), by Country 2025 & 2033
- Figure 14: Europe Epharmacy Revenue (million), by Application 2025 & 2033
- Figure 15: Europe Epharmacy Revenue Share (%), by Application 2025 & 2033
- Figure 16: Europe Epharmacy Revenue (million), by Type 2025 & 2033
- Figure 17: Europe Epharmacy Revenue Share (%), by Type 2025 & 2033
- Figure 18: Europe Epharmacy Revenue (million), by Country 2025 & 2033
- Figure 19: Europe Epharmacy Revenue Share (%), by Country 2025 & 2033
- Figure 20: Middle East & Africa Epharmacy Revenue (million), by Application 2025 & 2033
- Figure 21: Middle East & Africa Epharmacy Revenue Share (%), by Application 2025 & 2033
- Figure 22: Middle East & Africa Epharmacy Revenue (million), by Type 2025 & 2033
- Figure 23: Middle East & Africa Epharmacy Revenue Share (%), by Type 2025 & 2033
- Figure 24: Middle East & Africa Epharmacy Revenue (million), by Country 2025 & 2033
- Figure 25: Middle East & Africa Epharmacy Revenue Share (%), by Country 2025 & 2033
- Figure 26: Asia Pacific Epharmacy Revenue (million), by Application 2025 & 2033
- Figure 27: Asia Pacific Epharmacy Revenue Share (%), by Application 2025 & 2033
- Figure 28: Asia Pacific Epharmacy Revenue (million), by Type 2025 & 2033
- Figure 29: Asia Pacific Epharmacy Revenue Share (%), by Type 2025 & 2033
- Figure 30: Asia Pacific Epharmacy Revenue (million), by Country 2025 & 2033
- Figure 31: Asia Pacific Epharmacy Revenue Share (%), by Country 2025 & 2033
List of Tables
- Table 1: Global Epharmacy Revenue million Forecast, by Application 2020 & 2033
- Table 2: Global Epharmacy Revenue million Forecast, by Type 2020 & 2033
- Table 3: Global Epharmacy Revenue million Forecast, by Region 2020 & 2033
- Table 4: Global Epharmacy Revenue million Forecast, by Application 2020 & 2033
- Table 5: Global Epharmacy Revenue million Forecast, by Type 2020 & 2033
- Table 6: Global Epharmacy Revenue million Forecast, by Country 2020 & 2033
- Table 7: United States Epharmacy Revenue (million) Forecast, by Application 2020 & 2033
- Table 8: Canada Epharmacy Revenue (million) Forecast, by Application 2020 & 2033
- Table 9: Mexico Epharmacy Revenue (million) Forecast, by Application 2020 & 2033
- Table 10: Global Epharmacy Revenue million Forecast, by Application 2020 & 2033
- Table 11: Global Epharmacy Revenue million Forecast, by Type 2020 & 2033
- Table 12: Global Epharmacy Revenue million Forecast, by Country 2020 & 2033
- Table 13: Brazil Epharmacy Revenue (million) Forecast, by Application 2020 & 2033
- Table 14: Argentina Epharmacy Revenue (million) Forecast, by Application 2020 & 2033
- Table 15: Rest of South America Epharmacy Revenue (million) Forecast, by Application 2020 & 2033
- Table 16: Global Epharmacy Revenue million Forecast, by Application 2020 & 2033
- Table 17: Global Epharmacy Revenue million Forecast, by Type 2020 & 2033
- Table 18: Global Epharmacy Revenue million Forecast, by Country 2020 & 2033
- Table 19: United Kingdom Epharmacy Revenue (million) Forecast, by Application 2020 & 2033
- Table 20: Germany Epharmacy Revenue (million) Forecast, by Application 2020 & 2033
- Table 21: France Epharmacy Revenue (million) Forecast, by Application 2020 & 2033
- Table 22: Italy Epharmacy Revenue (million) Forecast, by Application 2020 & 2033
- Table 23: Spain Epharmacy Revenue (million) Forecast, by Application 2020 & 2033
- Table 24: Russia Epharmacy Revenue (million) Forecast, by Application 2020 & 2033
- Table 25: Benelux Epharmacy Revenue (million) Forecast, by Application 2020 & 2033
- Table 26: Nordics Epharmacy Revenue (million) Forecast, by Application 2020 & 2033
- Table 27: Rest of Europe Epharmacy Revenue (million) Forecast, by Application 2020 & 2033
- Table 28: Global Epharmacy Revenue million Forecast, by Application 2020 & 2033
- Table 29: Global Epharmacy Revenue million Forecast, by Type 2020 & 2033
- Table 30: Global Epharmacy Revenue million Forecast, by Country 2020 & 2033
- Table 31: Turkey Epharmacy Revenue (million) Forecast, by Application 2020 & 2033
- Table 32: Israel Epharmacy Revenue (million) Forecast, by Application 2020 & 2033
- Table 33: GCC Epharmacy Revenue (million) Forecast, by Application 2020 & 2033
- Table 34: North Africa Epharmacy Revenue (million) Forecast, by Application 2020 & 2033
- Table 35: South Africa Epharmacy Revenue (million) Forecast, by Application 2020 & 2033
- Table 36: Rest of Middle East & Africa Epharmacy Revenue (million) Forecast, by Application 2020 & 2033
- Table 37: Global Epharmacy Revenue million Forecast, by Application 2020 & 2033
- Table 38: Global Epharmacy Revenue million Forecast, by Type 2020 & 2033
- Table 39: Global Epharmacy Revenue million Forecast, by Country 2020 & 2033
- Table 40: China Epharmacy Revenue (million) Forecast, by Application 2020 & 2033
- Table 41: India Epharmacy Revenue (million) Forecast, by Application 2020 & 2033
- Table 42: Japan Epharmacy Revenue (million) Forecast, by Application 2020 & 2033
- Table 43: South Korea Epharmacy Revenue (million) Forecast, by Application 2020 & 2033
- Table 44: ASEAN Epharmacy Revenue (million) Forecast, by Application 2020 & 2033
- Table 45: Oceania Epharmacy Revenue (million) Forecast, by Application 2020 & 2033
- Table 46: Rest of Asia Pacific Epharmacy Revenue (million) Forecast, by Application 2020 & 2033
Frequently Asked Questions
1. What is the projected Compound Annual Growth Rate (CAGR) of the Epharmacy?
The projected CAGR is approximately 8.4%.
2. Which companies are prominent players in the Epharmacy?
Key companies in the market include The Kroger, Giant Eagle, Walgreen, Express Scripts, Medisave, Walmart Stores, CVS Health, Sanicare, Rowlands Pharmacy, Secure Medical, Optum Rx, DocMorris (Zur Rose), PlanetRx, eDrugstore.com, drugstore.com, Canada Drugs, Lloyds Pharmacy.
3. What are the main segments of the Epharmacy?
The market segments include Application, Type.
4. Can you provide details about the market size?
The market size is estimated to be USD 85190 million as of 2022.
5. What are some drivers contributing to market growth?
N/A
6. What are the notable trends driving market growth?
N/A
7. Are there any restraints impacting market growth?
N/A
8. Can you provide examples of recent developments in the market?
N/A
9. What pricing options are available for accessing the report?
Pricing options include single-user, multi-user, and enterprise licenses priced at USD 3950.00, USD 5925.00, and USD 7900.00 respectively.
10. Is the market size provided in terms of value or volume?
The market size is provided in terms of value, measured in million.
11. Are there any specific market keywords associated with the report?
Yes, the market keyword associated with the report is "Epharmacy," which aids in identifying and referencing the specific market segment covered.
12. How do I determine which pricing option suits my needs best?
The pricing options vary based on user requirements and access needs. Individual users may opt for single-user licenses, while businesses requiring broader access may choose multi-user or enterprise licenses for cost-effective access to the report.
13. Are there any additional resources or data provided in the Epharmacy report?
While the report offers comprehensive insights, it's advisable to review the specific contents or supplementary materials provided to ascertain if additional resources or data are available.
14. How can I stay updated on further developments or reports in the Epharmacy?
To stay informed about further developments, trends, and reports in the Epharmacy, consider subscribing to industry newsletters, following relevant companies and organizations, or regularly checking reputable industry news sources and publications.
Methodology
Step 1 - Identification of Relevant Samples Size from Population Database


Step 2 - Approaches for Defining Global Market Size (Value, Volume* & Price*)

Note*: In applicable scenarios
Step 3 - Data Sources
Primary Research
- Web Analytics
- Survey Reports
- Research Institute
- Latest Research Reports
- Opinion Leaders
Secondary Research
- Annual Reports
- White Paper
- Latest Press Release
- Industry Association
- Paid Database
- Investor Presentations

Step 4 - Data Triangulation
Involves using different sources of information in order to increase the validity of a study
These sources are likely to be stakeholders in a program - participants, other researchers, program staff, other community members, and so on.
Then we put all data in single framework & apply various statistical tools to find out the dynamic on the market.
During the analysis stage, feedback from the stakeholder groups would be compared to determine areas of agreement as well as areas of divergence