

Key Insights
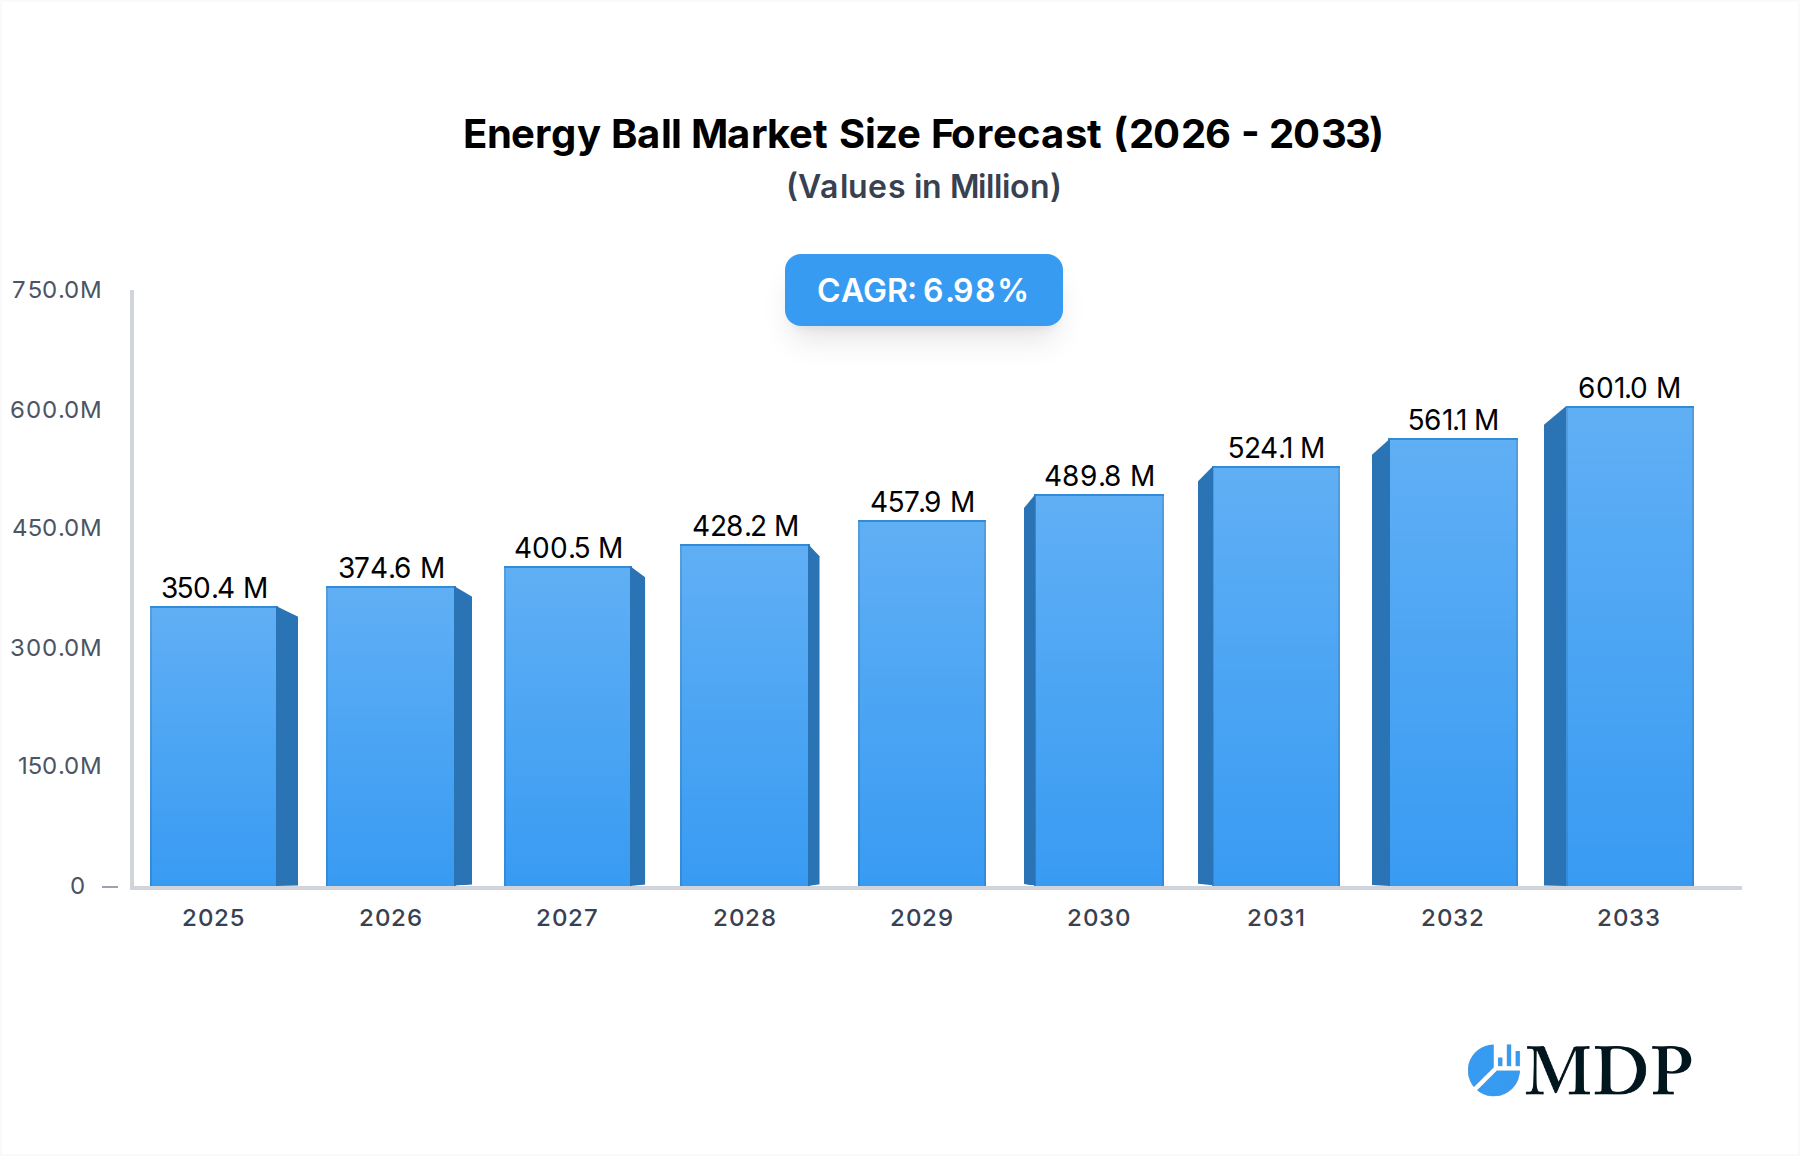
The global Energy Ball market is poised for significant expansion, projected to reach $350.4 million in 2025 and grow at a robust Compound Annual Growth Rate (CAGR) of 6.9% through 2033. This upward trajectory is fueled by a growing consumer consciousness around health and wellness, driving demand for convenient and nutritious snack alternatives. The "on-the-go" lifestyle prevalent in developed and developing economies further bolsters the market, as energy balls offer a portable and quick source of sustained energy. Key drivers include increasing awareness of the benefits of natural ingredients, the rising popularity of plant-based diets, and the perceived health advantages over conventional processed snacks. The retail segment is expected to remain a dominant force, while the online sales channel is experiencing rapid growth due to convenience and wider product availability. The organic segment, in particular, is witnessing accelerated adoption as consumers actively seek out products free from artificial additives and pesticides.

Energy Ball Market Size (In Million)
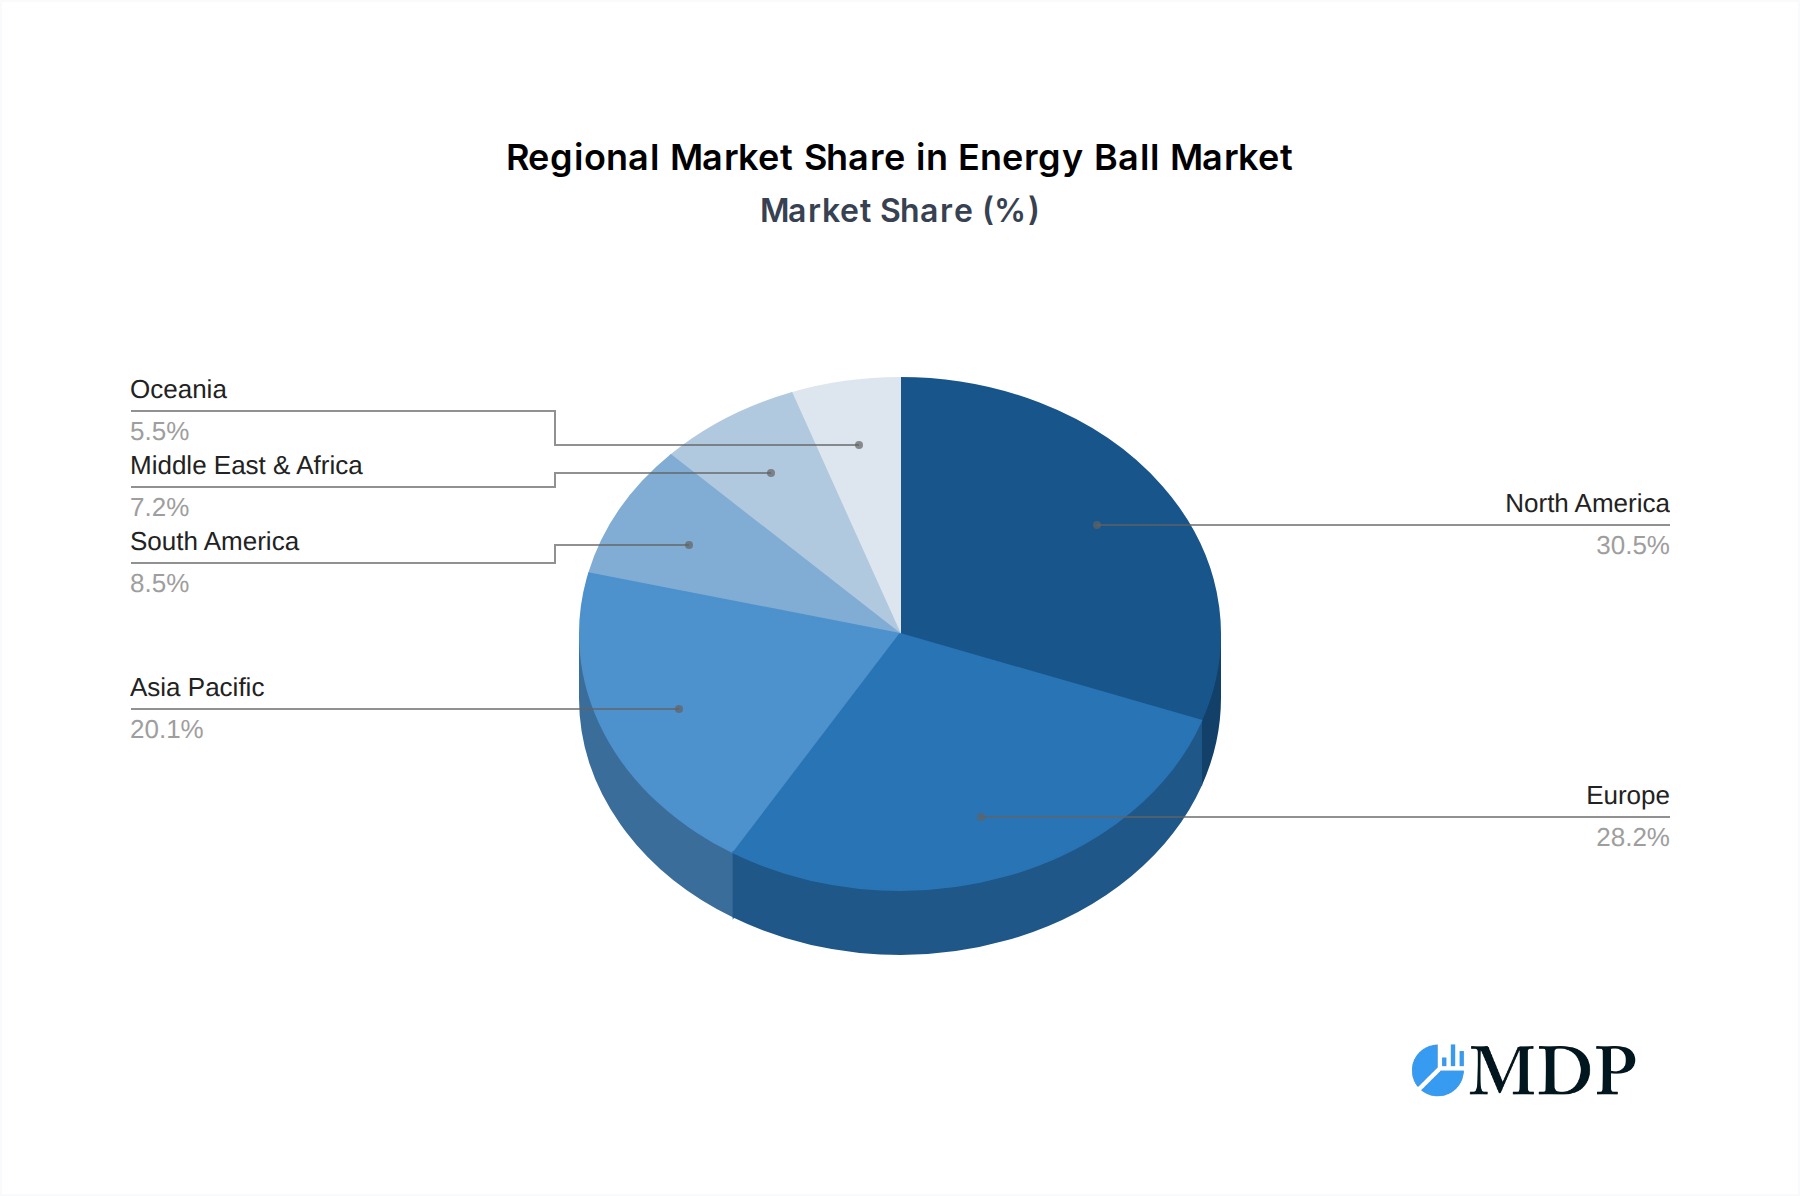
Geographically, North America and Europe are anticipated to lead the market in terms of size and growth, owing to established health trends and higher disposable incomes. However, the Asia Pacific region presents a substantial opportunity for future expansion, driven by a burgeoning middle class, increasing urbanization, and a growing adoption of Western dietary habits. Challenges such as fluctuating raw material prices and the presence of numerous small-scale players can create competitive pressures. Nevertheless, continuous innovation in product formulations, flavors, and packaging, alongside strategic partnerships and expanding distribution networks, will be crucial for companies to capitalize on the immense potential within the energy ball market. The market's evolution will likely see a greater emphasis on functional ingredients and personalized nutrition, catering to specific dietary needs and performance enhancements.
Energy Ball Company Market Share
Energy Ball Market Report: Growth, Trends, and Future Outlook (2019-2033)
This comprehensive energy ball market report delves into the dynamic landscape of the global energy ball industry, providing in-depth analysis and actionable insights for industry stakeholders. Covering the study period 2019–2033, with a base year of 2025 and an estimated year of 2025, this report meticulously examines historical data from 2019–2024 and forecasts future growth through 2025–2033. We explore key segments, leading markets, product innovations, and the strategic imperatives for success in this rapidly evolving sector. Discover how factors such as the rising demand for organic energy balls, the proliferation of online sales channels, and evolving retail strategies are shaping the future of this billion-dollar industry.
Energy Ball Market Dynamics & Concentration
The energy ball market exhibits a dynamic interplay of growth drivers and competitive forces. Market concentration is currently estimated at a moderate level, with a few key players holding substantial market share. Innovation continues to be a significant driver, fueled by consumer demand for healthier, convenient, and plant-based snack options. Regulatory frameworks, particularly concerning food labeling and nutritional claims, play a crucial role in shaping product development and market access. Product substitutes, including other healthy snack bars, fruits, and nuts, present a constant competitive challenge, necessitating continuous product differentiation. End-user trends lean heavily towards health-conscious consumers seeking portable, nutrient-dense snacks for on-the-go consumption and post-workout recovery. Merger and acquisition (M&A) activities are projected to increase, with an estimated xx M&A deals expected over the forecast period, as larger companies seek to expand their portfolio and smaller innovators aim for wider distribution. The market share distribution highlights a dynamic competitive landscape, with established brands and emerging players vying for consumer attention.
Energy Ball Industry Trends & Analysis
The energy ball industry is experiencing robust growth, driven by a confluence of factors that are reshaping consumer snacking habits and food preferences. The Compound Annual Growth Rate (CAGR) is projected to be xx%, indicating a strong upward trajectory. This expansion is largely attributable to increasing consumer awareness regarding the health benefits associated with natural ingredients and the demand for functional foods that offer sustained energy release. Technological disruptions are playing a pivotal role, particularly in ingredient sourcing, processing, and packaging, enabling the development of more innovative and appealing energy ball formulations. Consumer preferences are increasingly shifting towards clean labels, with a strong preference for organic and non-GMO ingredients. The convenience factor of energy balls as a portable and quick snack solution further propels their popularity across various demographics, including athletes, busy professionals, and health-conscious individuals. The competitive dynamics within the market are intense, characterized by both established food manufacturers and nimble startups introducing novel flavors and functional benefits. Market penetration is steadily increasing across developed and emerging economies, as distribution networks expand and consumer education around the benefits of energy balls grows. The overall market is poised for significant expansion, with projections indicating a total market value reaching several million by the end of the forecast period.
Leading Markets & Segments in Energy Ball
The energy ball market showcases dominant performance in the Retail application segment, accounting for an estimated xx% of total sales. This dominance is driven by widespread availability in supermarkets, convenience stores, and specialty health food outlets. The Online Sale segment, while growing at a faster pace with an estimated CAGR of xx%, is currently a significant but secondary channel, representing approximately xx% of the market. This channel's growth is fueled by the convenience of e-commerce and the ability of online retailers to offer a wider selection of products and direct-to-consumer subscriptions.
Within product types, Organic energy balls are leading the charge, capturing an estimated xx% of the market. This segment's growth is propelled by increasing consumer demand for natural, sustainably sourced, and chemical-free food options. The Conventional energy ball segment, while still substantial, holds an estimated xx% market share and is witnessing slower growth as consumer preferences lean towards healthier alternatives.
Geographically, North America currently dominates the energy ball market, driven by high consumer spending power, strong health and wellness trends, and well-established retail infrastructure. Key drivers for this regional dominance include:
- Economic Policies: Favorable economic conditions and a high disposable income among consumers support the purchase of premium and health-focused food products.
- Infrastructure: A robust retail and distribution network ensures widespread availability of energy balls across various sales channels.
- Consumer Awareness: High levels of consumer awareness regarding health, fitness, and the benefits of natural ingredients contribute to sustained demand.
- Innovation Hubs: The presence of numerous food technology companies and research institutions fosters continuous product innovation.
The United States, in particular, is a leading country within this segment, with a substantial market share driven by a proactive approach to health and wellness and a well-developed food industry.
Energy Ball Product Developments
Recent product developments in the energy ball market are characterized by a strong emphasis on health, functionality, and diverse flavor profiles. Innovations include the introduction of energy balls fortified with probiotics for gut health, adaptogens for stress management, and added protein for post-workout recovery. Companies are increasingly experimenting with novel ingredient combinations, such as exotic fruits, superfoods like chia seeds and flaxseeds, and various nut and seed butters, to offer unique tastes and nutritional benefits. The competitive advantage lies in catering to specific dietary needs, such as gluten-free, dairy-free, and vegan options, alongside attractive and sustainable packaging solutions. Technological advancements in processing are also enabling the creation of smoother textures and longer shelf lives without compromising on natural ingredients.
Key Drivers of Energy Ball Growth
The energy ball market is experiencing significant growth driven by several key factors:
- Rising Health Consciousness: An escalating global focus on healthy eating and preventative healthcare fuels demand for natural, nutrient-dense snacks.
- Convenience and Portability: The on-the-go lifestyle of modern consumers makes energy balls an ideal, quick, and mess-free snack option.
- Plant-Based and Vegan Trends: The growing popularity of vegan and plant-based diets directly translates to increased demand for energy balls made from natural, plant-derived ingredients.
- Technological Advancements: Innovations in ingredient sourcing, formulation, and processing allow for more diverse and appealing energy ball products.
- Expanding Distribution Channels: The growth of e-commerce and the increasing presence of energy balls in mainstream retail outlets are broadening market access.
Challenges in the Energy Ball Market
Despite its growth, the energy ball market faces several challenges:
- Intense Competition: A crowded market with numerous brands and private labels leads to price pressures and difficulties in differentiation.
- Supply Chain Volatility: Fluctuations in the prices and availability of key natural ingredients can impact production costs and product consistency.
- Regulatory Hurdles: Evolving food safety regulations, labeling requirements, and claims substantiation can pose compliance challenges for manufacturers.
- Consumer Perception of Price: The premium pricing often associated with organic and specialty ingredients can be a barrier for some price-sensitive consumers.
- Shelf-Life Limitations: The use of natural ingredients can sometimes lead to shorter shelf lives compared to highly processed snacks, requiring careful inventory management.
Emerging Opportunities in Energy Ball
The energy ball market presents numerous emerging opportunities poised to drive long-term growth:
- Functional Ingredient Innovation: Continued research and development into new functional ingredients like nootropics, prebiotics, and specific vitamin/mineral blends can create unique product offerings.
- Personalized Nutrition: The development of customizable energy balls tailored to individual dietary needs, allergies, and fitness goals holds significant potential.
- Strategic Partnerships: Collaborations with fitness centers, athletic organizations, and wellness influencers can enhance brand visibility and reach targeted consumer segments.
- Emerging Market Expansion: Untapped potential in developing economies, where awareness of healthy snacking is growing, offers substantial market expansion opportunities.
- Sustainable Packaging Solutions: Innovations in eco-friendly and compostable packaging can appeal to environmentally conscious consumers and create a competitive edge.
Leading Players in the Energy Ball Sector
- Boostball
- Bounce Foods
- Deliciously Ella
- Windmill Organics
- Made In Nature
- Betty Lou's
- Nutri-Brex
Key Milestones in Energy Ball Industry
- 2019: Increased consumer awareness and adoption of plant-based diets fuels early growth in the organic energy ball segment.
- 2020: The COVID-19 pandemic accelerates the growth of online sales channels for health and wellness products, including energy balls.
- 2021: Introduction of innovative functional ingredients like adaptogens and probiotics into energy ball formulations gains traction.
- 2022: Several major food manufacturers begin to expand their product lines or acquire smaller, innovative energy ball companies.
- 2023: Growing emphasis on sustainable packaging practices becomes a key differentiator for energy ball brands.
- 2024: Increased focus on personalized nutrition leads to the development of energy balls catering to specific dietary needs and fitness goals.
Strategic Outlook for Energy Ball Market
The energy ball market is projected for continued robust expansion, driven by evolving consumer preferences for health and convenience. Strategic opportunities lie in the expansion of functional ingredient offerings, catering to niche dietary needs, and leveraging the growing online sales channel. Companies that focus on sustainable sourcing and packaging, alongside targeted marketing campaigns to health-conscious demographics and athletes, will be well-positioned for success. Furthermore, strategic partnerships and potential M&A activities will likely shape the competitive landscape, creating avenues for market consolidation and accelerated growth. The industry's adaptability to emerging health trends and its commitment to natural, beneficial ingredients will be paramount in capturing future market share.
Energy Ball Segmentation
-
1. Application
- 1.1. Retail
- 1.2. Online Sale
-
2. Types
- 2.1. Organic
- 2.2. Conventional
Energy Ball Segmentation By Geography
-
1. North America
- 1.1. United States
- 1.2. Canada
- 1.3. Mexico
-
2. South America
- 2.1. Brazil
- 2.2. Argentina
- 2.3. Rest of South America
-
3. Europe
- 3.1. United Kingdom
- 3.2. Germany
- 3.3. France
- 3.4. Italy
- 3.5. Spain
- 3.6. Russia
- 3.7. Benelux
- 3.8. Nordics
- 3.9. Rest of Europe
-
4. Middle East & Africa
- 4.1. Turkey
- 4.2. Israel
- 4.3. GCC
- 4.4. North Africa
- 4.5. South Africa
- 4.6. Rest of Middle East & Africa
-
5. Asia Pacific
- 5.1. China
- 5.2. India
- 5.3. Japan
- 5.4. South Korea
- 5.5. ASEAN
- 5.6. Oceania
- 5.7. Rest of Asia Pacific
Energy Ball Regional Market Share
Geographic Coverage of Energy Ball
Energy Ball REPORT HIGHLIGHTS
| Aspects | Details |
|---|---|
| Study Period | 2020-2034 |
| Base Year | 2025 |
| Estimated Year | 2026 |
| Forecast Period | 2026-2034 |
| Historical Period | 2020-2025 |
| Growth Rate | CAGR of 6.9% from 2020-2034 |
| Segmentation |
|
Table of Contents
- 1. Introduction
- 1.1. Research Scope
- 1.2. Market Segmentation
- 1.3. Research Methodology
- 1.4. Definitions and Assumptions
- 2. Executive Summary
- 2.1. Introduction
- 3. Market Dynamics
- 3.1. Introduction
- 3.2. Market Drivers
- 3.3. Market Restrains
- 3.4. Market Trends
- 4. Market Factor Analysis
- 4.1. Porters Five Forces
- 4.2. Supply/Value Chain
- 4.3. PESTEL analysis
- 4.4. Market Entropy
- 4.5. Patent/Trademark Analysis
- 5. Global Energy Ball Analysis, Insights and Forecast, 2020-2032
- 5.1. Market Analysis, Insights and Forecast - by Application
- 5.1.1. Retail
- 5.1.2. Online Sale
- 5.2. Market Analysis, Insights and Forecast - by Types
- 5.2.1. Organic
- 5.2.2. Conventional
- 5.3. Market Analysis, Insights and Forecast - by Region
- 5.3.1. North America
- 5.3.2. South America
- 5.3.3. Europe
- 5.3.4. Middle East & Africa
- 5.3.5. Asia Pacific
- 5.1. Market Analysis, Insights and Forecast - by Application
- 6. North America Energy Ball Analysis, Insights and Forecast, 2020-2032
- 6.1. Market Analysis, Insights and Forecast - by Application
- 6.1.1. Retail
- 6.1.2. Online Sale
- 6.2. Market Analysis, Insights and Forecast - by Types
- 6.2.1. Organic
- 6.2.2. Conventional
- 6.1. Market Analysis, Insights and Forecast - by Application
- 7. South America Energy Ball Analysis, Insights and Forecast, 2020-2032
- 7.1. Market Analysis, Insights and Forecast - by Application
- 7.1.1. Retail
- 7.1.2. Online Sale
- 7.2. Market Analysis, Insights and Forecast - by Types
- 7.2.1. Organic
- 7.2.2. Conventional
- 7.1. Market Analysis, Insights and Forecast - by Application
- 8. Europe Energy Ball Analysis, Insights and Forecast, 2020-2032
- 8.1. Market Analysis, Insights and Forecast - by Application
- 8.1.1. Retail
- 8.1.2. Online Sale
- 8.2. Market Analysis, Insights and Forecast - by Types
- 8.2.1. Organic
- 8.2.2. Conventional
- 8.1. Market Analysis, Insights and Forecast - by Application
- 9. Middle East & Africa Energy Ball Analysis, Insights and Forecast, 2020-2032
- 9.1. Market Analysis, Insights and Forecast - by Application
- 9.1.1. Retail
- 9.1.2. Online Sale
- 9.2. Market Analysis, Insights and Forecast - by Types
- 9.2.1. Organic
- 9.2.2. Conventional
- 9.1. Market Analysis, Insights and Forecast - by Application
- 10. Asia Pacific Energy Ball Analysis, Insights and Forecast, 2020-2032
- 10.1. Market Analysis, Insights and Forecast - by Application
- 10.1.1. Retail
- 10.1.2. Online Sale
- 10.2. Market Analysis, Insights and Forecast - by Types
- 10.2.1. Organic
- 10.2.2. Conventional
- 10.1. Market Analysis, Insights and Forecast - by Application
- 11. Competitive Analysis
- 11.1. Global Market Share Analysis 2025
- 11.2. Company Profiles
- 11.2.1 Boostball
- 11.2.1.1. Overview
- 11.2.1.2. Products
- 11.2.1.3. SWOT Analysis
- 11.2.1.4. Recent Developments
- 11.2.1.5. Financials (Based on Availability)
- 11.2.2 Bounce Foods
- 11.2.2.1. Overview
- 11.2.2.2. Products
- 11.2.2.3. SWOT Analysis
- 11.2.2.4. Recent Developments
- 11.2.2.5. Financials (Based on Availability)
- 11.2.3 Deliciously Ella
- 11.2.3.1. Overview
- 11.2.3.2. Products
- 11.2.3.3. SWOT Analysis
- 11.2.3.4. Recent Developments
- 11.2.3.5. Financials (Based on Availability)
- 11.2.4 Windmill Organics
- 11.2.4.1. Overview
- 11.2.4.2. Products
- 11.2.4.3. SWOT Analysis
- 11.2.4.4. Recent Developments
- 11.2.4.5. Financials (Based on Availability)
- 11.2.5 Made In Nature
- 11.2.5.1. Overview
- 11.2.5.2. Products
- 11.2.5.3. SWOT Analysis
- 11.2.5.4. Recent Developments
- 11.2.5.5. Financials (Based on Availability)
- 11.2.6 Betty Lou's
- 11.2.6.1. Overview
- 11.2.6.2. Products
- 11.2.6.3. SWOT Analysis
- 11.2.6.4. Recent Developments
- 11.2.6.5. Financials (Based on Availability)
- 11.2.7 Nutri-Brex
- 11.2.7.1. Overview
- 11.2.7.2. Products
- 11.2.7.3. SWOT Analysis
- 11.2.7.4. Recent Developments
- 11.2.7.5. Financials (Based on Availability)
- 11.2.1 Boostball
List of Figures
- Figure 1: Global Energy Ball Revenue Breakdown (undefined, %) by Region 2025 & 2033
- Figure 2: North America Energy Ball Revenue (undefined), by Application 2025 & 2033
- Figure 3: North America Energy Ball Revenue Share (%), by Application 2025 & 2033
- Figure 4: North America Energy Ball Revenue (undefined), by Types 2025 & 2033
- Figure 5: North America Energy Ball Revenue Share (%), by Types 2025 & 2033
- Figure 6: North America Energy Ball Revenue (undefined), by Country 2025 & 2033
- Figure 7: North America Energy Ball Revenue Share (%), by Country 2025 & 2033
- Figure 8: South America Energy Ball Revenue (undefined), by Application 2025 & 2033
- Figure 9: South America Energy Ball Revenue Share (%), by Application 2025 & 2033
- Figure 10: South America Energy Ball Revenue (undefined), by Types 2025 & 2033
- Figure 11: South America Energy Ball Revenue Share (%), by Types 2025 & 2033
- Figure 12: South America Energy Ball Revenue (undefined), by Country 2025 & 2033
- Figure 13: South America Energy Ball Revenue Share (%), by Country 2025 & 2033
- Figure 14: Europe Energy Ball Revenue (undefined), by Application 2025 & 2033
- Figure 15: Europe Energy Ball Revenue Share (%), by Application 2025 & 2033
- Figure 16: Europe Energy Ball Revenue (undefined), by Types 2025 & 2033
- Figure 17: Europe Energy Ball Revenue Share (%), by Types 2025 & 2033
- Figure 18: Europe Energy Ball Revenue (undefined), by Country 2025 & 2033
- Figure 19: Europe Energy Ball Revenue Share (%), by Country 2025 & 2033
- Figure 20: Middle East & Africa Energy Ball Revenue (undefined), by Application 2025 & 2033
- Figure 21: Middle East & Africa Energy Ball Revenue Share (%), by Application 2025 & 2033
- Figure 22: Middle East & Africa Energy Ball Revenue (undefined), by Types 2025 & 2033
- Figure 23: Middle East & Africa Energy Ball Revenue Share (%), by Types 2025 & 2033
- Figure 24: Middle East & Africa Energy Ball Revenue (undefined), by Country 2025 & 2033
- Figure 25: Middle East & Africa Energy Ball Revenue Share (%), by Country 2025 & 2033
- Figure 26: Asia Pacific Energy Ball Revenue (undefined), by Application 2025 & 2033
- Figure 27: Asia Pacific Energy Ball Revenue Share (%), by Application 2025 & 2033
- Figure 28: Asia Pacific Energy Ball Revenue (undefined), by Types 2025 & 2033
- Figure 29: Asia Pacific Energy Ball Revenue Share (%), by Types 2025 & 2033
- Figure 30: Asia Pacific Energy Ball Revenue (undefined), by Country 2025 & 2033
- Figure 31: Asia Pacific Energy Ball Revenue Share (%), by Country 2025 & 2033
List of Tables
- Table 1: Global Energy Ball Revenue undefined Forecast, by Application 2020 & 2033
- Table 2: Global Energy Ball Revenue undefined Forecast, by Types 2020 & 2033
- Table 3: Global Energy Ball Revenue undefined Forecast, by Region 2020 & 2033
- Table 4: Global Energy Ball Revenue undefined Forecast, by Application 2020 & 2033
- Table 5: Global Energy Ball Revenue undefined Forecast, by Types 2020 & 2033
- Table 6: Global Energy Ball Revenue undefined Forecast, by Country 2020 & 2033
- Table 7: United States Energy Ball Revenue (undefined) Forecast, by Application 2020 & 2033
- Table 8: Canada Energy Ball Revenue (undefined) Forecast, by Application 2020 & 2033
- Table 9: Mexico Energy Ball Revenue (undefined) Forecast, by Application 2020 & 2033
- Table 10: Global Energy Ball Revenue undefined Forecast, by Application 2020 & 2033
- Table 11: Global Energy Ball Revenue undefined Forecast, by Types 2020 & 2033
- Table 12: Global Energy Ball Revenue undefined Forecast, by Country 2020 & 2033
- Table 13: Brazil Energy Ball Revenue (undefined) Forecast, by Application 2020 & 2033
- Table 14: Argentina Energy Ball Revenue (undefined) Forecast, by Application 2020 & 2033
- Table 15: Rest of South America Energy Ball Revenue (undefined) Forecast, by Application 2020 & 2033
- Table 16: Global Energy Ball Revenue undefined Forecast, by Application 2020 & 2033
- Table 17: Global Energy Ball Revenue undefined Forecast, by Types 2020 & 2033
- Table 18: Global Energy Ball Revenue undefined Forecast, by Country 2020 & 2033
- Table 19: United Kingdom Energy Ball Revenue (undefined) Forecast, by Application 2020 & 2033
- Table 20: Germany Energy Ball Revenue (undefined) Forecast, by Application 2020 & 2033
- Table 21: France Energy Ball Revenue (undefined) Forecast, by Application 2020 & 2033
- Table 22: Italy Energy Ball Revenue (undefined) Forecast, by Application 2020 & 2033
- Table 23: Spain Energy Ball Revenue (undefined) Forecast, by Application 2020 & 2033
- Table 24: Russia Energy Ball Revenue (undefined) Forecast, by Application 2020 & 2033
- Table 25: Benelux Energy Ball Revenue (undefined) Forecast, by Application 2020 & 2033
- Table 26: Nordics Energy Ball Revenue (undefined) Forecast, by Application 2020 & 2033
- Table 27: Rest of Europe Energy Ball Revenue (undefined) Forecast, by Application 2020 & 2033
- Table 28: Global Energy Ball Revenue undefined Forecast, by Application 2020 & 2033
- Table 29: Global Energy Ball Revenue undefined Forecast, by Types 2020 & 2033
- Table 30: Global Energy Ball Revenue undefined Forecast, by Country 2020 & 2033
- Table 31: Turkey Energy Ball Revenue (undefined) Forecast, by Application 2020 & 2033
- Table 32: Israel Energy Ball Revenue (undefined) Forecast, by Application 2020 & 2033
- Table 33: GCC Energy Ball Revenue (undefined) Forecast, by Application 2020 & 2033
- Table 34: North Africa Energy Ball Revenue (undefined) Forecast, by Application 2020 & 2033
- Table 35: South Africa Energy Ball Revenue (undefined) Forecast, by Application 2020 & 2033
- Table 36: Rest of Middle East & Africa Energy Ball Revenue (undefined) Forecast, by Application 2020 & 2033
- Table 37: Global Energy Ball Revenue undefined Forecast, by Application 2020 & 2033
- Table 38: Global Energy Ball Revenue undefined Forecast, by Types 2020 & 2033
- Table 39: Global Energy Ball Revenue undefined Forecast, by Country 2020 & 2033
- Table 40: China Energy Ball Revenue (undefined) Forecast, by Application 2020 & 2033
- Table 41: India Energy Ball Revenue (undefined) Forecast, by Application 2020 & 2033
- Table 42: Japan Energy Ball Revenue (undefined) Forecast, by Application 2020 & 2033
- Table 43: South Korea Energy Ball Revenue (undefined) Forecast, by Application 2020 & 2033
- Table 44: ASEAN Energy Ball Revenue (undefined) Forecast, by Application 2020 & 2033
- Table 45: Oceania Energy Ball Revenue (undefined) Forecast, by Application 2020 & 2033
- Table 46: Rest of Asia Pacific Energy Ball Revenue (undefined) Forecast, by Application 2020 & 2033
Frequently Asked Questions
1. What is the projected Compound Annual Growth Rate (CAGR) of the Energy Ball?
The projected CAGR is approximately 6.9%.
2. Which companies are prominent players in the Energy Ball?
Key companies in the market include Boostball, Bounce Foods, Deliciously Ella, Windmill Organics, Made In Nature, Betty Lou's, Nutri-Brex.
3. What are the main segments of the Energy Ball?
The market segments include Application, Types.
4. Can you provide details about the market size?
The market size is estimated to be USD XXX N/A as of 2022.
5. What are some drivers contributing to market growth?
N/A
6. What are the notable trends driving market growth?
N/A
7. Are there any restraints impacting market growth?
N/A
8. Can you provide examples of recent developments in the market?
N/A
9. What pricing options are available for accessing the report?
Pricing options include single-user, multi-user, and enterprise licenses priced at USD 4900.00, USD 7350.00, and USD 9800.00 respectively.
10. Is the market size provided in terms of value or volume?
The market size is provided in terms of value, measured in N/A.
11. Are there any specific market keywords associated with the report?
Yes, the market keyword associated with the report is "Energy Ball," which aids in identifying and referencing the specific market segment covered.
12. How do I determine which pricing option suits my needs best?
The pricing options vary based on user requirements and access needs. Individual users may opt for single-user licenses, while businesses requiring broader access may choose multi-user or enterprise licenses for cost-effective access to the report.
13. Are there any additional resources or data provided in the Energy Ball report?
While the report offers comprehensive insights, it's advisable to review the specific contents or supplementary materials provided to ascertain if additional resources or data are available.
14. How can I stay updated on further developments or reports in the Energy Ball?
To stay informed about further developments, trends, and reports in the Energy Ball, consider subscribing to industry newsletters, following relevant companies and organizations, or regularly checking reputable industry news sources and publications.
Methodology
Step 1 - Identification of Relevant Samples Size from Population Database


Step 2 - Approaches for Defining Global Market Size (Value, Volume* & Price*)

Note*: In applicable scenarios
Step 3 - Data Sources
Primary Research
- Web Analytics
- Survey Reports
- Research Institute
- Latest Research Reports
- Opinion Leaders
Secondary Research
- Annual Reports
- White Paper
- Latest Press Release
- Industry Association
- Paid Database
- Investor Presentations

Step 4 - Data Triangulation
Involves using different sources of information in order to increase the validity of a study
These sources are likely to be stakeholders in a program - participants, other researchers, program staff, other community members, and so on.
Then we put all data in single framework & apply various statistical tools to find out the dynamic on the market.
During the analysis stage, feedback from the stakeholder groups would be compared to determine areas of agreement as well as areas of divergence