

Key Insights
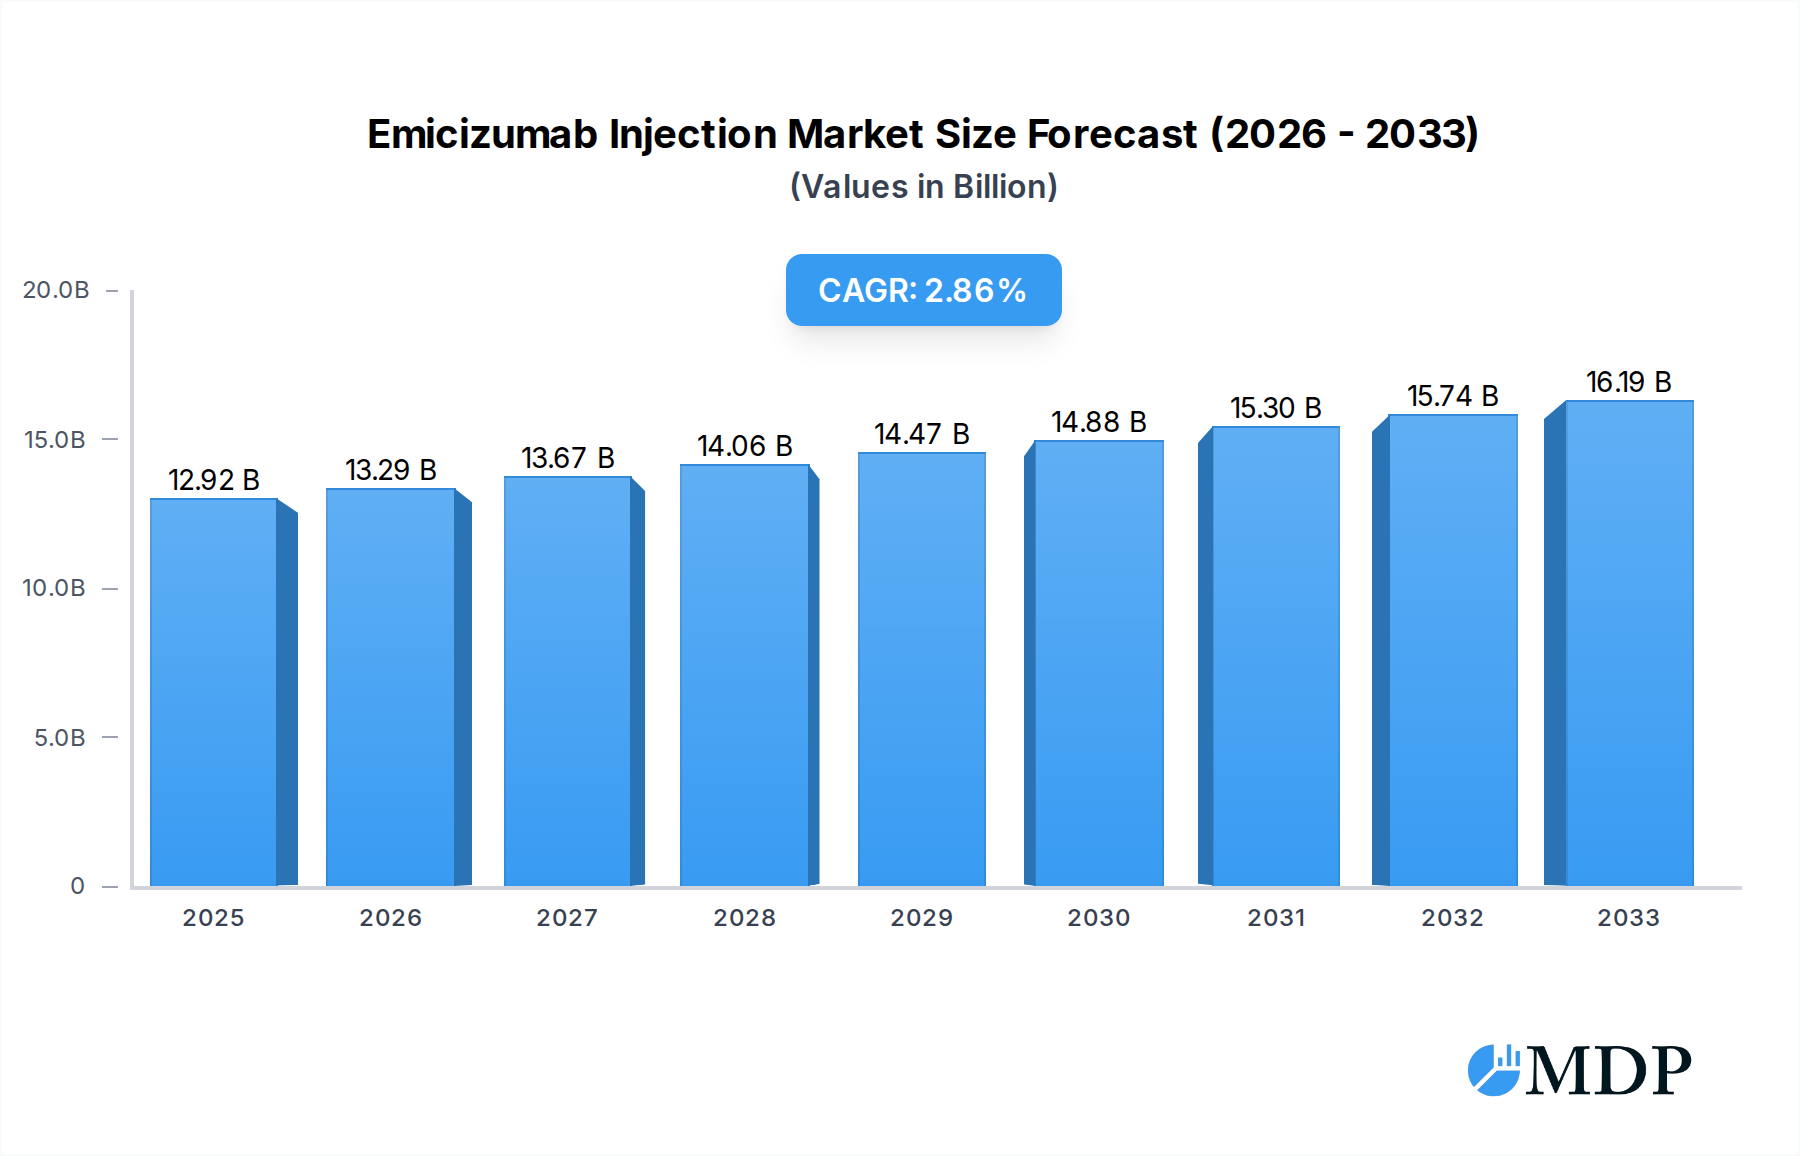
The global Emicizumab Injection market is poised for significant growth, projected to reach a market size of $12,918 million by 2025. This expansion is driven by increasing diagnoses of hemophilia A, particularly among pediatric populations, and a growing preference for less frequent dosing regimens. The CAGR of 2.9% over the forecast period (2025-2033) indicates a steady and robust upward trajectory. Key growth drivers include the enhanced efficacy and safety profile of Emicizumab compared to traditional factor replacement therapies, reducing the burden of frequent infusions and the risk of inhibitor development. Furthermore, advancements in diagnostic capabilities are leading to earlier and more accurate identification of hemophilia A, thereby expanding the patient pool eligible for Emicizumab treatment. The market is witnessing a shift towards more convenient dosage forms, with a focus on options like 150mg (1ml)/Bottle and 105mg (0.7ml)/Bottle, catering to diverse patient needs and treatment protocols across various healthcare settings, including hospitals and specialized clinics.

Emicizumab Injection Market Size (In Billion)
The competitive landscape is characterized by innovation and strategic partnerships aimed at expanding market reach and addressing unmet medical needs. While the market is primarily influenced by the growing prevalence of hemophilia A and the clear clinical advantages of Emicizumab, certain restraints such as high treatment costs and the need for specialized medical infrastructure could temper the pace of growth in some regions. However, ongoing research and development efforts are focused on optimizing production processes and exploring new therapeutic applications, which are expected to mitigate these challenges. The market’s regional segmentation highlights a strong presence in North America and Europe, with substantial growth potential anticipated in the Asia Pacific region due to increasing healthcare investments and rising awareness about hemophilia A management. The trend towards subcutaneous administration over intravenous infusion further bolsters Emicizumab's market appeal, promising improved patient compliance and quality of life.
Emicizumab Injection Company Market Share
Emicizumab Injection Market: Comprehensive Analysis and Future Outlook (2019-2033)
This in-depth market research report provides a definitive analysis of the global Emicizumab Injection market, projecting significant growth and highlighting key trends, opportunities, and challenges. Covering a study period from 2019 to 2033, with a base year of 2025 and a forecast period from 2025 to 2033, this report offers actionable insights for industry stakeholders.
Emicizumab Injection Market Dynamics & Concentration
The Emicizumab Injection market exhibits a moderate to high concentration, primarily driven by the innovation and strategic investments of key players like Roche Pharma (Schweiz) AG and Chugai Pharmaceutical. Innovation drivers revolve around the development of novel treatment regimens and improved patient outcomes for hemophilia. Regulatory frameworks, particularly those from the FDA and EMA, play a crucial role in market access and product approvals, influencing the pace of adoption. Product substitutes, while present in the form of traditional clotting factor therapies, are increasingly being overshadowed by the superior efficacy and prophylactic benefits of Emicizumab. End-user trends indicate a growing preference for subcutaneous administration and home-based treatment options, enhancing patient convenience and quality of life. Mergers and acquisition (M&A) activities, though not extensively reported in this specific segment, remain a potential avenue for market consolidation and expansion. The market share of Emicizumab is steadily increasing, with projections indicating a significant dominance in the prophylactic treatment of hemophilia A.
- Market Concentration: Moderate to High
- Key Innovation Drivers: Improved efficacy, prophylactic benefits, subcutaneous administration.
- Regulatory Influence: Significant impact on market access and approval timelines.
- End-User Preferences: Shift towards convenient, home-based treatment.
- M&A Activities: Potential for future consolidation.
Emicizumab Injection Industry Trends & Analysis
The Emicizumab Injection industry is poised for robust growth, projected to expand at a Compound Annual Growth Rate (CAGR) of approximately 15% during the forecast period of 2025-2033. This expansion is underpinned by several critical market growth drivers, most notably the increasing prevalence of hemophilia A worldwide and the growing awareness of Emicizumab's significant advantages over conventional therapies. Technological disruptions are primarily focused on optimizing drug delivery systems and exploring expanded indications for Emicizumab. Consumer preferences are clearly shifting towards treatments that offer a better quality of life, reduced treatment burden, and fewer bleeding events, all of which Emicizumab effectively addresses. The competitive dynamics within the market are characterized by strong brand loyalty and ongoing research and development efforts to further enhance therapeutic profiles and patient adherence. Market penetration of Emicizumab is expected to accelerate as healthcare providers and payers recognize its cost-effectiveness in the long term by reducing hospitalization and management of bleeding complications. The historical period from 2019-2024 has seen a steady uptake, setting a strong foundation for future growth.
Leading Markets & Segments in Emicizumab Injection
The Hospital segment currently dominates the Emicizumab Injection market, driven by the complexity of hemophilia management and the need for specialized medical oversight. Within the hospital setting, inpatient and outpatient services for hemophilia treatment are the primary application areas. The 150mg (1ml)/Bottle and 105mg (0.7ml)/Bottle dosage forms are experiencing significant demand due to their efficacy in maintaining therapeutic levels for prophylactic treatment.
- Dominant Application: Hospital, including inpatient and outpatient care.
- Key Drivers for Hospital Dominance:
- Requirement for specialized hemophilia treatment centers.
- Monitoring of patient response and management of potential side effects.
- Integration into comprehensive bleeding disorder management protocols.
- Leading Dosage Forms: 150mg (1ml)/Bottle and 105mg (0.7ml)/Bottle, favored for sustained therapeutic concentrations.
- Growing Segments: Clinics are showing increasing adoption as understanding and comfort with Emicizumab grows, enabling more routine prophylactic care. The "Others" segment, encompassing home healthcare services, is poised for substantial expansion as self-administration becomes more common.
- Economic Factors: Favorable reimbursement policies for advanced therapies in major economies contribute to the segment's growth.
- Infrastructure: Well-established healthcare infrastructure in developed nations supports the widespread availability and administration of Emicizumab.
Emicizumab Injection Product Developments
Recent product developments in Emicizumab Injection have centered on enhancing patient convenience and expanding its therapeutic utility. Innovations include the development of pre-filled syringes for simpler self-administration and the ongoing investigation into its efficacy in individuals with certain types of inhibitors, a significant unmet need. These advancements aim to improve patient adherence and broaden the applicability of Emicizumab within the hemophilia A treatment landscape, solidifying its position as a transformative therapy and offering a significant competitive advantage over existing treatment paradigms.
Key Drivers of Emicizumab Injection Growth
The growth of the Emicizumab Injection market is primarily propelled by significant technological advancements in drug development, leading to a more effective and convenient prophylactic treatment for hemophilia A. Economically, the long-term cost savings associated with reduced bleeding events and hospitalizations are increasingly recognized, making it an attractive option for healthcare systems. Regulatory bodies, by providing streamlined approval pathways for innovative therapies, are also crucial enablers of market expansion. The direct benefit of improved patient quality of life and reduced treatment burden further fuels demand.
Challenges in the Emicizumab Injection Market
Despite its success, the Emicizumab Injection market faces certain challenges. High acquisition costs for the therapy can be a barrier to widespread adoption, particularly in resource-constrained regions. Complex reimbursement negotiations and varying regulatory approval timelines across different countries can also create hurdles. Furthermore, the need for specialized training for healthcare professionals to administer and manage Emicizumab can impact market penetration, alongside potential supply chain complexities for specialized biologics.
Emerging Opportunities in Emicizumab Injection
Emerging opportunities in the Emicizumab Injection market are significant, driven by the potential for expanded indications beyond hemophilia A, and the development of novel delivery mechanisms that further enhance patient convenience. Strategic partnerships between pharmaceutical companies and hemophilia treatment centers can accelerate real-world evidence generation and improve patient access. Market expansion into underserved geographical regions and ongoing research into combination therapies offer further avenues for long-term growth and enhanced therapeutic outcomes for a broader patient population.
Leading Players in the Emicizumab Injection Sector
- Roche Pharma (Schweiz) AG
- Chugai Pharmaceutical
Key Milestones in Emicizumab Injection Industry
- 2017: FDA approval for Hemlibra (emicizumab-kxwh) prophylaxis in individuals with hemophilia A with factor VIII inhibitors.
- 2017: EMA approval for Hemlibra prophylaxis in individuals with hemophilia A with factor VIII inhibitors.
- 2019: FDA approval for Hemlibra for routine prophylaxis for patients with hemophilia A without factor VIII inhibitors.
- 2019: EMA approval for Hemlibra for routine prophylaxis for patients with hemophilia A without factor VIII inhibitors.
- 2020: Continued clinical trials exploring expanded indications and improved formulations.
- 2021: Growing global adoption and market penetration in key regions.
- 2022: Increased focus on real-world evidence demonstrating long-term patient benefits and cost-effectiveness.
- 2023: Ongoing research into potential in other rare bleeding disorders.
Strategic Outlook for Emicizumab Injection Market
The strategic outlook for the Emicizumab Injection market is exceptionally positive, driven by its established efficacy and the continuous pursuit of innovation. Growth accelerators include expanding its use in younger patient populations and exploring novel subcutaneous delivery systems to further improve convenience. The market is expected to benefit from increasing global healthcare spending on rare diseases and a growing understanding of the long-term benefits of prophylactic treatment, solidifying Emicizumab's role as a cornerstone therapy in hemophilia management and potentially beyond.
Emicizumab Injection Segmentation
-
1. Application
- 1.1. Hospital
- 1.2. Clinic
- 1.3. Others
-
2. Types
- 2.1. 150mg (1ml)/Bottle
- 2.2. 105mg (0.7ml)/Bottle
- 2.3. 60mg (0.4ml)/Bottle
- 2.4. 30mg (1ml)/Bottle
Emicizumab Injection Segmentation By Geography
-
1. North America
- 1.1. United States
- 1.2. Canada
- 1.3. Mexico
-
2. South America
- 2.1. Brazil
- 2.2. Argentina
- 2.3. Rest of South America
-
3. Europe
- 3.1. United Kingdom
- 3.2. Germany
- 3.3. France
- 3.4. Italy
- 3.5. Spain
- 3.6. Russia
- 3.7. Benelux
- 3.8. Nordics
- 3.9. Rest of Europe
-
4. Middle East & Africa
- 4.1. Turkey
- 4.2. Israel
- 4.3. GCC
- 4.4. North Africa
- 4.5. South Africa
- 4.6. Rest of Middle East & Africa
-
5. Asia Pacific
- 5.1. China
- 5.2. India
- 5.3. Japan
- 5.4. South Korea
- 5.5. ASEAN
- 5.6. Oceania
- 5.7. Rest of Asia Pacific

Emicizumab Injection Regional Market Share
Geographic Coverage of Emicizumab Injection
Emicizumab Injection REPORT HIGHLIGHTS
| Aspects | Details |
|---|---|
| Study Period | 2020-2034 |
| Base Year | 2025 |
| Estimated Year | 2026 |
| Forecast Period | 2026-2034 |
| Historical Period | 2020-2025 |
| Growth Rate | CAGR of 2.9% from 2020-2034 |
| Segmentation |
|
Table of Contents
- 1. Introduction
- 1.1. Research Scope
- 1.2. Market Segmentation
- 1.3. Research Methodology
- 1.4. Definitions and Assumptions
- 2. Executive Summary
- 2.1. Introduction
- 3. Market Dynamics
- 3.1. Introduction
- 3.2. Market Drivers
- 3.3. Market Restrains
- 3.4. Market Trends
- 4. Market Factor Analysis
- 4.1. Porters Five Forces
- 4.2. Supply/Value Chain
- 4.3. PESTEL analysis
- 4.4. Market Entropy
- 4.5. Patent/Trademark Analysis
- 5. Global Emicizumab Injection Analysis, Insights and Forecast, 2020-2032
- 5.1. Market Analysis, Insights and Forecast - by Application
- 5.1.1. Hospital
- 5.1.2. Clinic
- 5.1.3. Others
- 5.2. Market Analysis, Insights and Forecast - by Types
- 5.2.1. 150mg (1ml)/Bottle
- 5.2.2. 105mg (0.7ml)/Bottle
- 5.2.3. 60mg (0.4ml)/Bottle
- 5.2.4. 30mg (1ml)/Bottle
- 5.3. Market Analysis, Insights and Forecast - by Region
- 5.3.1. North America
- 5.3.2. South America
- 5.3.3. Europe
- 5.3.4. Middle East & Africa
- 5.3.5. Asia Pacific
- 5.1. Market Analysis, Insights and Forecast - by Application
- 6. North America Emicizumab Injection Analysis, Insights and Forecast, 2020-2032
- 6.1. Market Analysis, Insights and Forecast - by Application
- 6.1.1. Hospital
- 6.1.2. Clinic
- 6.1.3. Others
- 6.2. Market Analysis, Insights and Forecast - by Types
- 6.2.1. 150mg (1ml)/Bottle
- 6.2.2. 105mg (0.7ml)/Bottle
- 6.2.3. 60mg (0.4ml)/Bottle
- 6.2.4. 30mg (1ml)/Bottle
- 6.1. Market Analysis, Insights and Forecast - by Application
- 7. South America Emicizumab Injection Analysis, Insights and Forecast, 2020-2032
- 7.1. Market Analysis, Insights and Forecast - by Application
- 7.1.1. Hospital
- 7.1.2. Clinic
- 7.1.3. Others
- 7.2. Market Analysis, Insights and Forecast - by Types
- 7.2.1. 150mg (1ml)/Bottle
- 7.2.2. 105mg (0.7ml)/Bottle
- 7.2.3. 60mg (0.4ml)/Bottle
- 7.2.4. 30mg (1ml)/Bottle
- 7.1. Market Analysis, Insights and Forecast - by Application
- 8. Europe Emicizumab Injection Analysis, Insights and Forecast, 2020-2032
- 8.1. Market Analysis, Insights and Forecast - by Application
- 8.1.1. Hospital
- 8.1.2. Clinic
- 8.1.3. Others
- 8.2. Market Analysis, Insights and Forecast - by Types
- 8.2.1. 150mg (1ml)/Bottle
- 8.2.2. 105mg (0.7ml)/Bottle
- 8.2.3. 60mg (0.4ml)/Bottle
- 8.2.4. 30mg (1ml)/Bottle
- 8.1. Market Analysis, Insights and Forecast - by Application
- 9. Middle East & Africa Emicizumab Injection Analysis, Insights and Forecast, 2020-2032
- 9.1. Market Analysis, Insights and Forecast - by Application
- 9.1.1. Hospital
- 9.1.2. Clinic
- 9.1.3. Others
- 9.2. Market Analysis, Insights and Forecast - by Types
- 9.2.1. 150mg (1ml)/Bottle
- 9.2.2. 105mg (0.7ml)/Bottle
- 9.2.3. 60mg (0.4ml)/Bottle
- 9.2.4. 30mg (1ml)/Bottle
- 9.1. Market Analysis, Insights and Forecast - by Application
- 10. Asia Pacific Emicizumab Injection Analysis, Insights and Forecast, 2020-2032
- 10.1. Market Analysis, Insights and Forecast - by Application
- 10.1.1. Hospital
- 10.1.2. Clinic
- 10.1.3. Others
- 10.2. Market Analysis, Insights and Forecast - by Types
- 10.2.1. 150mg (1ml)/Bottle
- 10.2.2. 105mg (0.7ml)/Bottle
- 10.2.3. 60mg (0.4ml)/Bottle
- 10.2.4. 30mg (1ml)/Bottle
- 10.1. Market Analysis, Insights and Forecast - by Application
- 11. Competitive Analysis
- 11.1. Global Market Share Analysis 2025
- 11.2. Company Profiles
- 11.2.1 Roche Pharma (Schweiz) AG
- 11.2.1.1. Overview
- 11.2.1.2. Products
- 11.2.1.3. SWOT Analysis
- 11.2.1.4. Recent Developments
- 11.2.1.5. Financials (Based on Availability)
- 11.2.2 Chugai Pharmaceutical
- 11.2.2.1. Overview
- 11.2.2.2. Products
- 11.2.2.3. SWOT Analysis
- 11.2.2.4. Recent Developments
- 11.2.2.5. Financials (Based on Availability)
- 11.2.1 Roche Pharma (Schweiz) AG
List of Figures
- Figure 1: Global Emicizumab Injection Revenue Breakdown (million, %) by Region 2025 & 2033
- Figure 2: North America Emicizumab Injection Revenue (million), by Application 2025 & 2033
- Figure 3: North America Emicizumab Injection Revenue Share (%), by Application 2025 & 2033
- Figure 4: North America Emicizumab Injection Revenue (million), by Types 2025 & 2033
- Figure 5: North America Emicizumab Injection Revenue Share (%), by Types 2025 & 2033
- Figure 6: North America Emicizumab Injection Revenue (million), by Country 2025 & 2033
- Figure 7: North America Emicizumab Injection Revenue Share (%), by Country 2025 & 2033
- Figure 8: South America Emicizumab Injection Revenue (million), by Application 2025 & 2033
- Figure 9: South America Emicizumab Injection Revenue Share (%), by Application 2025 & 2033
- Figure 10: South America Emicizumab Injection Revenue (million), by Types 2025 & 2033
- Figure 11: South America Emicizumab Injection Revenue Share (%), by Types 2025 & 2033
- Figure 12: South America Emicizumab Injection Revenue (million), by Country 2025 & 2033
- Figure 13: South America Emicizumab Injection Revenue Share (%), by Country 2025 & 2033
- Figure 14: Europe Emicizumab Injection Revenue (million), by Application 2025 & 2033
- Figure 15: Europe Emicizumab Injection Revenue Share (%), by Application 2025 & 2033
- Figure 16: Europe Emicizumab Injection Revenue (million), by Types 2025 & 2033
- Figure 17: Europe Emicizumab Injection Revenue Share (%), by Types 2025 & 2033
- Figure 18: Europe Emicizumab Injection Revenue (million), by Country 2025 & 2033
- Figure 19: Europe Emicizumab Injection Revenue Share (%), by Country 2025 & 2033
- Figure 20: Middle East & Africa Emicizumab Injection Revenue (million), by Application 2025 & 2033
- Figure 21: Middle East & Africa Emicizumab Injection Revenue Share (%), by Application 2025 & 2033
- Figure 22: Middle East & Africa Emicizumab Injection Revenue (million), by Types 2025 & 2033
- Figure 23: Middle East & Africa Emicizumab Injection Revenue Share (%), by Types 2025 & 2033
- Figure 24: Middle East & Africa Emicizumab Injection Revenue (million), by Country 2025 & 2033
- Figure 25: Middle East & Africa Emicizumab Injection Revenue Share (%), by Country 2025 & 2033
- Figure 26: Asia Pacific Emicizumab Injection Revenue (million), by Application 2025 & 2033
- Figure 27: Asia Pacific Emicizumab Injection Revenue Share (%), by Application 2025 & 2033
- Figure 28: Asia Pacific Emicizumab Injection Revenue (million), by Types 2025 & 2033
- Figure 29: Asia Pacific Emicizumab Injection Revenue Share (%), by Types 2025 & 2033
- Figure 30: Asia Pacific Emicizumab Injection Revenue (million), by Country 2025 & 2033
- Figure 31: Asia Pacific Emicizumab Injection Revenue Share (%), by Country 2025 & 2033
List of Tables
- Table 1: Global Emicizumab Injection Revenue million Forecast, by Application 2020 & 2033
- Table 2: Global Emicizumab Injection Revenue million Forecast, by Types 2020 & 2033
- Table 3: Global Emicizumab Injection Revenue million Forecast, by Region 2020 & 2033
- Table 4: Global Emicizumab Injection Revenue million Forecast, by Application 2020 & 2033
- Table 5: Global Emicizumab Injection Revenue million Forecast, by Types 2020 & 2033
- Table 6: Global Emicizumab Injection Revenue million Forecast, by Country 2020 & 2033
- Table 7: United States Emicizumab Injection Revenue (million) Forecast, by Application 2020 & 2033
- Table 8: Canada Emicizumab Injection Revenue (million) Forecast, by Application 2020 & 2033
- Table 9: Mexico Emicizumab Injection Revenue (million) Forecast, by Application 2020 & 2033
- Table 10: Global Emicizumab Injection Revenue million Forecast, by Application 2020 & 2033
- Table 11: Global Emicizumab Injection Revenue million Forecast, by Types 2020 & 2033
- Table 12: Global Emicizumab Injection Revenue million Forecast, by Country 2020 & 2033
- Table 13: Brazil Emicizumab Injection Revenue (million) Forecast, by Application 2020 & 2033
- Table 14: Argentina Emicizumab Injection Revenue (million) Forecast, by Application 2020 & 2033
- Table 15: Rest of South America Emicizumab Injection Revenue (million) Forecast, by Application 2020 & 2033
- Table 16: Global Emicizumab Injection Revenue million Forecast, by Application 2020 & 2033
- Table 17: Global Emicizumab Injection Revenue million Forecast, by Types 2020 & 2033
- Table 18: Global Emicizumab Injection Revenue million Forecast, by Country 2020 & 2033
- Table 19: United Kingdom Emicizumab Injection Revenue (million) Forecast, by Application 2020 & 2033
- Table 20: Germany Emicizumab Injection Revenue (million) Forecast, by Application 2020 & 2033
- Table 21: France Emicizumab Injection Revenue (million) Forecast, by Application 2020 & 2033
- Table 22: Italy Emicizumab Injection Revenue (million) Forecast, by Application 2020 & 2033
- Table 23: Spain Emicizumab Injection Revenue (million) Forecast, by Application 2020 & 2033
- Table 24: Russia Emicizumab Injection Revenue (million) Forecast, by Application 2020 & 2033
- Table 25: Benelux Emicizumab Injection Revenue (million) Forecast, by Application 2020 & 2033
- Table 26: Nordics Emicizumab Injection Revenue (million) Forecast, by Application 2020 & 2033
- Table 27: Rest of Europe Emicizumab Injection Revenue (million) Forecast, by Application 2020 & 2033
- Table 28: Global Emicizumab Injection Revenue million Forecast, by Application 2020 & 2033
- Table 29: Global Emicizumab Injection Revenue million Forecast, by Types 2020 & 2033
- Table 30: Global Emicizumab Injection Revenue million Forecast, by Country 2020 & 2033
- Table 31: Turkey Emicizumab Injection Revenue (million) Forecast, by Application 2020 & 2033
- Table 32: Israel Emicizumab Injection Revenue (million) Forecast, by Application 2020 & 2033
- Table 33: GCC Emicizumab Injection Revenue (million) Forecast, by Application 2020 & 2033
- Table 34: North Africa Emicizumab Injection Revenue (million) Forecast, by Application 2020 & 2033
- Table 35: South Africa Emicizumab Injection Revenue (million) Forecast, by Application 2020 & 2033
- Table 36: Rest of Middle East & Africa Emicizumab Injection Revenue (million) Forecast, by Application 2020 & 2033
- Table 37: Global Emicizumab Injection Revenue million Forecast, by Application 2020 & 2033
- Table 38: Global Emicizumab Injection Revenue million Forecast, by Types 2020 & 2033
- Table 39: Global Emicizumab Injection Revenue million Forecast, by Country 2020 & 2033
- Table 40: China Emicizumab Injection Revenue (million) Forecast, by Application 2020 & 2033
- Table 41: India Emicizumab Injection Revenue (million) Forecast, by Application 2020 & 2033
- Table 42: Japan Emicizumab Injection Revenue (million) Forecast, by Application 2020 & 2033
- Table 43: South Korea Emicizumab Injection Revenue (million) Forecast, by Application 2020 & 2033
- Table 44: ASEAN Emicizumab Injection Revenue (million) Forecast, by Application 2020 & 2033
- Table 45: Oceania Emicizumab Injection Revenue (million) Forecast, by Application 2020 & 2033
- Table 46: Rest of Asia Pacific Emicizumab Injection Revenue (million) Forecast, by Application 2020 & 2033
Frequently Asked Questions
1. What is the projected Compound Annual Growth Rate (CAGR) of the Emicizumab Injection?
The projected CAGR is approximately 2.9%.
2. Which companies are prominent players in the Emicizumab Injection?
Key companies in the market include Roche Pharma (Schweiz) AG, Chugai Pharmaceutical.
3. What are the main segments of the Emicizumab Injection?
The market segments include Application, Types.
4. Can you provide details about the market size?
The market size is estimated to be USD 12918 million as of 2022.
5. What are some drivers contributing to market growth?
N/A
6. What are the notable trends driving market growth?
N/A
7. Are there any restraints impacting market growth?
N/A
8. Can you provide examples of recent developments in the market?
N/A
9. What pricing options are available for accessing the report?
Pricing options include single-user, multi-user, and enterprise licenses priced at USD 4900.00, USD 7350.00, and USD 9800.00 respectively.
10. Is the market size provided in terms of value or volume?
The market size is provided in terms of value, measured in million.
11. Are there any specific market keywords associated with the report?
Yes, the market keyword associated with the report is "Emicizumab Injection," which aids in identifying and referencing the specific market segment covered.
12. How do I determine which pricing option suits my needs best?
The pricing options vary based on user requirements and access needs. Individual users may opt for single-user licenses, while businesses requiring broader access may choose multi-user or enterprise licenses for cost-effective access to the report.
13. Are there any additional resources or data provided in the Emicizumab Injection report?
While the report offers comprehensive insights, it's advisable to review the specific contents or supplementary materials provided to ascertain if additional resources or data are available.
14. How can I stay updated on further developments or reports in the Emicizumab Injection?
To stay informed about further developments, trends, and reports in the Emicizumab Injection, consider subscribing to industry newsletters, following relevant companies and organizations, or regularly checking reputable industry news sources and publications.
Methodology
Step 1 - Identification of Relevant Samples Size from Population Database


Step 2 - Approaches for Defining Global Market Size (Value, Volume* & Price*)

Note*: In applicable scenarios
Step 3 - Data Sources
Primary Research
- Web Analytics
- Survey Reports
- Research Institute
- Latest Research Reports
- Opinion Leaders
Secondary Research
- Annual Reports
- White Paper
- Latest Press Release
- Industry Association
- Paid Database
- Investor Presentations

Step 4 - Data Triangulation
Involves using different sources of information in order to increase the validity of a study
These sources are likely to be stakeholders in a program - participants, other researchers, program staff, other community members, and so on.
Then we put all data in single framework & apply various statistical tools to find out the dynamic on the market.
During the analysis stage, feedback from the stakeholder groups would be compared to determine areas of agreement as well as areas of divergence