

Key Insights
The global ELISA market is poised for significant expansion, driven by its indispensable role in diagnostics and research. With a current market size estimated at $712.56 million in 2025, the sector is projected to experience robust growth, exhibiting a Compound Annual Growth Rate (CAGR) of 9.6% through 2033. This upward trajectory is primarily fueled by the increasing prevalence of infectious diseases, the growing demand for personalized medicine, and the continuous advancements in biotechnology. Biotechnological companies and medical institutions represent the dominant application segments, leveraging ELISA for a wide array of purposes including drug discovery, disease detection, and quality control. The market is characterized by the demand for both single-mode and multimode ELISA instruments, catering to diverse laboratory needs and throughput requirements. Key players like Thermo Fisher Scientific, Biotek, and Tecan are at the forefront, innovating and expanding their product portfolios to meet evolving market demands. The rising investments in research and development across major economies, coupled with an aging global population susceptible to various chronic conditions, further bolster the market’s growth prospects.
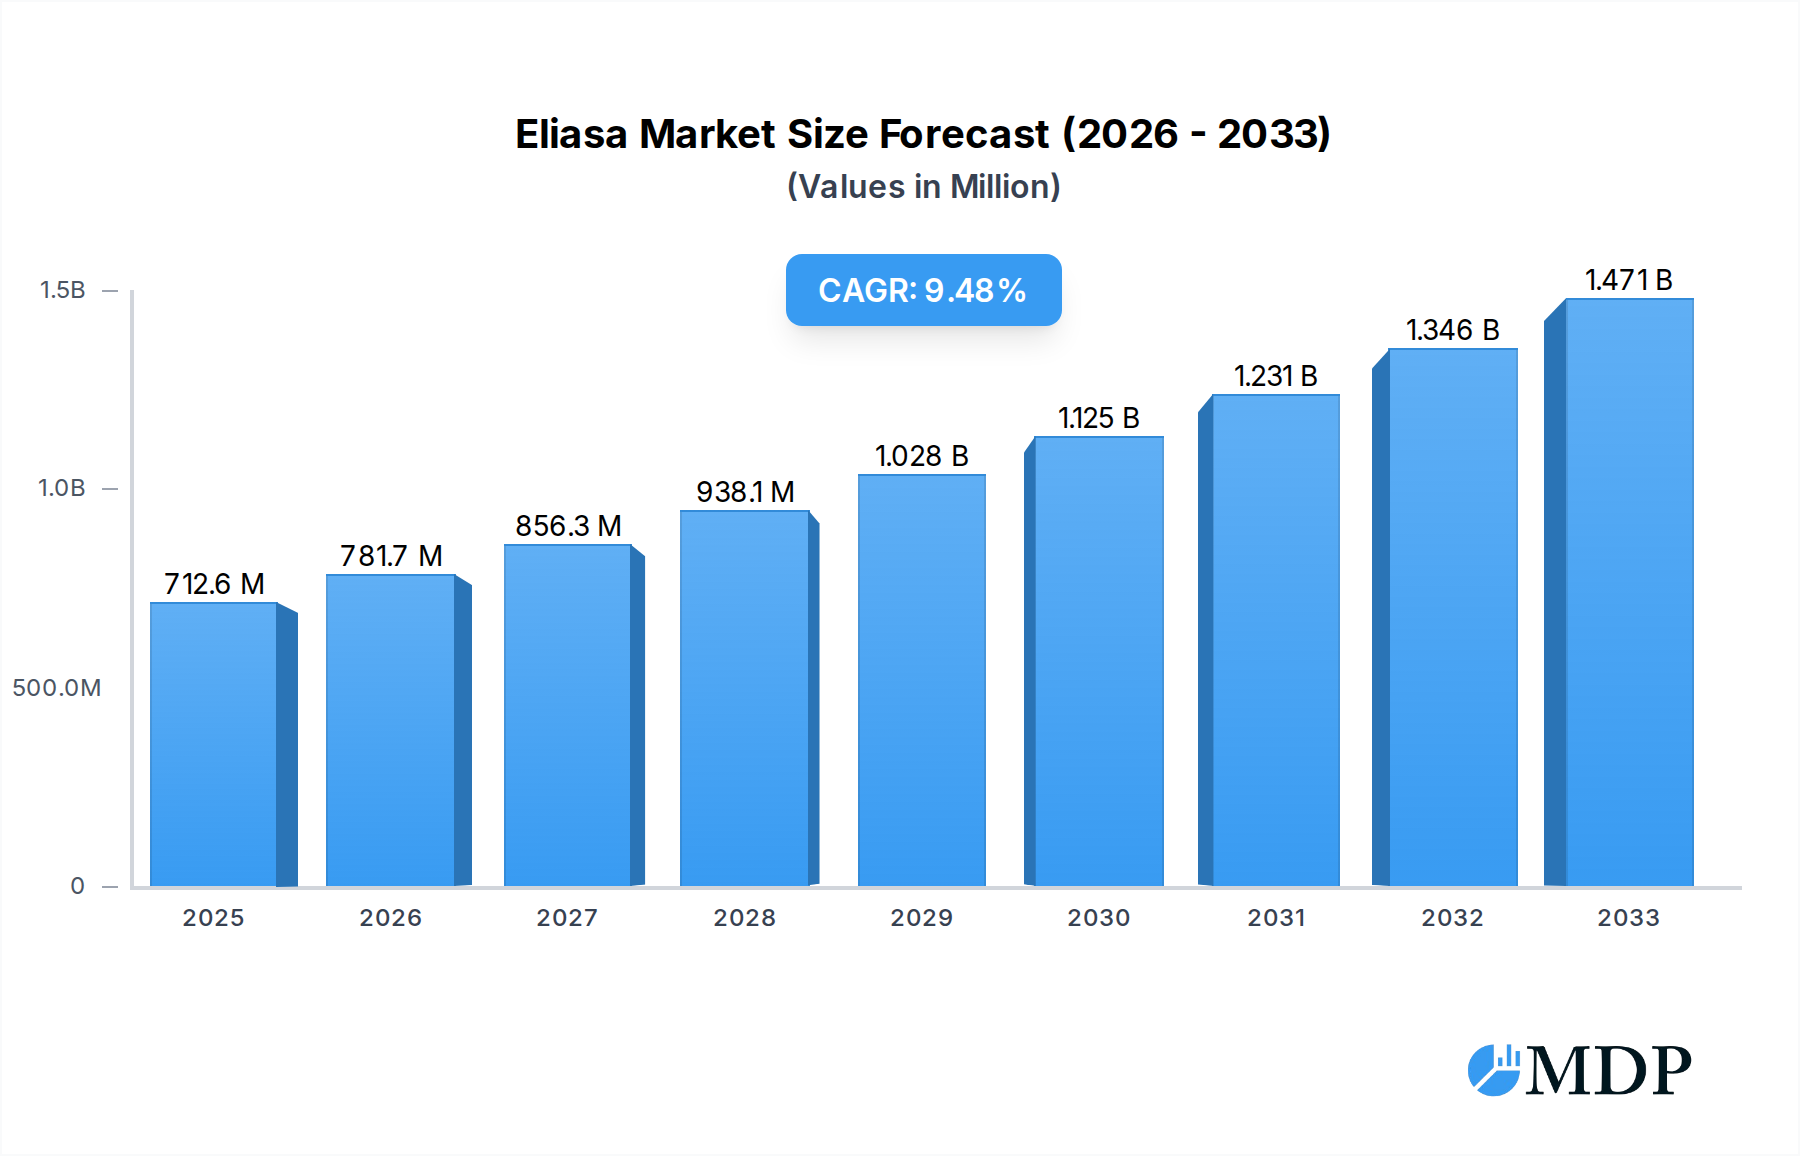
Eliasa Market Size (In Million)
The competitive landscape of the ELISA market is dynamic, featuring a mix of established global players and emerging regional manufacturers. Factors such as technological innovation, product differentiation, and strategic collaborations are crucial for market participants to maintain and enhance their competitive edge. The market's expansion is also supported by an increasing awareness of the benefits of early disease detection and the growing adoption of advanced diagnostic technologies in healthcare systems worldwide. While the market is largely driven by advancements in biotechnological applications and healthcare, potential restraints could include the high initial investment costs associated with advanced ELISA equipment and the stringent regulatory approvals required for new diagnostic kits. Nevertheless, the persistent need for accurate and reliable diagnostic tools, coupled with the expanding research initiatives in life sciences, ensures a positive outlook for the ELISA market, projecting continued growth and innovation in the coming years.

Eliasa Company Market Share
Unveiling the Global Eliasa Market: A Comprehensive Analysis (2019-2033)
This in-depth report provides a definitive analysis of the global Eliasa market, meticulously examining its dynamics, trends, and future trajectory from 2019 to 2033. Focusing on critical market segments, technological advancements, and key industry players, this report offers unparalleled insights for stakeholders in biotechnological companies, medical institutions, and related sectors. With a base year of 2025 and a forecast period extending to 2033, this study leverages historical data from 2019-2024 to deliver robust projections and actionable intelligence.
Eliasa Market Dynamics & Concentration
The global Eliasa market exhibits a moderate to high concentration, with leading players like Biotek, Thermofisher, and Tecan holding significant market share, estimated at over 50 million in combined revenue. Innovation remains a primary driver, fueled by continuous advancements in immunoassay technologies and automation. Regulatory frameworks, such as those governing diagnostic accuracy and data privacy, play a crucial role in shaping market access and product development, with an estimated 20 million in annual compliance costs across key regions. The emergence of advanced analytical techniques and the increasing demand for high-throughput screening are pushing the boundaries of current Eliasa capabilities. Product substitutes, while present in some niche applications, are largely outpaced by the versatility and specificity of Eliasa platforms. End-user trends highlight a growing preference for integrated solutions and cloud-based data management. Mergers and acquisitions (M&A) activity has been steady, with approximately 50 significant deals valued collectively at over 500 million observed during the historical period, indicating strategic consolidation and expansion efforts.
Eliasa Industry Trends & Analysis
The Eliasa industry is poised for substantial growth, projected to achieve a Compound Annual Growth Rate (CAGR) of 9.5% over the forecast period. This expansion is driven by a confluence of factors including the escalating prevalence of chronic diseases, the burgeoning demand for rapid and accurate diagnostic tools, and significant investments in life sciences research and development. Technological disruptions, particularly in areas like automation, microfluidics, and data analytics, are revolutionizing Eliasa capabilities, enabling higher throughput, improved sensitivity, and reduced turnaround times. Consumer preferences are increasingly shifting towards user-friendly interfaces, cost-effective solutions, and data integration for seamless workflow management. Competitive dynamics are intensifying, with established giants and emerging innovators vying for market dominance through product differentiation and strategic collaborations. Market penetration is expected to deepen in both developed and developing economies as healthcare infrastructure improves and awareness of early disease detection grows. The increasing application of Eliasa in drug discovery and development further bolsters market expansion, contributing an estimated 1.2 billion to the overall market value in the coming years. The integration of Artificial Intelligence (AI) and Machine Learning (ML) in data interpretation is also emerging as a key trend, promising to unlock new levels of diagnostic precision and research efficiency. The market is segmented into single-mode and multimode ELIASA systems, with the latter experiencing faster growth due to its versatility.
Leading Markets & Segments in Eliasa
The North America region currently dominates the Eliasa market, driven by robust healthcare spending, advanced research infrastructure, and a high prevalence of diseases requiring advanced diagnostics. Within this region, the United States accounts for a significant portion, estimated at over 30% of the global market.
Application: Biotechnological Companies
- Key Drivers: Significant investments in drug discovery and development, a strong pipeline of novel biologics, and the need for high-throughput screening in R&D processes. The demand for precise protein quantification and immunoassay validation further propels growth.
- Dominance Analysis: Biotechnological companies represent a substantial segment, contributing an estimated 2.5 billion to the Eliasa market. Their reliance on reliable and sensitive assay platforms for validating therapeutic targets and monitoring drug efficacy makes them key adopters of advanced Eliasa technologies. The rapid pace of innovation in this sector necessitates sophisticated analytical tools.
Application: Medical Institutions
- Key Drivers: Increasing adoption of in-vitro diagnostics (IVDs) for patient care, rising demand for early disease detection and monitoring of chronic conditions, and government initiatives to improve healthcare accessibility.
- Dominance Analysis: Medical institutions, including hospitals and diagnostic laboratories, are a cornerstone of the Eliasa market, accounting for an estimated 2.0 billion. The growing emphasis on personalized medicine and the need for accurate biomarker analysis for patient stratification are key factors driving their adoption. Expansion of healthcare facilities in emerging economies further fuels this segment's growth.
Type: Multimode ELIASA
- Key Drivers: Enhanced versatility for performing multiple assay types (absorbance, fluorescence, luminescence), higher throughput capabilities, and suitability for complex research protocols.
- Dominance Analysis: Multimode ELIASA systems are witnessing rapid adoption and are projected to outpace single-mode systems. Their ability to cater to a wider range of applications, from basic research to clinical diagnostics, provides a significant competitive advantage. The estimated market share for multimode systems is over 60% of the total ELIASA instrument market.
Type: Single-mode ELIASA
- Key Drivers: Cost-effectiveness for specific, high-volume applications, simplicity of operation, and reliability for routine diagnostic testing.
- Dominance Analysis: While multimode systems are gaining traction, single-mode ELIASA remains crucial for specific applications where only one detection mode is required. These systems offer a more affordable entry point for smaller laboratories or for dedicated diagnostic tests.
Eliasa Product Developments
Recent Eliasa product developments have focused on enhancing automation, sensitivity, and data integration. Innovations include advanced microplate readers with higher detection limits and faster reading speeds, intuitive software platforms for streamlined data analysis, and integrated robotic systems for complete assay automation. These advancements offer significant competitive advantages by reducing assay times, minimizing human error, and improving reproducibility. The market is also seeing the introduction of smaller, more portable Eliasa devices for point-of-care applications and the development of multiplexing capabilities to analyze multiple analytes simultaneously, further expanding their utility in research and diagnostics. The estimated investment in R&D for new product development is over 300 million annually.
Key Drivers of Eliasa Growth
Several key drivers are propelling the Eliasa market forward. Technologically, advancements in immunoassay formats, detector technologies, and automation are leading to more sensitive and efficient systems. Economically, increased healthcare expenditure globally, particularly in emerging markets, and growing investments in life sciences research are creating substantial demand. Regulatory support for diagnostic innovation and the increasing focus on early disease detection and personalized medicine further catalyze market expansion. For instance, the growing need for infectious disease diagnostics and cancer biomarker identification directly fuels the demand for advanced Eliasa solutions.
Challenges in the Eliasa Market
Despite robust growth, the Eliasa market faces several challenges. Stringent regulatory approval processes for new diagnostic devices can lead to extended time-to-market and significant compliance costs, estimated at 15 million per major market entry. The high initial investment cost of advanced Eliasa systems can be a barrier for smaller institutions. Moreover, the competitive landscape is intensely crowded, necessitating continuous innovation and competitive pricing strategies. Supply chain disruptions, as witnessed in recent years, can impact the availability of critical components and reagents, potentially delaying production and delivery, with an estimated global impact of 50 million on manufacturing output.
Emerging Opportunities in Eliasa
Emerging opportunities in the Eliasa market are abundant, driven by technological breakthroughs and evolving healthcare needs. The integration of AI and machine learning for advanced data interpretation and predictive diagnostics represents a significant growth catalyst, promising to unlock new diagnostic insights. Strategic partnerships between instrument manufacturers and diagnostic reagent developers are crucial for creating comprehensive solutions. Furthermore, the expansion of healthcare infrastructure and diagnostics in underserved regions presents a vast untapped market. The growing demand for multiplexed assays and point-of-care testing solutions also opens up new avenues for innovation and market penetration. The estimated potential for AI-driven Eliasa applications is over 800 million in the coming decade.
Leading Players in the Eliasa Sector
- Biotek
- Thermofisher
- Tecan
- MD
- PerkinElmer
- BMG LABTECH
- BIO-RAD
- Bio-dl
- Biochrom
- Awareness
- Safeda
- Perlong
- Rayto
- Autobio
- Sunostik
- Tianshi
- Sinothinke
- Shanpu
- Caihong
- KHB
Key Milestones in Eliasa Industry
- 2019: Launch of next-generation microplate readers with enhanced sensitivity and speed.
- 2020: Increased demand for Eliasa in infectious disease research and diagnostics due to global health events.
- 2021: Significant M&A activity as larger players acquire innovative smaller companies to expand their portfolios.
- 2022: Introduction of AI-powered data analysis software for Eliasa platforms, improving diagnostic accuracy.
- 2023: Growing adoption of fully automated Eliasa workflows in clinical laboratories.
- 2024: Expansion of multiplexing capabilities in Eliasa systems for simultaneous detection of multiple biomarkers.
- 2025 (Estimated): Development of portable and low-cost Eliasa devices for point-of-care applications.
- 2026-2030 (Forecast): Widespread integration of cloud-based Eliasa data management and remote diagnostics.
- 2031-2033 (Forecast): Advanced personalized medicine applications enabled by highly sensitive and specific Eliasa assays.
Strategic Outlook for Eliasa Market
The strategic outlook for the Eliasa market is overwhelmingly positive, characterized by sustained growth and significant opportunities. Key growth accelerators include the continuous drive for automation, the increasing integration of advanced data analytics, and the expansion into emerging markets. Companies that focus on developing user-friendly, cost-effective, and highly sensitive Eliasa solutions with strong multiplexing capabilities will be well-positioned for success. Strategic collaborations with reagent manufacturers and a focus on addressing unmet needs in personalized medicine and early disease detection will be paramount. The market's future hinges on innovation that enhances diagnostic precision, reduces turnaround times, and provides seamless data integration, ultimately contributing to improved patient outcomes and advancements in scientific research. The estimated market potential for strategic growth initiatives is over 4.0 billion.
Eliasa Segmentation
-
1. Application
- 1.1. Biotechnological Companies
- 1.2. Medical Institutions
-
2. Type
- 2.1. Single-mode ELIASA
- 2.2. Multimode ELIASA
Eliasa Segmentation By Geography
-
1. North America
- 1.1. United States
- 1.2. Canada
- 1.3. Mexico
-
2. South America
- 2.1. Brazil
- 2.2. Argentina
- 2.3. Rest of South America
-
3. Europe
- 3.1. United Kingdom
- 3.2. Germany
- 3.3. France
- 3.4. Italy
- 3.5. Spain
- 3.6. Russia
- 3.7. Benelux
- 3.8. Nordics
- 3.9. Rest of Europe
-
4. Middle East & Africa
- 4.1. Turkey
- 4.2. Israel
- 4.3. GCC
- 4.4. North Africa
- 4.5. South Africa
- 4.6. Rest of Middle East & Africa
-
5. Asia Pacific
- 5.1. China
- 5.2. India
- 5.3. Japan
- 5.4. South Korea
- 5.5. ASEAN
- 5.6. Oceania
- 5.7. Rest of Asia Pacific
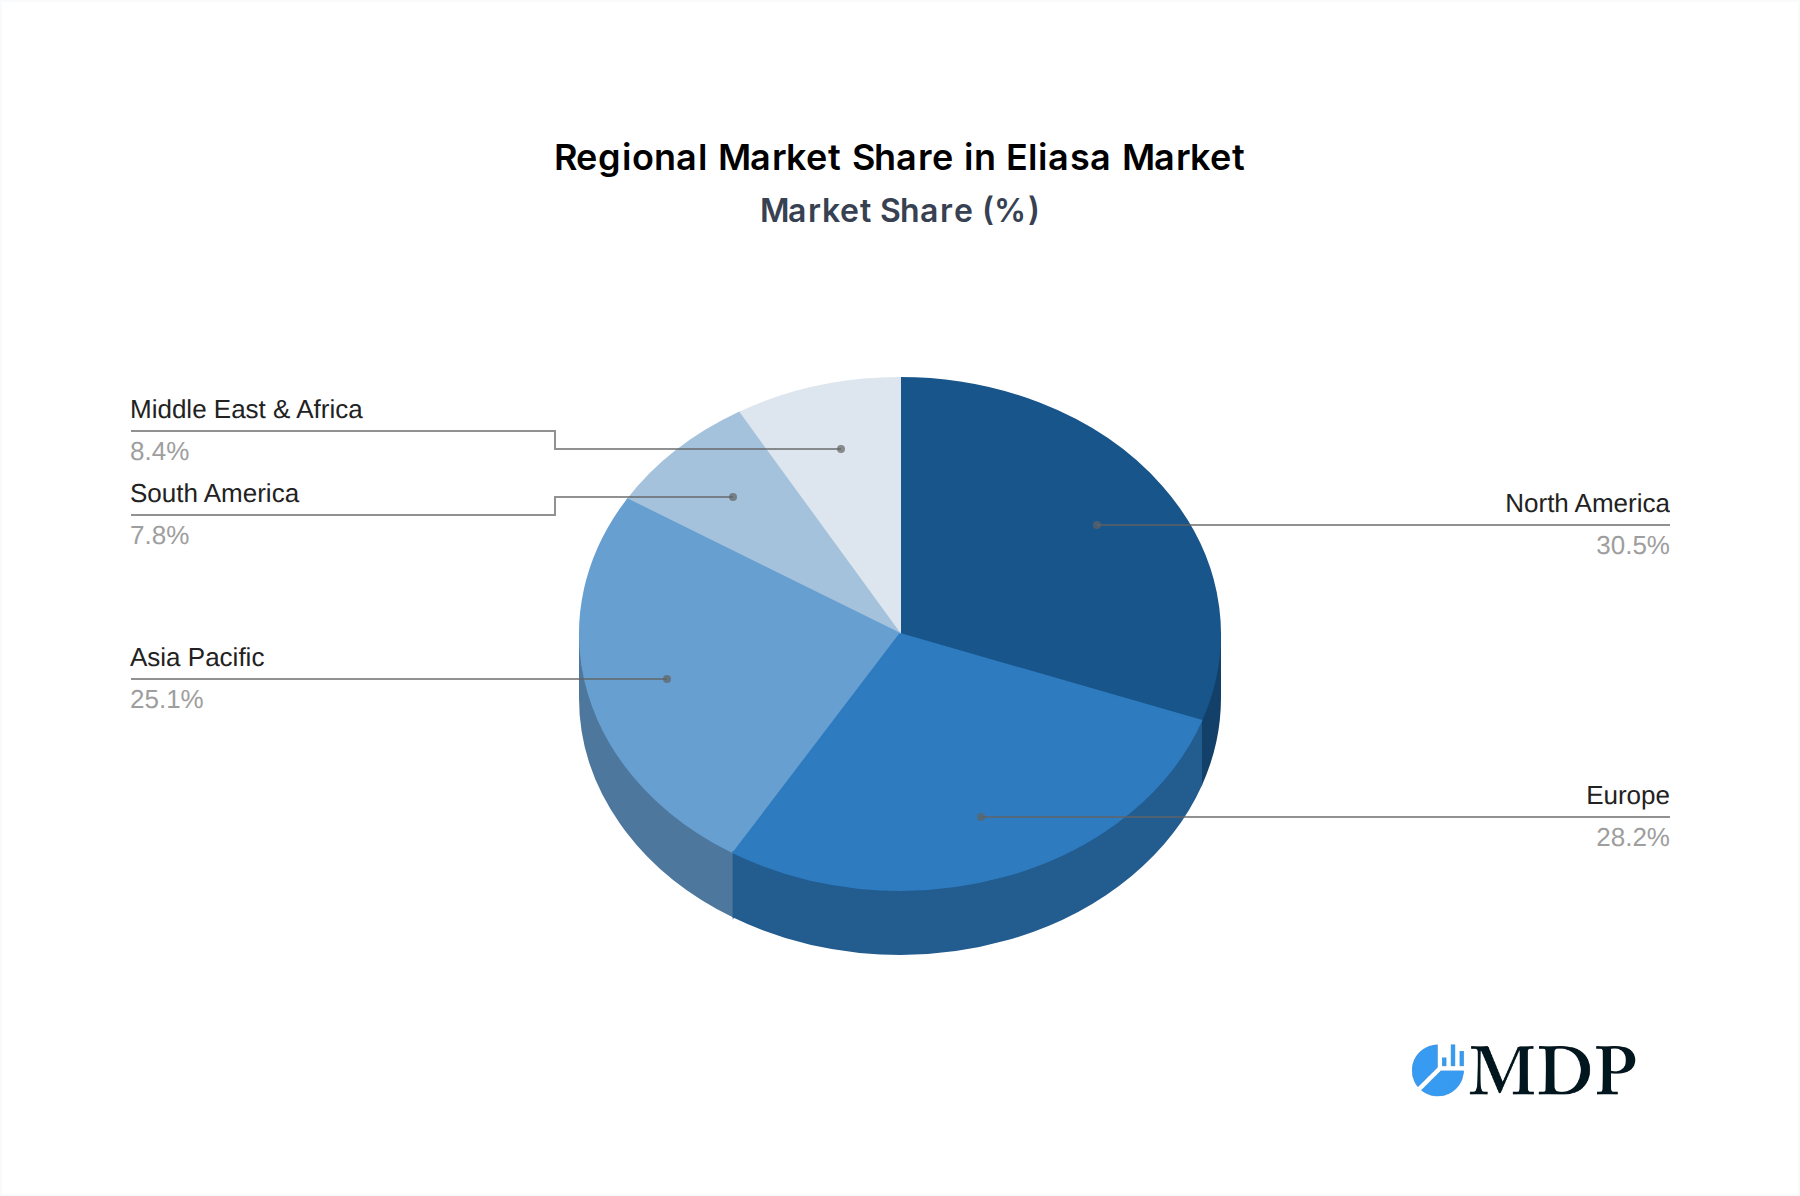
Eliasa Regional Market Share
Geographic Coverage of Eliasa
Eliasa REPORT HIGHLIGHTS
| Aspects | Details |
|---|---|
| Study Period | 2020-2034 |
| Base Year | 2025 |
| Estimated Year | 2026 |
| Forecast Period | 2026-2034 |
| Historical Period | 2020-2025 |
| Growth Rate | CAGR of 9.6% from 2020-2034 |
| Segmentation |
|
Table of Contents
- 1. Introduction
- 1.1. Research Scope
- 1.2. Market Segmentation
- 1.3. Research Methodology
- 1.4. Definitions and Assumptions
- 2. Executive Summary
- 2.1. Introduction
- 3. Market Dynamics
- 3.1. Introduction
- 3.2. Market Drivers
- 3.3. Market Restrains
- 3.4. Market Trends
- 4. Market Factor Analysis
- 4.1. Porters Five Forces
- 4.2. Supply/Value Chain
- 4.3. PESTEL analysis
- 4.4. Market Entropy
- 4.5. Patent/Trademark Analysis
- 5. Global Eliasa Analysis, Insights and Forecast, 2020-2032
- 5.1. Market Analysis, Insights and Forecast - by Application
- 5.1.1. Biotechnological Companies
- 5.1.2. Medical Institutions
- 5.2. Market Analysis, Insights and Forecast - by Type
- 5.2.1. Single-mode ELIASA
- 5.2.2. Multimode ELIASA
- 5.3. Market Analysis, Insights and Forecast - by Region
- 5.3.1. North America
- 5.3.2. South America
- 5.3.3. Europe
- 5.3.4. Middle East & Africa
- 5.3.5. Asia Pacific
- 5.1. Market Analysis, Insights and Forecast - by Application
- 6. North America Eliasa Analysis, Insights and Forecast, 2020-2032
- 6.1. Market Analysis, Insights and Forecast - by Application
- 6.1.1. Biotechnological Companies
- 6.1.2. Medical Institutions
- 6.2. Market Analysis, Insights and Forecast - by Type
- 6.2.1. Single-mode ELIASA
- 6.2.2. Multimode ELIASA
- 6.1. Market Analysis, Insights and Forecast - by Application
- 7. South America Eliasa Analysis, Insights and Forecast, 2020-2032
- 7.1. Market Analysis, Insights and Forecast - by Application
- 7.1.1. Biotechnological Companies
- 7.1.2. Medical Institutions
- 7.2. Market Analysis, Insights and Forecast - by Type
- 7.2.1. Single-mode ELIASA
- 7.2.2. Multimode ELIASA
- 7.1. Market Analysis, Insights and Forecast - by Application
- 8. Europe Eliasa Analysis, Insights and Forecast, 2020-2032
- 8.1. Market Analysis, Insights and Forecast - by Application
- 8.1.1. Biotechnological Companies
- 8.1.2. Medical Institutions
- 8.2. Market Analysis, Insights and Forecast - by Type
- 8.2.1. Single-mode ELIASA
- 8.2.2. Multimode ELIASA
- 8.1. Market Analysis, Insights and Forecast - by Application
- 9. Middle East & Africa Eliasa Analysis, Insights and Forecast, 2020-2032
- 9.1. Market Analysis, Insights and Forecast - by Application
- 9.1.1. Biotechnological Companies
- 9.1.2. Medical Institutions
- 9.2. Market Analysis, Insights and Forecast - by Type
- 9.2.1. Single-mode ELIASA
- 9.2.2. Multimode ELIASA
- 9.1. Market Analysis, Insights and Forecast - by Application
- 10. Asia Pacific Eliasa Analysis, Insights and Forecast, 2020-2032
- 10.1. Market Analysis, Insights and Forecast - by Application
- 10.1.1. Biotechnological Companies
- 10.1.2. Medical Institutions
- 10.2. Market Analysis, Insights and Forecast - by Type
- 10.2.1. Single-mode ELIASA
- 10.2.2. Multimode ELIASA
- 10.1. Market Analysis, Insights and Forecast - by Application
- 11. Competitive Analysis
- 11.1. Global Market Share Analysis 2025
- 11.2. Company Profiles
- 11.2.1 Biotek
- 11.2.1.1. Overview
- 11.2.1.2. Products
- 11.2.1.3. SWOT Analysis
- 11.2.1.4. Recent Developments
- 11.2.1.5. Financials (Based on Availability)
- 11.2.2 Thermofisher
- 11.2.2.1. Overview
- 11.2.2.2. Products
- 11.2.2.3. SWOT Analysis
- 11.2.2.4. Recent Developments
- 11.2.2.5. Financials (Based on Availability)
- 11.2.3 Tecan
- 11.2.3.1. Overview
- 11.2.3.2. Products
- 11.2.3.3. SWOT Analysis
- 11.2.3.4. Recent Developments
- 11.2.3.5. Financials (Based on Availability)
- 11.2.4 MD
- 11.2.4.1. Overview
- 11.2.4.2. Products
- 11.2.4.3. SWOT Analysis
- 11.2.4.4. Recent Developments
- 11.2.4.5. Financials (Based on Availability)
- 11.2.5 PerkinElmer
- 11.2.5.1. Overview
- 11.2.5.2. Products
- 11.2.5.3. SWOT Analysis
- 11.2.5.4. Recent Developments
- 11.2.5.5. Financials (Based on Availability)
- 11.2.6 BMG LABTECH
- 11.2.6.1. Overview
- 11.2.6.2. Products
- 11.2.6.3. SWOT Analysis
- 11.2.6.4. Recent Developments
- 11.2.6.5. Financials (Based on Availability)
- 11.2.7 BIO-RAD
- 11.2.7.1. Overview
- 11.2.7.2. Products
- 11.2.7.3. SWOT Analysis
- 11.2.7.4. Recent Developments
- 11.2.7.5. Financials (Based on Availability)
- 11.2.8 Bio-dl
- 11.2.8.1. Overview
- 11.2.8.2. Products
- 11.2.8.3. SWOT Analysis
- 11.2.8.4. Recent Developments
- 11.2.8.5. Financials (Based on Availability)
- 11.2.9 Biochrom
- 11.2.9.1. Overview
- 11.2.9.2. Products
- 11.2.9.3. SWOT Analysis
- 11.2.9.4. Recent Developments
- 11.2.9.5. Financials (Based on Availability)
- 11.2.10 Awareness
- 11.2.10.1. Overview
- 11.2.10.2. Products
- 11.2.10.3. SWOT Analysis
- 11.2.10.4. Recent Developments
- 11.2.10.5. Financials (Based on Availability)
- 11.2.11 Safeda
- 11.2.11.1. Overview
- 11.2.11.2. Products
- 11.2.11.3. SWOT Analysis
- 11.2.11.4. Recent Developments
- 11.2.11.5. Financials (Based on Availability)
- 11.2.12 Perlong
- 11.2.12.1. Overview
- 11.2.12.2. Products
- 11.2.12.3. SWOT Analysis
- 11.2.12.4. Recent Developments
- 11.2.12.5. Financials (Based on Availability)
- 11.2.13 Rayto
- 11.2.13.1. Overview
- 11.2.13.2. Products
- 11.2.13.3. SWOT Analysis
- 11.2.13.4. Recent Developments
- 11.2.13.5. Financials (Based on Availability)
- 11.2.14 Autobio
- 11.2.14.1. Overview
- 11.2.14.2. Products
- 11.2.14.3. SWOT Analysis
- 11.2.14.4. Recent Developments
- 11.2.14.5. Financials (Based on Availability)
- 11.2.15 Sunostik
- 11.2.15.1. Overview
- 11.2.15.2. Products
- 11.2.15.3. SWOT Analysis
- 11.2.15.4. Recent Developments
- 11.2.15.5. Financials (Based on Availability)
- 11.2.16 Tianshi
- 11.2.16.1. Overview
- 11.2.16.2. Products
- 11.2.16.3. SWOT Analysis
- 11.2.16.4. Recent Developments
- 11.2.16.5. Financials (Based on Availability)
- 11.2.17 Sinothinke
- 11.2.17.1. Overview
- 11.2.17.2. Products
- 11.2.17.3. SWOT Analysis
- 11.2.17.4. Recent Developments
- 11.2.17.5. Financials (Based on Availability)
- 11.2.18 Shanpu
- 11.2.18.1. Overview
- 11.2.18.2. Products
- 11.2.18.3. SWOT Analysis
- 11.2.18.4. Recent Developments
- 11.2.18.5. Financials (Based on Availability)
- 11.2.19 Caihong
- 11.2.19.1. Overview
- 11.2.19.2. Products
- 11.2.19.3. SWOT Analysis
- 11.2.19.4. Recent Developments
- 11.2.19.5. Financials (Based on Availability)
- 11.2.20 KHB
- 11.2.20.1. Overview
- 11.2.20.2. Products
- 11.2.20.3. SWOT Analysis
- 11.2.20.4. Recent Developments
- 11.2.20.5. Financials (Based on Availability)
- 11.2.1 Biotek
List of Figures
- Figure 1: Global Eliasa Revenue Breakdown (undefined, %) by Region 2025 & 2033
- Figure 2: Global Eliasa Volume Breakdown (K, %) by Region 2025 & 2033
- Figure 3: North America Eliasa Revenue (undefined), by Application 2025 & 2033
- Figure 4: North America Eliasa Volume (K), by Application 2025 & 2033
- Figure 5: North America Eliasa Revenue Share (%), by Application 2025 & 2033
- Figure 6: North America Eliasa Volume Share (%), by Application 2025 & 2033
- Figure 7: North America Eliasa Revenue (undefined), by Type 2025 & 2033
- Figure 8: North America Eliasa Volume (K), by Type 2025 & 2033
- Figure 9: North America Eliasa Revenue Share (%), by Type 2025 & 2033
- Figure 10: North America Eliasa Volume Share (%), by Type 2025 & 2033
- Figure 11: North America Eliasa Revenue (undefined), by Country 2025 & 2033
- Figure 12: North America Eliasa Volume (K), by Country 2025 & 2033
- Figure 13: North America Eliasa Revenue Share (%), by Country 2025 & 2033
- Figure 14: North America Eliasa Volume Share (%), by Country 2025 & 2033
- Figure 15: South America Eliasa Revenue (undefined), by Application 2025 & 2033
- Figure 16: South America Eliasa Volume (K), by Application 2025 & 2033
- Figure 17: South America Eliasa Revenue Share (%), by Application 2025 & 2033
- Figure 18: South America Eliasa Volume Share (%), by Application 2025 & 2033
- Figure 19: South America Eliasa Revenue (undefined), by Type 2025 & 2033
- Figure 20: South America Eliasa Volume (K), by Type 2025 & 2033
- Figure 21: South America Eliasa Revenue Share (%), by Type 2025 & 2033
- Figure 22: South America Eliasa Volume Share (%), by Type 2025 & 2033
- Figure 23: South America Eliasa Revenue (undefined), by Country 2025 & 2033
- Figure 24: South America Eliasa Volume (K), by Country 2025 & 2033
- Figure 25: South America Eliasa Revenue Share (%), by Country 2025 & 2033
- Figure 26: South America Eliasa Volume Share (%), by Country 2025 & 2033
- Figure 27: Europe Eliasa Revenue (undefined), by Application 2025 & 2033
- Figure 28: Europe Eliasa Volume (K), by Application 2025 & 2033
- Figure 29: Europe Eliasa Revenue Share (%), by Application 2025 & 2033
- Figure 30: Europe Eliasa Volume Share (%), by Application 2025 & 2033
- Figure 31: Europe Eliasa Revenue (undefined), by Type 2025 & 2033
- Figure 32: Europe Eliasa Volume (K), by Type 2025 & 2033
- Figure 33: Europe Eliasa Revenue Share (%), by Type 2025 & 2033
- Figure 34: Europe Eliasa Volume Share (%), by Type 2025 & 2033
- Figure 35: Europe Eliasa Revenue (undefined), by Country 2025 & 2033
- Figure 36: Europe Eliasa Volume (K), by Country 2025 & 2033
- Figure 37: Europe Eliasa Revenue Share (%), by Country 2025 & 2033
- Figure 38: Europe Eliasa Volume Share (%), by Country 2025 & 2033
- Figure 39: Middle East & Africa Eliasa Revenue (undefined), by Application 2025 & 2033
- Figure 40: Middle East & Africa Eliasa Volume (K), by Application 2025 & 2033
- Figure 41: Middle East & Africa Eliasa Revenue Share (%), by Application 2025 & 2033
- Figure 42: Middle East & Africa Eliasa Volume Share (%), by Application 2025 & 2033
- Figure 43: Middle East & Africa Eliasa Revenue (undefined), by Type 2025 & 2033
- Figure 44: Middle East & Africa Eliasa Volume (K), by Type 2025 & 2033
- Figure 45: Middle East & Africa Eliasa Revenue Share (%), by Type 2025 & 2033
- Figure 46: Middle East & Africa Eliasa Volume Share (%), by Type 2025 & 2033
- Figure 47: Middle East & Africa Eliasa Revenue (undefined), by Country 2025 & 2033
- Figure 48: Middle East & Africa Eliasa Volume (K), by Country 2025 & 2033
- Figure 49: Middle East & Africa Eliasa Revenue Share (%), by Country 2025 & 2033
- Figure 50: Middle East & Africa Eliasa Volume Share (%), by Country 2025 & 2033
- Figure 51: Asia Pacific Eliasa Revenue (undefined), by Application 2025 & 2033
- Figure 52: Asia Pacific Eliasa Volume (K), by Application 2025 & 2033
- Figure 53: Asia Pacific Eliasa Revenue Share (%), by Application 2025 & 2033
- Figure 54: Asia Pacific Eliasa Volume Share (%), by Application 2025 & 2033
- Figure 55: Asia Pacific Eliasa Revenue (undefined), by Type 2025 & 2033
- Figure 56: Asia Pacific Eliasa Volume (K), by Type 2025 & 2033
- Figure 57: Asia Pacific Eliasa Revenue Share (%), by Type 2025 & 2033
- Figure 58: Asia Pacific Eliasa Volume Share (%), by Type 2025 & 2033
- Figure 59: Asia Pacific Eliasa Revenue (undefined), by Country 2025 & 2033
- Figure 60: Asia Pacific Eliasa Volume (K), by Country 2025 & 2033
- Figure 61: Asia Pacific Eliasa Revenue Share (%), by Country 2025 & 2033
- Figure 62: Asia Pacific Eliasa Volume Share (%), by Country 2025 & 2033
List of Tables
- Table 1: Global Eliasa Revenue undefined Forecast, by Application 2020 & 2033
- Table 2: Global Eliasa Volume K Forecast, by Application 2020 & 2033
- Table 3: Global Eliasa Revenue undefined Forecast, by Type 2020 & 2033
- Table 4: Global Eliasa Volume K Forecast, by Type 2020 & 2033
- Table 5: Global Eliasa Revenue undefined Forecast, by Region 2020 & 2033
- Table 6: Global Eliasa Volume K Forecast, by Region 2020 & 2033
- Table 7: Global Eliasa Revenue undefined Forecast, by Application 2020 & 2033
- Table 8: Global Eliasa Volume K Forecast, by Application 2020 & 2033
- Table 9: Global Eliasa Revenue undefined Forecast, by Type 2020 & 2033
- Table 10: Global Eliasa Volume K Forecast, by Type 2020 & 2033
- Table 11: Global Eliasa Revenue undefined Forecast, by Country 2020 & 2033
- Table 12: Global Eliasa Volume K Forecast, by Country 2020 & 2033
- Table 13: United States Eliasa Revenue (undefined) Forecast, by Application 2020 & 2033
- Table 14: United States Eliasa Volume (K) Forecast, by Application 2020 & 2033
- Table 15: Canada Eliasa Revenue (undefined) Forecast, by Application 2020 & 2033
- Table 16: Canada Eliasa Volume (K) Forecast, by Application 2020 & 2033
- Table 17: Mexico Eliasa Revenue (undefined) Forecast, by Application 2020 & 2033
- Table 18: Mexico Eliasa Volume (K) Forecast, by Application 2020 & 2033
- Table 19: Global Eliasa Revenue undefined Forecast, by Application 2020 & 2033
- Table 20: Global Eliasa Volume K Forecast, by Application 2020 & 2033
- Table 21: Global Eliasa Revenue undefined Forecast, by Type 2020 & 2033
- Table 22: Global Eliasa Volume K Forecast, by Type 2020 & 2033
- Table 23: Global Eliasa Revenue undefined Forecast, by Country 2020 & 2033
- Table 24: Global Eliasa Volume K Forecast, by Country 2020 & 2033
- Table 25: Brazil Eliasa Revenue (undefined) Forecast, by Application 2020 & 2033
- Table 26: Brazil Eliasa Volume (K) Forecast, by Application 2020 & 2033
- Table 27: Argentina Eliasa Revenue (undefined) Forecast, by Application 2020 & 2033
- Table 28: Argentina Eliasa Volume (K) Forecast, by Application 2020 & 2033
- Table 29: Rest of South America Eliasa Revenue (undefined) Forecast, by Application 2020 & 2033
- Table 30: Rest of South America Eliasa Volume (K) Forecast, by Application 2020 & 2033
- Table 31: Global Eliasa Revenue undefined Forecast, by Application 2020 & 2033
- Table 32: Global Eliasa Volume K Forecast, by Application 2020 & 2033
- Table 33: Global Eliasa Revenue undefined Forecast, by Type 2020 & 2033
- Table 34: Global Eliasa Volume K Forecast, by Type 2020 & 2033
- Table 35: Global Eliasa Revenue undefined Forecast, by Country 2020 & 2033
- Table 36: Global Eliasa Volume K Forecast, by Country 2020 & 2033
- Table 37: United Kingdom Eliasa Revenue (undefined) Forecast, by Application 2020 & 2033
- Table 38: United Kingdom Eliasa Volume (K) Forecast, by Application 2020 & 2033
- Table 39: Germany Eliasa Revenue (undefined) Forecast, by Application 2020 & 2033
- Table 40: Germany Eliasa Volume (K) Forecast, by Application 2020 & 2033
- Table 41: France Eliasa Revenue (undefined) Forecast, by Application 2020 & 2033
- Table 42: France Eliasa Volume (K) Forecast, by Application 2020 & 2033
- Table 43: Italy Eliasa Revenue (undefined) Forecast, by Application 2020 & 2033
- Table 44: Italy Eliasa Volume (K) Forecast, by Application 2020 & 2033
- Table 45: Spain Eliasa Revenue (undefined) Forecast, by Application 2020 & 2033
- Table 46: Spain Eliasa Volume (K) Forecast, by Application 2020 & 2033
- Table 47: Russia Eliasa Revenue (undefined) Forecast, by Application 2020 & 2033
- Table 48: Russia Eliasa Volume (K) Forecast, by Application 2020 & 2033
- Table 49: Benelux Eliasa Revenue (undefined) Forecast, by Application 2020 & 2033
- Table 50: Benelux Eliasa Volume (K) Forecast, by Application 2020 & 2033
- Table 51: Nordics Eliasa Revenue (undefined) Forecast, by Application 2020 & 2033
- Table 52: Nordics Eliasa Volume (K) Forecast, by Application 2020 & 2033
- Table 53: Rest of Europe Eliasa Revenue (undefined) Forecast, by Application 2020 & 2033
- Table 54: Rest of Europe Eliasa Volume (K) Forecast, by Application 2020 & 2033
- Table 55: Global Eliasa Revenue undefined Forecast, by Application 2020 & 2033
- Table 56: Global Eliasa Volume K Forecast, by Application 2020 & 2033
- Table 57: Global Eliasa Revenue undefined Forecast, by Type 2020 & 2033
- Table 58: Global Eliasa Volume K Forecast, by Type 2020 & 2033
- Table 59: Global Eliasa Revenue undefined Forecast, by Country 2020 & 2033
- Table 60: Global Eliasa Volume K Forecast, by Country 2020 & 2033
- Table 61: Turkey Eliasa Revenue (undefined) Forecast, by Application 2020 & 2033
- Table 62: Turkey Eliasa Volume (K) Forecast, by Application 2020 & 2033
- Table 63: Israel Eliasa Revenue (undefined) Forecast, by Application 2020 & 2033
- Table 64: Israel Eliasa Volume (K) Forecast, by Application 2020 & 2033
- Table 65: GCC Eliasa Revenue (undefined) Forecast, by Application 2020 & 2033
- Table 66: GCC Eliasa Volume (K) Forecast, by Application 2020 & 2033
- Table 67: North Africa Eliasa Revenue (undefined) Forecast, by Application 2020 & 2033
- Table 68: North Africa Eliasa Volume (K) Forecast, by Application 2020 & 2033
- Table 69: South Africa Eliasa Revenue (undefined) Forecast, by Application 2020 & 2033
- Table 70: South Africa Eliasa Volume (K) Forecast, by Application 2020 & 2033
- Table 71: Rest of Middle East & Africa Eliasa Revenue (undefined) Forecast, by Application 2020 & 2033
- Table 72: Rest of Middle East & Africa Eliasa Volume (K) Forecast, by Application 2020 & 2033
- Table 73: Global Eliasa Revenue undefined Forecast, by Application 2020 & 2033
- Table 74: Global Eliasa Volume K Forecast, by Application 2020 & 2033
- Table 75: Global Eliasa Revenue undefined Forecast, by Type 2020 & 2033
- Table 76: Global Eliasa Volume K Forecast, by Type 2020 & 2033
- Table 77: Global Eliasa Revenue undefined Forecast, by Country 2020 & 2033
- Table 78: Global Eliasa Volume K Forecast, by Country 2020 & 2033
- Table 79: China Eliasa Revenue (undefined) Forecast, by Application 2020 & 2033
- Table 80: China Eliasa Volume (K) Forecast, by Application 2020 & 2033
- Table 81: India Eliasa Revenue (undefined) Forecast, by Application 2020 & 2033
- Table 82: India Eliasa Volume (K) Forecast, by Application 2020 & 2033
- Table 83: Japan Eliasa Revenue (undefined) Forecast, by Application 2020 & 2033
- Table 84: Japan Eliasa Volume (K) Forecast, by Application 2020 & 2033
- Table 85: South Korea Eliasa Revenue (undefined) Forecast, by Application 2020 & 2033
- Table 86: South Korea Eliasa Volume (K) Forecast, by Application 2020 & 2033
- Table 87: ASEAN Eliasa Revenue (undefined) Forecast, by Application 2020 & 2033
- Table 88: ASEAN Eliasa Volume (K) Forecast, by Application 2020 & 2033
- Table 89: Oceania Eliasa Revenue (undefined) Forecast, by Application 2020 & 2033
- Table 90: Oceania Eliasa Volume (K) Forecast, by Application 2020 & 2033
- Table 91: Rest of Asia Pacific Eliasa Revenue (undefined) Forecast, by Application 2020 & 2033
- Table 92: Rest of Asia Pacific Eliasa Volume (K) Forecast, by Application 2020 & 2033
Frequently Asked Questions
1. What is the projected Compound Annual Growth Rate (CAGR) of the Eliasa?
The projected CAGR is approximately 9.6%.
2. Which companies are prominent players in the Eliasa?
Key companies in the market include Biotek, Thermofisher, Tecan, MD, PerkinElmer, BMG LABTECH, BIO-RAD, Bio-dl, Biochrom, Awareness, Safeda, Perlong, Rayto, Autobio, Sunostik, Tianshi, Sinothinke, Shanpu, Caihong, KHB.
3. What are the main segments of the Eliasa?
The market segments include Application, Type.
4. Can you provide details about the market size?
The market size is estimated to be USD XXX N/A as of 2022.
5. What are some drivers contributing to market growth?
N/A
6. What are the notable trends driving market growth?
N/A
7. Are there any restraints impacting market growth?
N/A
8. Can you provide examples of recent developments in the market?
N/A
9. What pricing options are available for accessing the report?
Pricing options include single-user, multi-user, and enterprise licenses priced at USD 3950.00, USD 5925.00, and USD 7900.00 respectively.
10. Is the market size provided in terms of value or volume?
The market size is provided in terms of value, measured in N/A and volume, measured in K.
11. Are there any specific market keywords associated with the report?
Yes, the market keyword associated with the report is "Eliasa," which aids in identifying and referencing the specific market segment covered.
12. How do I determine which pricing option suits my needs best?
The pricing options vary based on user requirements and access needs. Individual users may opt for single-user licenses, while businesses requiring broader access may choose multi-user or enterprise licenses for cost-effective access to the report.
13. Are there any additional resources or data provided in the Eliasa report?
While the report offers comprehensive insights, it's advisable to review the specific contents or supplementary materials provided to ascertain if additional resources or data are available.
14. How can I stay updated on further developments or reports in the Eliasa?
To stay informed about further developments, trends, and reports in the Eliasa, consider subscribing to industry newsletters, following relevant companies and organizations, or regularly checking reputable industry news sources and publications.
Methodology
Step 1 - Identification of Relevant Samples Size from Population Database


Step 2 - Approaches for Defining Global Market Size (Value, Volume* & Price*)

Note*: In applicable scenarios
Step 3 - Data Sources
Primary Research
- Web Analytics
- Survey Reports
- Research Institute
- Latest Research Reports
- Opinion Leaders
Secondary Research
- Annual Reports
- White Paper
- Latest Press Release
- Industry Association
- Paid Database
- Investor Presentations

Step 4 - Data Triangulation
Involves using different sources of information in order to increase the validity of a study
These sources are likely to be stakeholders in a program - participants, other researchers, program staff, other community members, and so on.
Then we put all data in single framework & apply various statistical tools to find out the dynamic on the market.
During the analysis stage, feedback from the stakeholder groups would be compared to determine areas of agreement as well as areas of divergence