

Key Insights
The global Electromyography (EMG) Equipment market is poised for significant expansion, projected to reach an estimated $1.83 billion in 2025. This robust growth trajectory is driven by a CAGR of 6.72% anticipated over the forecast period of 2025-2033. A primary catalyst for this market surge is the increasing prevalence of neurological disorders and neuromuscular conditions such as carpal tunnel syndrome, peripheral neuropathy, and amyotrophic lateral sclerosis (ALS). The growing demand for accurate and early diagnosis of these conditions fuels the adoption of advanced EMG equipment. Furthermore, technological advancements are playing a crucial role, with manufacturers introducing innovative, user-friendly, and high-performance EMG systems. The integration of AI and machine learning for improved data analysis and interpretation is a key trend, enhancing diagnostic precision and workflow efficiency for healthcare professionals. Expansion of healthcare infrastructure, particularly in emerging economies, and increased healthcare spending also contribute to the market's upward momentum.
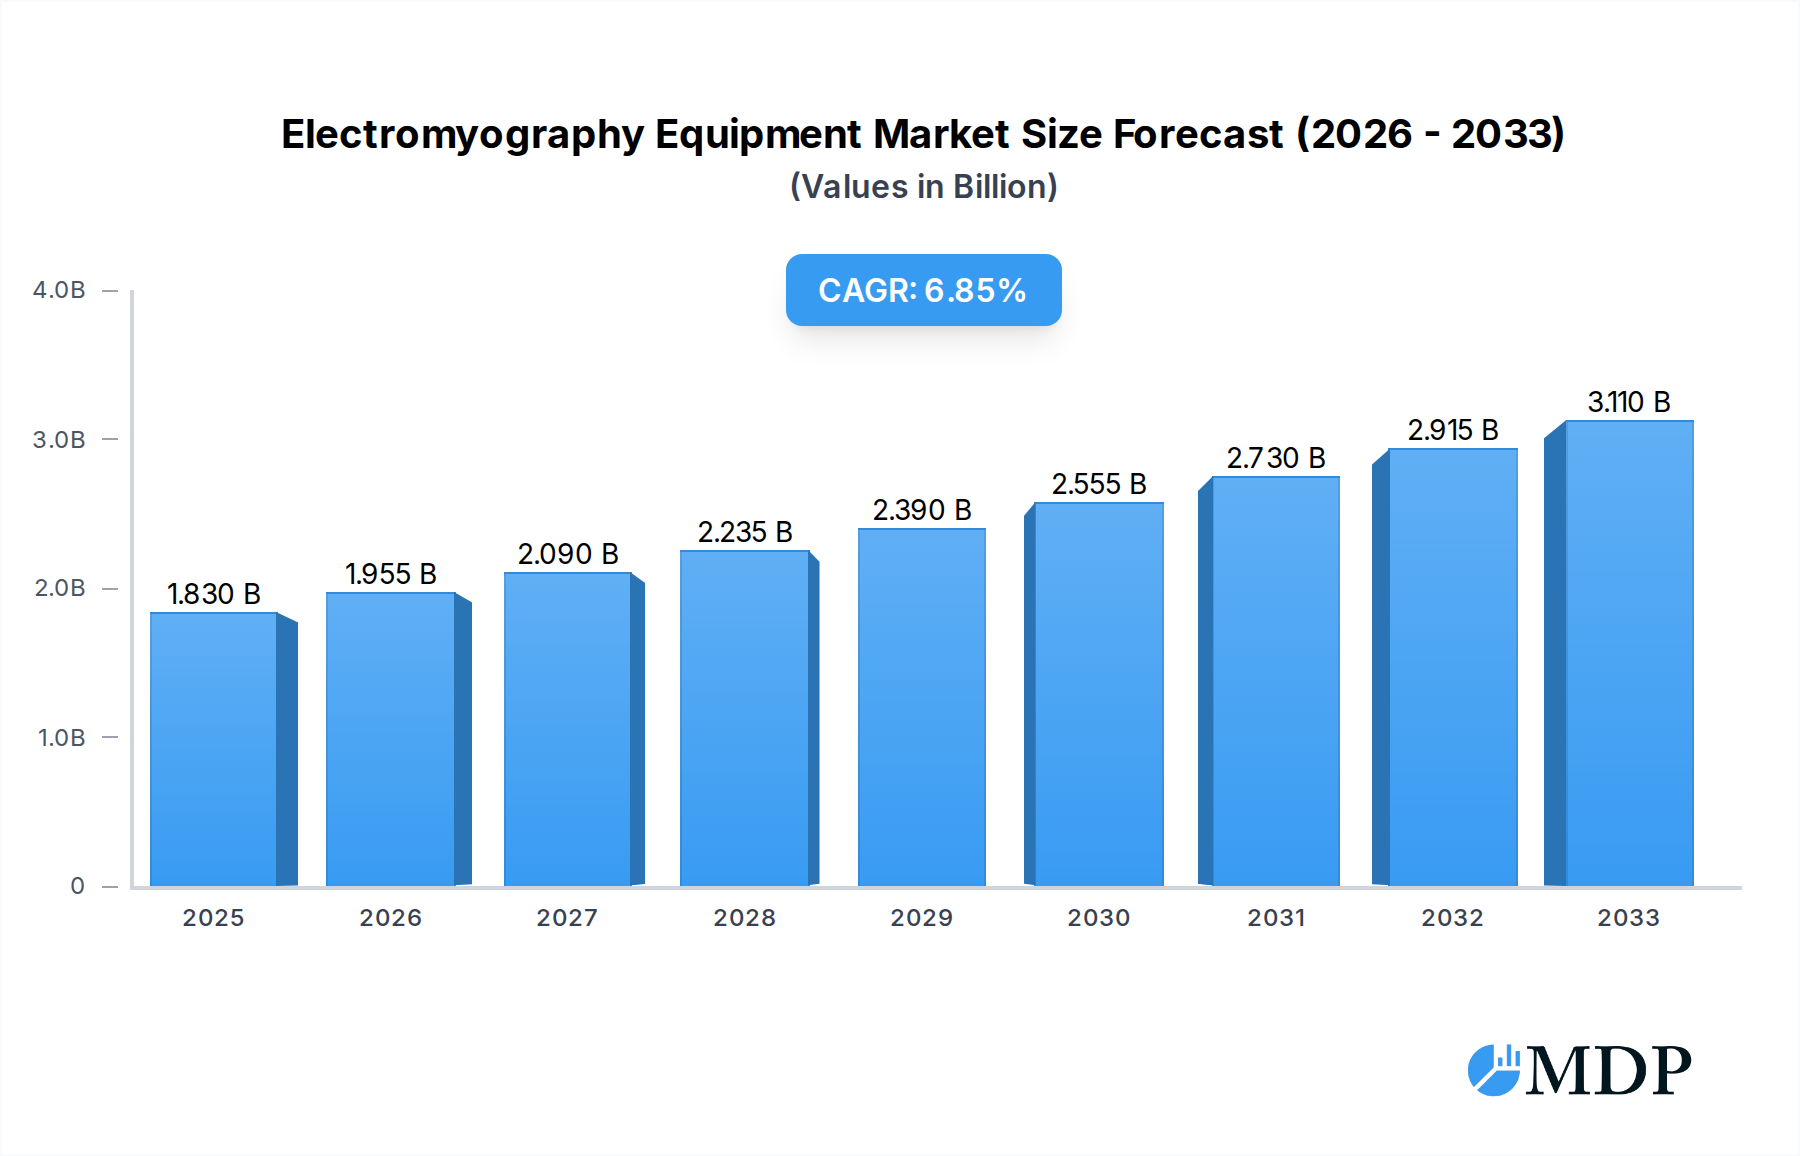
Electromyography Equipment Market Size (In Billion)
The market segmentation by application highlights the dominant role of hospitals, which are primary centers for neurological diagnostics and treatment, followed by clinics. In terms of types, both stationary and portable EMG equipment are experiencing demand. Portable devices, in particular, are gaining traction due to their ability to facilitate in-home patient monitoring and remote diagnostics, addressing the growing need for accessible healthcare solutions. Despite the positive outlook, certain factors may present challenges. High initial investment costs for sophisticated EMG systems and a shortage of skilled neurologists and technicians trained in operating these devices could potentially restrain market growth in some regions. However, the ongoing commitment to research and development, coupled with strategic partnerships and collaborations among key market players like Medtronic, Natus Medical, and NIHON KOHDEN, is expected to drive innovation and overcome these restraints, ensuring sustained market expansion.

Electromyography Equipment Company Market Share
Electromyography Equipment Market: Comprehensive Analysis & Forecast (2019–2033)
This in-depth report offers a detailed examination of the global Electromyography (EMG) Equipment market, providing critical insights for industry stakeholders. With a study period spanning from 2019 to 2033, a base year of 2025, and a forecast period of 2025–2033, this analysis delves into market dynamics, key trends, leading segments, product developments, growth drivers, challenges, emerging opportunities, and strategic outlook. We project the global EMG equipment market to reach \$10 billion by 2025 and grow at a Compound Annual Growth Rate (CAGR) of 9.8% during the forecast period.
Electromyography Equipment Market Dynamics & Concentration
The Electromyography (EMG) equipment market is characterized by moderate concentration, with leading players holding significant market share. However, the landscape is continuously shaped by innovation drivers, primarily the increasing demand for advanced diagnostic tools for neurological disorders and the growing need for real-time patient monitoring. Regulatory frameworks, such as those established by the FDA and EMA, play a crucial role in ensuring product safety and efficacy, influencing market entry and product development timelines. Product substitutes, while not directly replacing EMG, include alternative neurophysiological diagnostic methods. End-user trends are leaning towards minimally invasive procedures and portable diagnostic solutions, driving demand for innovative EMG devices. Mergers and Acquisition (M&A) activities are expected to remain a key strategy for market expansion and consolidation, with an estimated 20-25 M&A deals anticipated during the forecast period. Companies are focused on acquiring specialized technologies and expanding their geographical reach.
Electromyography Equipment Industry Trends & Analysis
The Electromyography (EMG) equipment industry is poised for substantial growth, fueled by an escalating prevalence of neurological disorders such as peripheral neuropathy, carpal tunnel syndrome, and muscular dystrophy. This rising disease burden directly correlates with an increased demand for accurate and efficient diagnostic tools like EMG machines. Technological advancements are at the forefront of market expansion, with manufacturers continuously investing in research and development to integrate features such as wireless connectivity, enhanced signal processing capabilities, and artificial intelligence (AI)-powered data analysis. These innovations not only improve diagnostic accuracy and speed but also enhance patient comfort and ease of use for healthcare professionals. The growing preference for portable and point-of-care diagnostic devices is another significant trend, driven by the need for rapid diagnosis in various settings, including clinics, home healthcare, and remote areas. This shift is propelling the development and adoption of compact, user-friendly EMG systems. Furthermore, an aging global population, which is more susceptible to neurological conditions, contributes significantly to the sustained demand for EMG equipment. The increasing healthcare expenditure worldwide, coupled with government initiatives promoting better diagnostics and patient care, further bolsters market penetration. The competitive landscape is dynamic, with both established players and emerging startups vying for market share through product differentiation, strategic partnerships, and aggressive marketing strategies. The market penetration of advanced EMG solutions is expected to reach XX% by 2025, with a projected market value of \$10 billion.
Leading Markets & Segments in Electromyography Equipment
The Electromyography (EMG) Equipment market exhibits distinct regional dominance and segment preferences. Geographically, North America currently leads the market, driven by a high prevalence of neurological disorders, robust healthcare infrastructure, and significant investment in advanced medical technologies. The United States, in particular, accounts for a substantial portion of this market share, owing to a well-established reimbursement system for diagnostic procedures and the presence of leading research institutions. However, the Asia-Pacific region is emerging as a high-growth market, propelled by increasing healthcare expenditure, a growing awareness of neurological health, and the expanding reach of healthcare services into underserved populations.
Within the application segments, Hospitals represent the largest market share due to the comprehensive diagnostic capabilities and specialist care they offer. Hospitals are equipped to handle complex neurological cases requiring sophisticated EMG analysis and are primary adopters of advanced EMG equipment. Clinics, particularly neurology and rehabilitation clinics, represent a rapidly growing segment. The increasing decentralization of healthcare services and the demand for specialized outpatient diagnostics are key drivers for this segment's expansion.
Considering the types of EMG equipment, the Stationary Type has historically dominated the market, offering advanced features and high-fidelity signal acquisition for detailed neurological assessments. These systems are typically found in hospital settings and specialized diagnostic centers. However, the Portable Type segment is witnessing accelerated growth. This surge is attributed to the growing need for ambulatory monitoring, in-home diagnostics, and applications in sports medicine and physical therapy. The convenience, cost-effectiveness, and ability to perform diagnostics outside traditional clinical settings are key factors driving the adoption of portable EMG devices. For instance, the economic policies in emerging economies that focus on expanding primary healthcare access are indirectly boosting the demand for portable EMG solutions in rural and remote areas. The infrastructure development in these regions also supports the wider deployment of such equipment.
Electromyography Equipment Product Developments
Recent product developments in Electromyography (EMG) equipment are heavily focused on enhancing diagnostic accuracy and user experience. Innovations include the integration of artificial intelligence for automated data analysis and anomaly detection, leading to faster and more precise diagnoses. Wireless connectivity and miniaturization of devices are paving the way for more portable and user-friendly EMG systems, facilitating point-of-care diagnostics and remote patient monitoring. Furthermore, advancements in electrode technology are improving signal quality and patient comfort, minimizing artifacts and ensuring reliable data acquisition. These developments empower healthcare professionals with more versatile and efficient tools for assessing neuromuscular function.
Key Drivers of Electromyography Equipment Growth
The Electromyography (EMG) equipment market is propelled by several key drivers. Technological advancements, such as AI-driven analytics, wireless capabilities, and improved sensor technology, are enhancing diagnostic precision and accessibility. The increasing prevalence of neurological and neuromuscular disorders globally, including peripheral neuropathies and motor neuron diseases, directly fuels the demand for accurate diagnostic tools. Growing healthcare expenditure and rising awareness about early diagnosis and treatment of these conditions, especially in emerging economies, further contribute to market expansion. Additionally, favorable government initiatives and regulatory support for advanced medical devices promote the adoption of sophisticated EMG equipment. The increasing use of EMG in sports medicine and rehabilitation also adds to its growth.
Challenges in the Electromyography Equipment Market
Despite robust growth, the Electromyography (EMG) equipment market faces several challenges. High initial investment costs associated with advanced EMG systems can be a barrier for smaller healthcare facilities and in developing regions. Stringent regulatory approval processes for new medical devices can lead to extended development timelines and increased costs. Lack of trained personnel skilled in operating and interpreting complex EMG data in certain regions also poses a restraint. Furthermore, fierce competition among established players and emerging manufacturers can lead to price pressures and affect profit margins. Supply chain disruptions, as witnessed globally, can also impact the availability and cost of components.
Emerging Opportunities in Electromyography Equipment
Emerging opportunities in the Electromyography (EMG) equipment market lie in several key areas. The expansion of telehealth and remote patient monitoring presents a significant avenue for growth, with portable and wirelessly connected EMG devices enabling continuous assessment of patients outside clinical settings. The increasing application of EMG in sports science and rehabilitation for performance monitoring and injury assessment opens up new market segments. Furthermore, partnerships and collaborations between EMG equipment manufacturers and AI developers can lead to the creation of more intelligent and user-friendly diagnostic platforms. Investing in emerging markets with growing healthcare infrastructure and increasing disposable incomes offers substantial long-term growth potential.
Leading Players in the Electromyography Equipment Sector
- Cadwell Industries
- Compumedics
- Electrical Geodesics
- Medtronic
- Natus Medical
- NIHON KOHDEN
- Biometrics
- Clarity Medical
Key Milestones in Electromyography Equipment Industry
- 2019: Launch of next-generation portable EMG devices with enhanced AI capabilities.
- 2020: Increased adoption of remote EMG monitoring solutions amidst global health concerns.
- 2021: Significant advancements in electrode technology leading to improved signal clarity.
- 2022: Key M&A activities focused on expanding product portfolios and market reach.
- 2023: Introduction of integrated EMG and Nerve Conduction Study (NCS) systems for comprehensive neurophysiological testing.
- 2024: Growing integration of cloud-based data management and analysis platforms.
Strategic Outlook for Electromyography Equipment Market
The strategic outlook for the Electromyography (EMG) equipment market is optimistic, driven by continuous innovation and expanding applications. The focus will remain on developing smarter, more accessible, and integrated diagnostic solutions. Manufacturers are expected to prioritize the enhancement of AI capabilities for automated diagnostics, the miniaturization and wireless connectivity of devices for greater portability, and the expansion into emerging markets. Strategic partnerships and collaborations will be crucial for market players to leverage specialized expertise and accelerate product development. The increasing demand for early and accurate diagnosis of neurological conditions, coupled with a growing emphasis on personalized medicine, will continue to fuel market growth, positioning EMG equipment as an indispensable tool in modern healthcare.
Electromyography Equipment Segmentation
-
1. Application
- 1.1. Hospital
- 1.2. Clinic
-
2. Types
- 2.1. Stationary Type
- 2.2. Portable Type
Electromyography Equipment Segmentation By Geography
-
1. North America
- 1.1. United States
- 1.2. Canada
- 1.3. Mexico
-
2. South America
- 2.1. Brazil
- 2.2. Argentina
- 2.3. Rest of South America
-
3. Europe
- 3.1. United Kingdom
- 3.2. Germany
- 3.3. France
- 3.4. Italy
- 3.5. Spain
- 3.6. Russia
- 3.7. Benelux
- 3.8. Nordics
- 3.9. Rest of Europe
-
4. Middle East & Africa
- 4.1. Turkey
- 4.2. Israel
- 4.3. GCC
- 4.4. North Africa
- 4.5. South Africa
- 4.6. Rest of Middle East & Africa
-
5. Asia Pacific
- 5.1. China
- 5.2. India
- 5.3. Japan
- 5.4. South Korea
- 5.5. ASEAN
- 5.6. Oceania
- 5.7. Rest of Asia Pacific
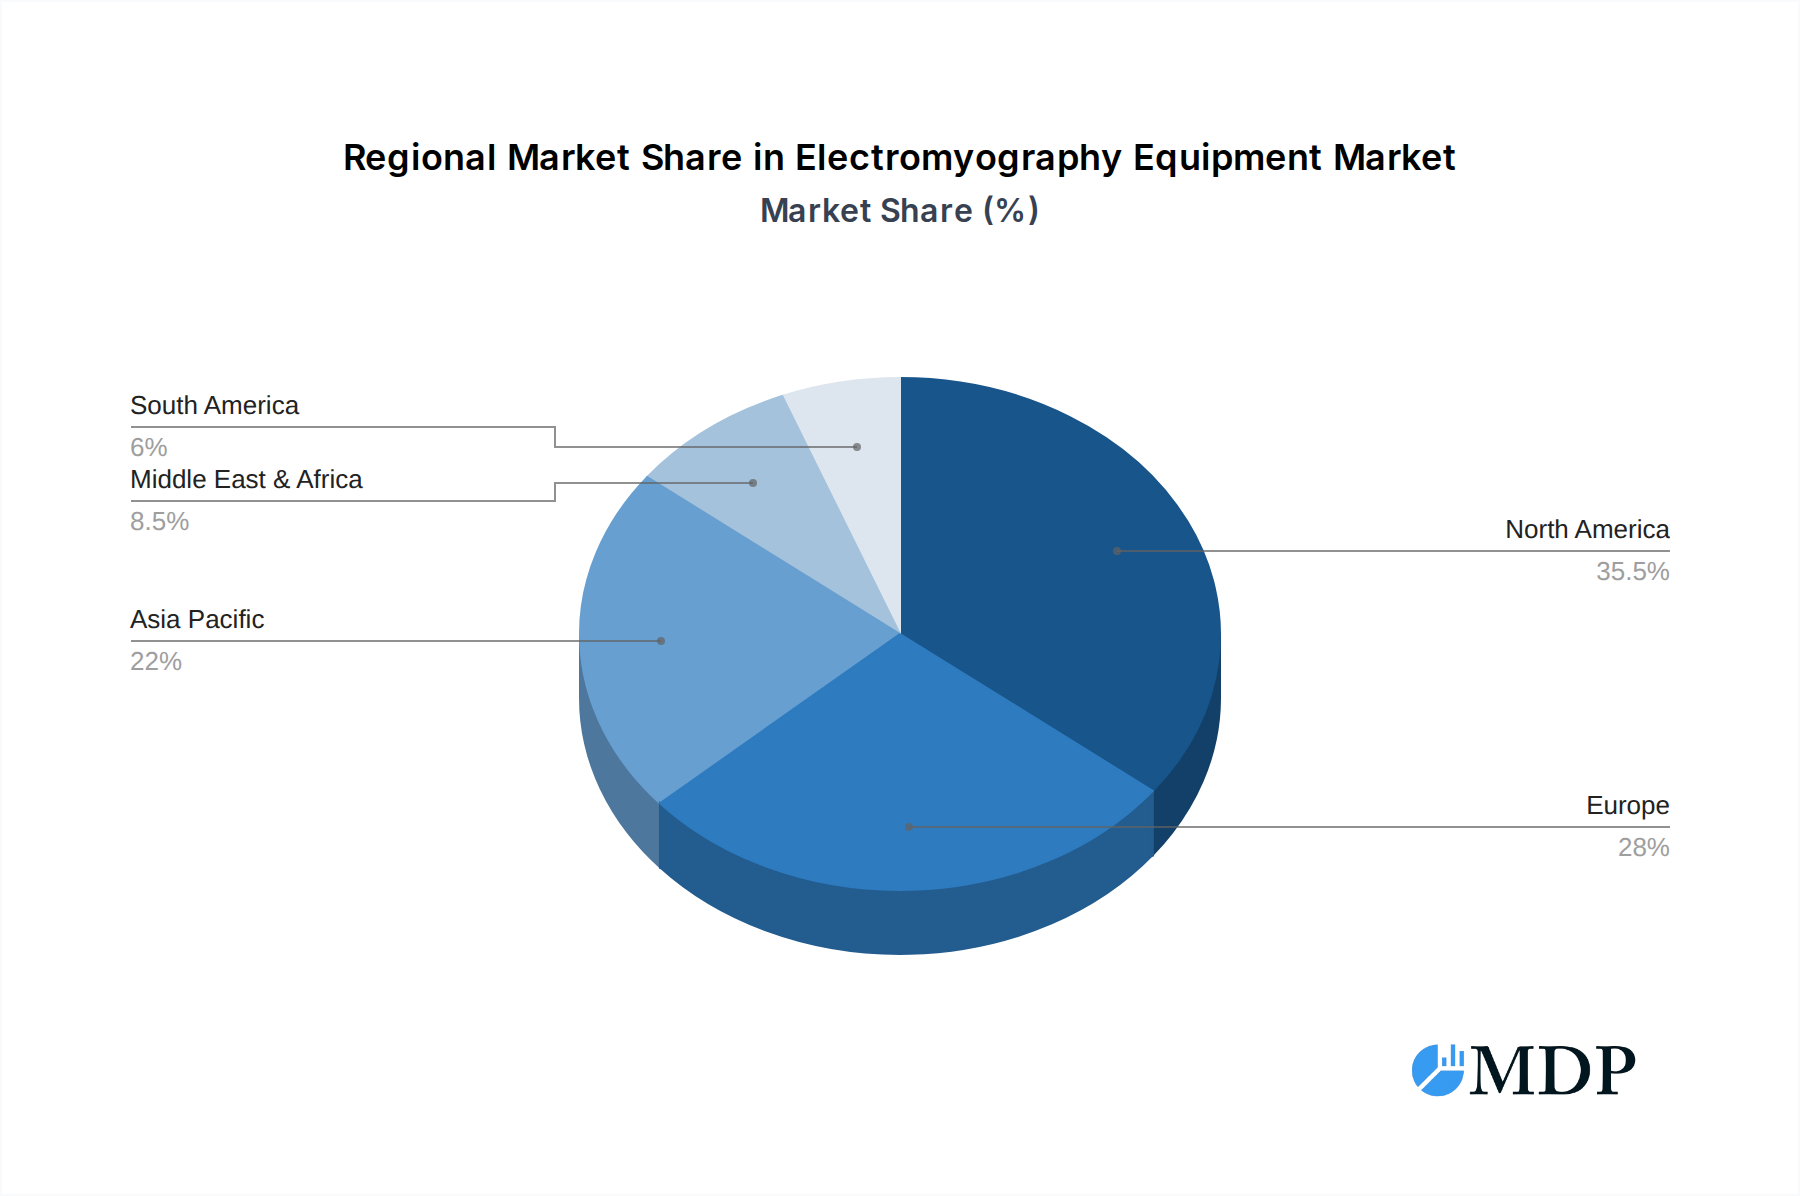
Electromyography Equipment Regional Market Share
Geographic Coverage of Electromyography Equipment
Electromyography Equipment REPORT HIGHLIGHTS
| Aspects | Details |
|---|---|
| Study Period | 2020-2034 |
| Base Year | 2025 |
| Estimated Year | 2026 |
| Forecast Period | 2026-2034 |
| Historical Period | 2020-2025 |
| Growth Rate | CAGR of 6.72% from 2020-2034 |
| Segmentation |
|
Table of Contents
- 1. Introduction
- 1.1. Research Scope
- 1.2. Market Segmentation
- 1.3. Research Methodology
- 1.4. Definitions and Assumptions
- 2. Executive Summary
- 2.1. Introduction
- 3. Market Dynamics
- 3.1. Introduction
- 3.2. Market Drivers
- 3.3. Market Restrains
- 3.4. Market Trends
- 4. Market Factor Analysis
- 4.1. Porters Five Forces
- 4.2. Supply/Value Chain
- 4.3. PESTEL analysis
- 4.4. Market Entropy
- 4.5. Patent/Trademark Analysis
- 5. Global Electromyography Equipment Analysis, Insights and Forecast, 2020-2032
- 5.1. Market Analysis, Insights and Forecast - by Application
- 5.1.1. Hospital
- 5.1.2. Clinic
- 5.2. Market Analysis, Insights and Forecast - by Types
- 5.2.1. Stationary Type
- 5.2.2. Portable Type
- 5.3. Market Analysis, Insights and Forecast - by Region
- 5.3.1. North America
- 5.3.2. South America
- 5.3.3. Europe
- 5.3.4. Middle East & Africa
- 5.3.5. Asia Pacific
- 5.1. Market Analysis, Insights and Forecast - by Application
- 6. North America Electromyography Equipment Analysis, Insights and Forecast, 2020-2032
- 6.1. Market Analysis, Insights and Forecast - by Application
- 6.1.1. Hospital
- 6.1.2. Clinic
- 6.2. Market Analysis, Insights and Forecast - by Types
- 6.2.1. Stationary Type
- 6.2.2. Portable Type
- 6.1. Market Analysis, Insights and Forecast - by Application
- 7. South America Electromyography Equipment Analysis, Insights and Forecast, 2020-2032
- 7.1. Market Analysis, Insights and Forecast - by Application
- 7.1.1. Hospital
- 7.1.2. Clinic
- 7.2. Market Analysis, Insights and Forecast - by Types
- 7.2.1. Stationary Type
- 7.2.2. Portable Type
- 7.1. Market Analysis, Insights and Forecast - by Application
- 8. Europe Electromyography Equipment Analysis, Insights and Forecast, 2020-2032
- 8.1. Market Analysis, Insights and Forecast - by Application
- 8.1.1. Hospital
- 8.1.2. Clinic
- 8.2. Market Analysis, Insights and Forecast - by Types
- 8.2.1. Stationary Type
- 8.2.2. Portable Type
- 8.1. Market Analysis, Insights and Forecast - by Application
- 9. Middle East & Africa Electromyography Equipment Analysis, Insights and Forecast, 2020-2032
- 9.1. Market Analysis, Insights and Forecast - by Application
- 9.1.1. Hospital
- 9.1.2. Clinic
- 9.2. Market Analysis, Insights and Forecast - by Types
- 9.2.1. Stationary Type
- 9.2.2. Portable Type
- 9.1. Market Analysis, Insights and Forecast - by Application
- 10. Asia Pacific Electromyography Equipment Analysis, Insights and Forecast, 2020-2032
- 10.1. Market Analysis, Insights and Forecast - by Application
- 10.1.1. Hospital
- 10.1.2. Clinic
- 10.2. Market Analysis, Insights and Forecast - by Types
- 10.2.1. Stationary Type
- 10.2.2. Portable Type
- 10.1. Market Analysis, Insights and Forecast - by Application
- 11. Competitive Analysis
- 11.1. Global Market Share Analysis 2025
- 11.2. Company Profiles
- 11.2.1 Cadwell Industries
- 11.2.1.1. Overview
- 11.2.1.2. Products
- 11.2.1.3. SWOT Analysis
- 11.2.1.4. Recent Developments
- 11.2.1.5. Financials (Based on Availability)
- 11.2.2 Compumedics
- 11.2.2.1. Overview
- 11.2.2.2. Products
- 11.2.2.3. SWOT Analysis
- 11.2.2.4. Recent Developments
- 11.2.2.5. Financials (Based on Availability)
- 11.2.3 Electrical Geodesics
- 11.2.3.1. Overview
- 11.2.3.2. Products
- 11.2.3.3. SWOT Analysis
- 11.2.3.4. Recent Developments
- 11.2.3.5. Financials (Based on Availability)
- 11.2.4 Medtronic
- 11.2.4.1. Overview
- 11.2.4.2. Products
- 11.2.4.3. SWOT Analysis
- 11.2.4.4. Recent Developments
- 11.2.4.5. Financials (Based on Availability)
- 11.2.5 Natus Medical
- 11.2.5.1. Overview
- 11.2.5.2. Products
- 11.2.5.3. SWOT Analysis
- 11.2.5.4. Recent Developments
- 11.2.5.5. Financials (Based on Availability)
- 11.2.6 NIHON KOHDEN
- 11.2.6.1. Overview
- 11.2.6.2. Products
- 11.2.6.3. SWOT Analysis
- 11.2.6.4. Recent Developments
- 11.2.6.5. Financials (Based on Availability)
- 11.2.7 Biometrics
- 11.2.7.1. Overview
- 11.2.7.2. Products
- 11.2.7.3. SWOT Analysis
- 11.2.7.4. Recent Developments
- 11.2.7.5. Financials (Based on Availability)
- 11.2.8 Clarity Medical
- 11.2.8.1. Overview
- 11.2.8.2. Products
- 11.2.8.3. SWOT Analysis
- 11.2.8.4. Recent Developments
- 11.2.8.5. Financials (Based on Availability)
- 11.2.1 Cadwell Industries
List of Figures
- Figure 1: Global Electromyography Equipment Revenue Breakdown (billion, %) by Region 2025 & 2033
- Figure 2: Global Electromyography Equipment Volume Breakdown (K, %) by Region 2025 & 2033
- Figure 3: North America Electromyography Equipment Revenue (billion), by Application 2025 & 2033
- Figure 4: North America Electromyography Equipment Volume (K), by Application 2025 & 2033
- Figure 5: North America Electromyography Equipment Revenue Share (%), by Application 2025 & 2033
- Figure 6: North America Electromyography Equipment Volume Share (%), by Application 2025 & 2033
- Figure 7: North America Electromyography Equipment Revenue (billion), by Types 2025 & 2033
- Figure 8: North America Electromyography Equipment Volume (K), by Types 2025 & 2033
- Figure 9: North America Electromyography Equipment Revenue Share (%), by Types 2025 & 2033
- Figure 10: North America Electromyography Equipment Volume Share (%), by Types 2025 & 2033
- Figure 11: North America Electromyography Equipment Revenue (billion), by Country 2025 & 2033
- Figure 12: North America Electromyography Equipment Volume (K), by Country 2025 & 2033
- Figure 13: North America Electromyography Equipment Revenue Share (%), by Country 2025 & 2033
- Figure 14: North America Electromyography Equipment Volume Share (%), by Country 2025 & 2033
- Figure 15: South America Electromyography Equipment Revenue (billion), by Application 2025 & 2033
- Figure 16: South America Electromyography Equipment Volume (K), by Application 2025 & 2033
- Figure 17: South America Electromyography Equipment Revenue Share (%), by Application 2025 & 2033
- Figure 18: South America Electromyography Equipment Volume Share (%), by Application 2025 & 2033
- Figure 19: South America Electromyography Equipment Revenue (billion), by Types 2025 & 2033
- Figure 20: South America Electromyography Equipment Volume (K), by Types 2025 & 2033
- Figure 21: South America Electromyography Equipment Revenue Share (%), by Types 2025 & 2033
- Figure 22: South America Electromyography Equipment Volume Share (%), by Types 2025 & 2033
- Figure 23: South America Electromyography Equipment Revenue (billion), by Country 2025 & 2033
- Figure 24: South America Electromyography Equipment Volume (K), by Country 2025 & 2033
- Figure 25: South America Electromyography Equipment Revenue Share (%), by Country 2025 & 2033
- Figure 26: South America Electromyography Equipment Volume Share (%), by Country 2025 & 2033
- Figure 27: Europe Electromyography Equipment Revenue (billion), by Application 2025 & 2033
- Figure 28: Europe Electromyography Equipment Volume (K), by Application 2025 & 2033
- Figure 29: Europe Electromyography Equipment Revenue Share (%), by Application 2025 & 2033
- Figure 30: Europe Electromyography Equipment Volume Share (%), by Application 2025 & 2033
- Figure 31: Europe Electromyography Equipment Revenue (billion), by Types 2025 & 2033
- Figure 32: Europe Electromyography Equipment Volume (K), by Types 2025 & 2033
- Figure 33: Europe Electromyography Equipment Revenue Share (%), by Types 2025 & 2033
- Figure 34: Europe Electromyography Equipment Volume Share (%), by Types 2025 & 2033
- Figure 35: Europe Electromyography Equipment Revenue (billion), by Country 2025 & 2033
- Figure 36: Europe Electromyography Equipment Volume (K), by Country 2025 & 2033
- Figure 37: Europe Electromyography Equipment Revenue Share (%), by Country 2025 & 2033
- Figure 38: Europe Electromyography Equipment Volume Share (%), by Country 2025 & 2033
- Figure 39: Middle East & Africa Electromyography Equipment Revenue (billion), by Application 2025 & 2033
- Figure 40: Middle East & Africa Electromyography Equipment Volume (K), by Application 2025 & 2033
- Figure 41: Middle East & Africa Electromyography Equipment Revenue Share (%), by Application 2025 & 2033
- Figure 42: Middle East & Africa Electromyography Equipment Volume Share (%), by Application 2025 & 2033
- Figure 43: Middle East & Africa Electromyography Equipment Revenue (billion), by Types 2025 & 2033
- Figure 44: Middle East & Africa Electromyography Equipment Volume (K), by Types 2025 & 2033
- Figure 45: Middle East & Africa Electromyography Equipment Revenue Share (%), by Types 2025 & 2033
- Figure 46: Middle East & Africa Electromyography Equipment Volume Share (%), by Types 2025 & 2033
- Figure 47: Middle East & Africa Electromyography Equipment Revenue (billion), by Country 2025 & 2033
- Figure 48: Middle East & Africa Electromyography Equipment Volume (K), by Country 2025 & 2033
- Figure 49: Middle East & Africa Electromyography Equipment Revenue Share (%), by Country 2025 & 2033
- Figure 50: Middle East & Africa Electromyography Equipment Volume Share (%), by Country 2025 & 2033
- Figure 51: Asia Pacific Electromyography Equipment Revenue (billion), by Application 2025 & 2033
- Figure 52: Asia Pacific Electromyography Equipment Volume (K), by Application 2025 & 2033
- Figure 53: Asia Pacific Electromyography Equipment Revenue Share (%), by Application 2025 & 2033
- Figure 54: Asia Pacific Electromyography Equipment Volume Share (%), by Application 2025 & 2033
- Figure 55: Asia Pacific Electromyography Equipment Revenue (billion), by Types 2025 & 2033
- Figure 56: Asia Pacific Electromyography Equipment Volume (K), by Types 2025 & 2033
- Figure 57: Asia Pacific Electromyography Equipment Revenue Share (%), by Types 2025 & 2033
- Figure 58: Asia Pacific Electromyography Equipment Volume Share (%), by Types 2025 & 2033
- Figure 59: Asia Pacific Electromyography Equipment Revenue (billion), by Country 2025 & 2033
- Figure 60: Asia Pacific Electromyography Equipment Volume (K), by Country 2025 & 2033
- Figure 61: Asia Pacific Electromyography Equipment Revenue Share (%), by Country 2025 & 2033
- Figure 62: Asia Pacific Electromyography Equipment Volume Share (%), by Country 2025 & 2033
List of Tables
- Table 1: Global Electromyography Equipment Revenue billion Forecast, by Application 2020 & 2033
- Table 2: Global Electromyography Equipment Volume K Forecast, by Application 2020 & 2033
- Table 3: Global Electromyography Equipment Revenue billion Forecast, by Types 2020 & 2033
- Table 4: Global Electromyography Equipment Volume K Forecast, by Types 2020 & 2033
- Table 5: Global Electromyography Equipment Revenue billion Forecast, by Region 2020 & 2033
- Table 6: Global Electromyography Equipment Volume K Forecast, by Region 2020 & 2033
- Table 7: Global Electromyography Equipment Revenue billion Forecast, by Application 2020 & 2033
- Table 8: Global Electromyography Equipment Volume K Forecast, by Application 2020 & 2033
- Table 9: Global Electromyography Equipment Revenue billion Forecast, by Types 2020 & 2033
- Table 10: Global Electromyography Equipment Volume K Forecast, by Types 2020 & 2033
- Table 11: Global Electromyography Equipment Revenue billion Forecast, by Country 2020 & 2033
- Table 12: Global Electromyography Equipment Volume K Forecast, by Country 2020 & 2033
- Table 13: United States Electromyography Equipment Revenue (billion) Forecast, by Application 2020 & 2033
- Table 14: United States Electromyography Equipment Volume (K) Forecast, by Application 2020 & 2033
- Table 15: Canada Electromyography Equipment Revenue (billion) Forecast, by Application 2020 & 2033
- Table 16: Canada Electromyography Equipment Volume (K) Forecast, by Application 2020 & 2033
- Table 17: Mexico Electromyography Equipment Revenue (billion) Forecast, by Application 2020 & 2033
- Table 18: Mexico Electromyography Equipment Volume (K) Forecast, by Application 2020 & 2033
- Table 19: Global Electromyography Equipment Revenue billion Forecast, by Application 2020 & 2033
- Table 20: Global Electromyography Equipment Volume K Forecast, by Application 2020 & 2033
- Table 21: Global Electromyography Equipment Revenue billion Forecast, by Types 2020 & 2033
- Table 22: Global Electromyography Equipment Volume K Forecast, by Types 2020 & 2033
- Table 23: Global Electromyography Equipment Revenue billion Forecast, by Country 2020 & 2033
- Table 24: Global Electromyography Equipment Volume K Forecast, by Country 2020 & 2033
- Table 25: Brazil Electromyography Equipment Revenue (billion) Forecast, by Application 2020 & 2033
- Table 26: Brazil Electromyography Equipment Volume (K) Forecast, by Application 2020 & 2033
- Table 27: Argentina Electromyography Equipment Revenue (billion) Forecast, by Application 2020 & 2033
- Table 28: Argentina Electromyography Equipment Volume (K) Forecast, by Application 2020 & 2033
- Table 29: Rest of South America Electromyography Equipment Revenue (billion) Forecast, by Application 2020 & 2033
- Table 30: Rest of South America Electromyography Equipment Volume (K) Forecast, by Application 2020 & 2033
- Table 31: Global Electromyography Equipment Revenue billion Forecast, by Application 2020 & 2033
- Table 32: Global Electromyography Equipment Volume K Forecast, by Application 2020 & 2033
- Table 33: Global Electromyography Equipment Revenue billion Forecast, by Types 2020 & 2033
- Table 34: Global Electromyography Equipment Volume K Forecast, by Types 2020 & 2033
- Table 35: Global Electromyography Equipment Revenue billion Forecast, by Country 2020 & 2033
- Table 36: Global Electromyography Equipment Volume K Forecast, by Country 2020 & 2033
- Table 37: United Kingdom Electromyography Equipment Revenue (billion) Forecast, by Application 2020 & 2033
- Table 38: United Kingdom Electromyography Equipment Volume (K) Forecast, by Application 2020 & 2033
- Table 39: Germany Electromyography Equipment Revenue (billion) Forecast, by Application 2020 & 2033
- Table 40: Germany Electromyography Equipment Volume (K) Forecast, by Application 2020 & 2033
- Table 41: France Electromyography Equipment Revenue (billion) Forecast, by Application 2020 & 2033
- Table 42: France Electromyography Equipment Volume (K) Forecast, by Application 2020 & 2033
- Table 43: Italy Electromyography Equipment Revenue (billion) Forecast, by Application 2020 & 2033
- Table 44: Italy Electromyography Equipment Volume (K) Forecast, by Application 2020 & 2033
- Table 45: Spain Electromyography Equipment Revenue (billion) Forecast, by Application 2020 & 2033
- Table 46: Spain Electromyography Equipment Volume (K) Forecast, by Application 2020 & 2033
- Table 47: Russia Electromyography Equipment Revenue (billion) Forecast, by Application 2020 & 2033
- Table 48: Russia Electromyography Equipment Volume (K) Forecast, by Application 2020 & 2033
- Table 49: Benelux Electromyography Equipment Revenue (billion) Forecast, by Application 2020 & 2033
- Table 50: Benelux Electromyography Equipment Volume (K) Forecast, by Application 2020 & 2033
- Table 51: Nordics Electromyography Equipment Revenue (billion) Forecast, by Application 2020 & 2033
- Table 52: Nordics Electromyography Equipment Volume (K) Forecast, by Application 2020 & 2033
- Table 53: Rest of Europe Electromyography Equipment Revenue (billion) Forecast, by Application 2020 & 2033
- Table 54: Rest of Europe Electromyography Equipment Volume (K) Forecast, by Application 2020 & 2033
- Table 55: Global Electromyography Equipment Revenue billion Forecast, by Application 2020 & 2033
- Table 56: Global Electromyography Equipment Volume K Forecast, by Application 2020 & 2033
- Table 57: Global Electromyography Equipment Revenue billion Forecast, by Types 2020 & 2033
- Table 58: Global Electromyography Equipment Volume K Forecast, by Types 2020 & 2033
- Table 59: Global Electromyography Equipment Revenue billion Forecast, by Country 2020 & 2033
- Table 60: Global Electromyography Equipment Volume K Forecast, by Country 2020 & 2033
- Table 61: Turkey Electromyography Equipment Revenue (billion) Forecast, by Application 2020 & 2033
- Table 62: Turkey Electromyography Equipment Volume (K) Forecast, by Application 2020 & 2033
- Table 63: Israel Electromyography Equipment Revenue (billion) Forecast, by Application 2020 & 2033
- Table 64: Israel Electromyography Equipment Volume (K) Forecast, by Application 2020 & 2033
- Table 65: GCC Electromyography Equipment Revenue (billion) Forecast, by Application 2020 & 2033
- Table 66: GCC Electromyography Equipment Volume (K) Forecast, by Application 2020 & 2033
- Table 67: North Africa Electromyography Equipment Revenue (billion) Forecast, by Application 2020 & 2033
- Table 68: North Africa Electromyography Equipment Volume (K) Forecast, by Application 2020 & 2033
- Table 69: South Africa Electromyography Equipment Revenue (billion) Forecast, by Application 2020 & 2033
- Table 70: South Africa Electromyography Equipment Volume (K) Forecast, by Application 2020 & 2033
- Table 71: Rest of Middle East & Africa Electromyography Equipment Revenue (billion) Forecast, by Application 2020 & 2033
- Table 72: Rest of Middle East & Africa Electromyography Equipment Volume (K) Forecast, by Application 2020 & 2033
- Table 73: Global Electromyography Equipment Revenue billion Forecast, by Application 2020 & 2033
- Table 74: Global Electromyography Equipment Volume K Forecast, by Application 2020 & 2033
- Table 75: Global Electromyography Equipment Revenue billion Forecast, by Types 2020 & 2033
- Table 76: Global Electromyography Equipment Volume K Forecast, by Types 2020 & 2033
- Table 77: Global Electromyography Equipment Revenue billion Forecast, by Country 2020 & 2033
- Table 78: Global Electromyography Equipment Volume K Forecast, by Country 2020 & 2033
- Table 79: China Electromyography Equipment Revenue (billion) Forecast, by Application 2020 & 2033
- Table 80: China Electromyography Equipment Volume (K) Forecast, by Application 2020 & 2033
- Table 81: India Electromyography Equipment Revenue (billion) Forecast, by Application 2020 & 2033
- Table 82: India Electromyography Equipment Volume (K) Forecast, by Application 2020 & 2033
- Table 83: Japan Electromyography Equipment Revenue (billion) Forecast, by Application 2020 & 2033
- Table 84: Japan Electromyography Equipment Volume (K) Forecast, by Application 2020 & 2033
- Table 85: South Korea Electromyography Equipment Revenue (billion) Forecast, by Application 2020 & 2033
- Table 86: South Korea Electromyography Equipment Volume (K) Forecast, by Application 2020 & 2033
- Table 87: ASEAN Electromyography Equipment Revenue (billion) Forecast, by Application 2020 & 2033
- Table 88: ASEAN Electromyography Equipment Volume (K) Forecast, by Application 2020 & 2033
- Table 89: Oceania Electromyography Equipment Revenue (billion) Forecast, by Application 2020 & 2033
- Table 90: Oceania Electromyography Equipment Volume (K) Forecast, by Application 2020 & 2033
- Table 91: Rest of Asia Pacific Electromyography Equipment Revenue (billion) Forecast, by Application 2020 & 2033
- Table 92: Rest of Asia Pacific Electromyography Equipment Volume (K) Forecast, by Application 2020 & 2033
Frequently Asked Questions
1. What is the projected Compound Annual Growth Rate (CAGR) of the Electromyography Equipment?
The projected CAGR is approximately 6.72%.
2. Which companies are prominent players in the Electromyography Equipment?
Key companies in the market include Cadwell Industries, Compumedics, Electrical Geodesics, Medtronic, Natus Medical, NIHON KOHDEN, Biometrics, Clarity Medical.
3. What are the main segments of the Electromyography Equipment?
The market segments include Application, Types.
4. Can you provide details about the market size?
The market size is estimated to be USD 1.83 billion as of 2022.
5. What are some drivers contributing to market growth?
N/A
6. What are the notable trends driving market growth?
N/A
7. Are there any restraints impacting market growth?
N/A
8. Can you provide examples of recent developments in the market?
N/A
9. What pricing options are available for accessing the report?
Pricing options include single-user, multi-user, and enterprise licenses priced at USD 3350.00, USD 5025.00, and USD 6700.00 respectively.
10. Is the market size provided in terms of value or volume?
The market size is provided in terms of value, measured in billion and volume, measured in K.
11. Are there any specific market keywords associated with the report?
Yes, the market keyword associated with the report is "Electromyography Equipment," which aids in identifying and referencing the specific market segment covered.
12. How do I determine which pricing option suits my needs best?
The pricing options vary based on user requirements and access needs. Individual users may opt for single-user licenses, while businesses requiring broader access may choose multi-user or enterprise licenses for cost-effective access to the report.
13. Are there any additional resources or data provided in the Electromyography Equipment report?
While the report offers comprehensive insights, it's advisable to review the specific contents or supplementary materials provided to ascertain if additional resources or data are available.
14. How can I stay updated on further developments or reports in the Electromyography Equipment?
To stay informed about further developments, trends, and reports in the Electromyography Equipment, consider subscribing to industry newsletters, following relevant companies and organizations, or regularly checking reputable industry news sources and publications.
Methodology
Step 1 - Identification of Relevant Samples Size from Population Database


Step 2 - Approaches for Defining Global Market Size (Value, Volume* & Price*)

Note*: In applicable scenarios
Step 3 - Data Sources
Primary Research
- Web Analytics
- Survey Reports
- Research Institute
- Latest Research Reports
- Opinion Leaders
Secondary Research
- Annual Reports
- White Paper
- Latest Press Release
- Industry Association
- Paid Database
- Investor Presentations

Step 4 - Data Triangulation
Involves using different sources of information in order to increase the validity of a study
These sources are likely to be stakeholders in a program - participants, other researchers, program staff, other community members, and so on.
Then we put all data in single framework & apply various statistical tools to find out the dynamic on the market.
During the analysis stage, feedback from the stakeholder groups would be compared to determine areas of agreement as well as areas of divergence