

Key Insights
The global Electrocardiogram (ECG) Monitoring Device market is poised for significant expansion, projected to reach approximately USD 5.29 billion by 2025. This robust growth is underpinned by a compelling Compound Annual Growth Rate (CAGR) of 7.3% anticipated between 2025 and 2033. The market's trajectory is primarily propelled by the increasing prevalence of cardiovascular diseases (CVDs) worldwide, coupled with a growing awareness among the populace regarding early diagnosis and continuous patient monitoring. Advancements in technology are also a key driver, leading to the development of more sophisticated, accurate, and user-friendly ECG devices. This includes the integration of AI and machine learning for enhanced diagnostic capabilities, as well as the rise of wearable and portable ECG monitors that facilitate remote patient management and proactive healthcare interventions. The expanding healthcare infrastructure, particularly in emerging economies, and supportive government initiatives aimed at improving cardiovascular healthcare further contribute to this positive market outlook.

Electrocardiogram Monitoring Device Market Size (In Billion)
The market for ECG monitoring devices is segmented by application into Hospitals, Clinics, and Other healthcare settings, with Hospitals likely holding the dominant share due to the critical need for advanced monitoring in acute care environments. Within the 'Type' segmentation, both Stationary and Portable devices are expected to witness strong demand. Stationary devices will remain crucial in critical care units, while portable solutions are gaining traction for their utility in ambulatory settings, long-term patient monitoring at home, and for individual health tracking. The competitive landscape features key players like GE Healthcare, Philips, and BioTelemetry, among others, driving innovation and market penetration. While market growth is strong, potential restraints could include the high cost of advanced devices and the need for skilled personnel to operate and interpret results, alongside regulatory hurdles in certain regions.

Electrocardiogram Monitoring Device Company Market Share
This in-depth report provides a detailed analysis of the global Electrocardiogram (ECG) monitoring device market, a critical segment of the healthcare technology landscape. Covering the historical period from 2019 to 2024, a base year of 2025, and an extensive forecast period extending to 2033, this report offers unparalleled insights into market dynamics, emerging trends, leading players, and future strategic opportunities. With a projected market size of several billion dollars, this study is essential for industry stakeholders seeking to understand the complex ecosystem of ECG monitoring devices.
Electrocardiogram Monitoring Device Market Dynamics & Concentration
The Electrocardiogram (ECG) monitoring device market, projected to reach a valuation of over $4 billion by 2033, is characterized by a moderate to high concentration. Leading players such as GE Healthcare, Philips, and BioTelemetry hold substantial market shares, estimated to be in the range of 15-20% each. The innovation landscape is driven by advancements in miniaturization, wireless connectivity, and AI-powered diagnostic capabilities, enabling more accurate and accessible cardiac monitoring. Regulatory frameworks, including FDA approvals and CE marking, play a pivotal role in market entry and product lifecycle management. The threat of product substitutes, while present in basic ECG functionality, is mitigated by the increasing demand for advanced, continuous monitoring solutions. End-user trends are shifting towards home-based monitoring and wearable ECG devices, driven by patient convenience and the need for early disease detection. Mergers and acquisitions (M&A) activities, with an estimated XX number of significant deals in the historical period, have been strategic moves by larger corporations to acquire innovative technologies and expand their market reach.
- Market Concentration: Moderate to High
- Innovation Drivers: Miniaturization, Wireless Connectivity, AI Diagnostics
- Regulatory Frameworks: FDA, CE Marking
- Product Substitutes: Basic ECG functionality
- End-User Trends: Home Monitoring, Wearable Devices
- M&A Activities: XX deals in the historical period (2019-2024)
Electrocardiogram Monitoring Device Industry Trends & Analysis
The Electrocardiogram (ECG) monitoring device industry is poised for robust growth, driven by a confluence of technological advancements, escalating prevalence of cardiovascular diseases, and increasing healthcare expenditure globally. The compound annual growth rate (CAGR) for this market is estimated at XX% during the forecast period. Technological disruptions, including the integration of artificial intelligence (AI) for enhanced data analysis and predictive diagnostics, are transforming the capabilities of ECG devices. The miniaturization of these devices, leading to the proliferation of portable and wearable ECG monitors, is a significant trend, enhancing patient comfort and compliance. Consumer preferences are increasingly leaning towards user-friendly, connected devices that facilitate remote patient monitoring, allowing for continuous data collection and proactive healthcare interventions. The competitive landscape is dynamic, with both established giants like Philips and emerging innovators vying for market dominance. Market penetration is expanding rapidly, particularly in developed economies with high adoption rates of advanced medical technologies, but also showing significant growth in emerging markets due to improved healthcare infrastructure and accessibility. The increasing incidence of cardiac arrhythmias, heart failure, and other cardiovascular conditions worldwide serves as a primary market driver, necessitating more sophisticated and accessible diagnostic tools. Furthermore, the growing demand for remote patient monitoring solutions, amplified by the COVID-19 pandemic, has accelerated the adoption of ambulatory ECG devices. Government initiatives promoting preventative healthcare and the early detection of diseases are also contributing to market expansion. The development of cloud-based platforms for ECG data storage and analysis further enhances the utility and reach of these devices.
Leading Markets & Segments in Electrocardiogram Monitoring Device
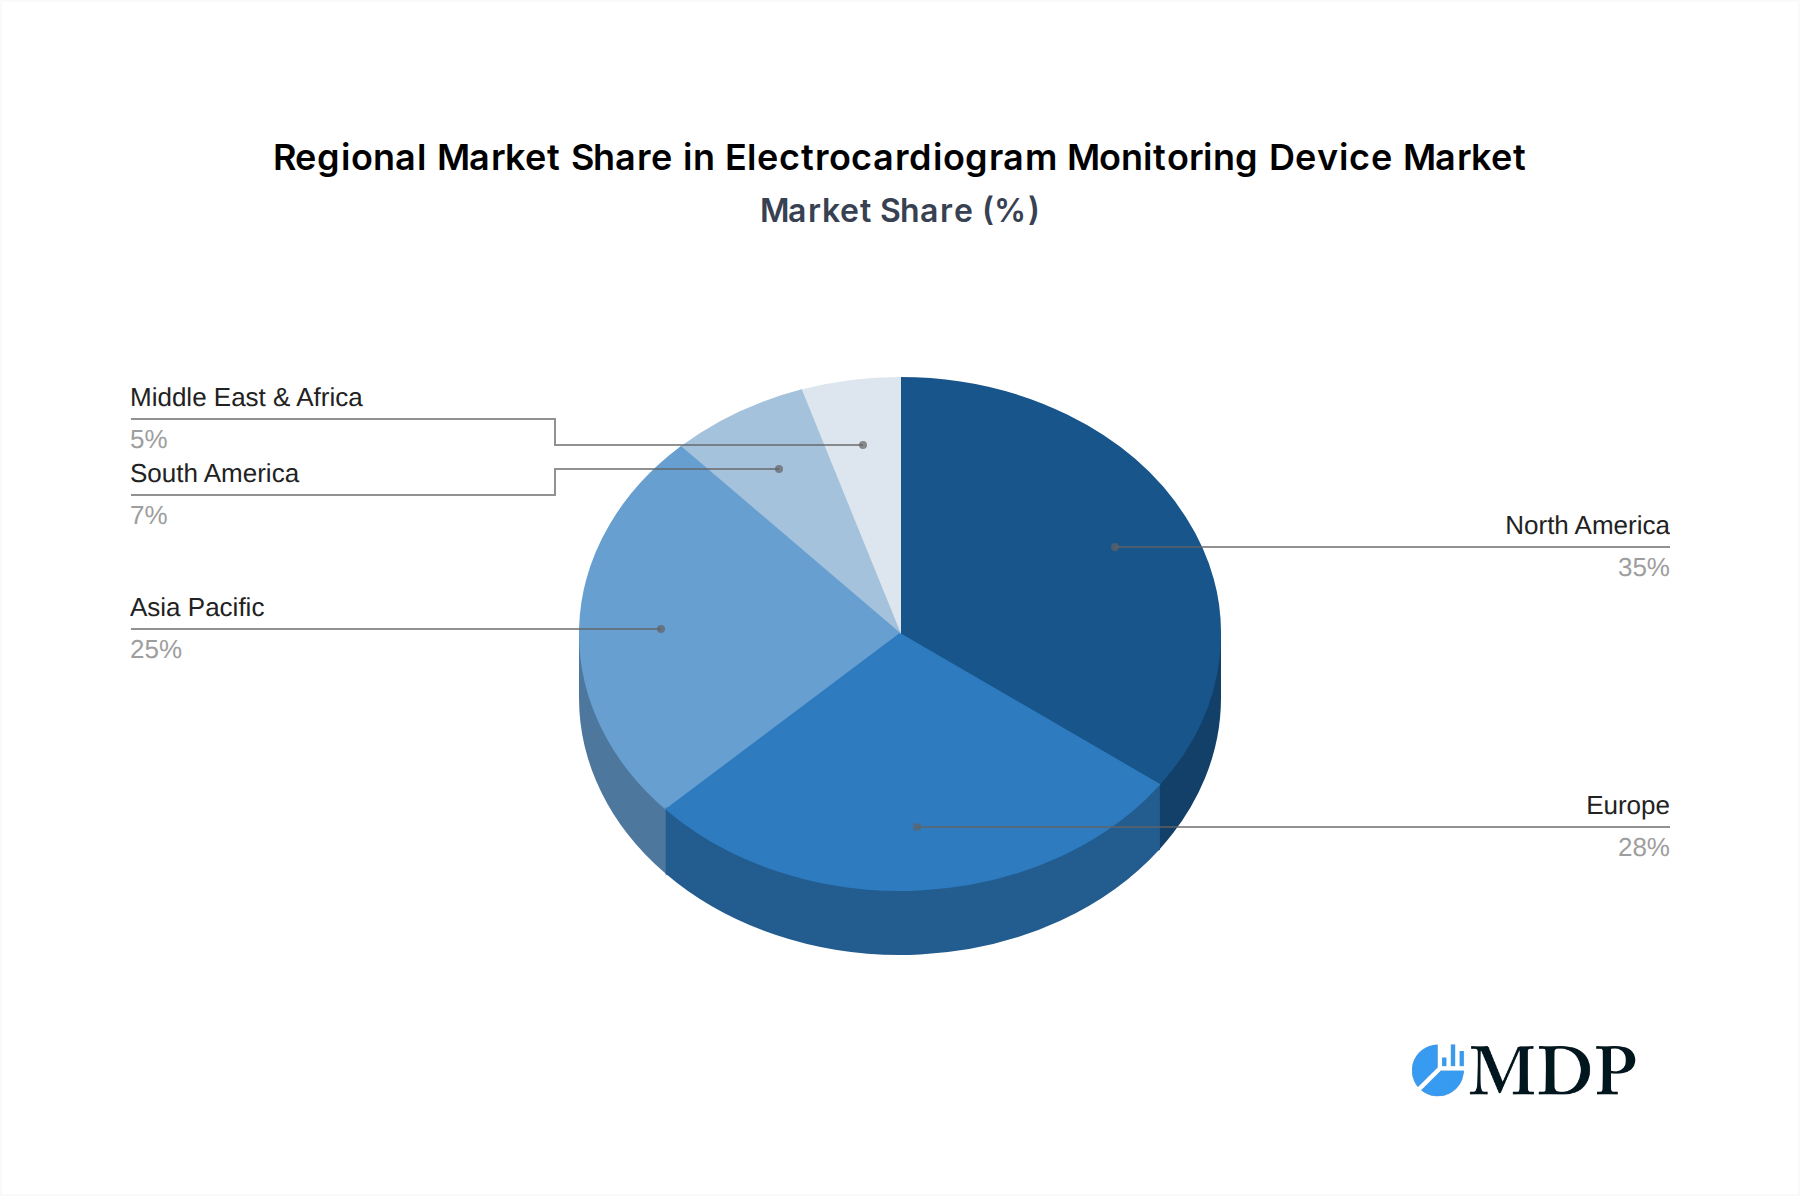
The global Electrocardiogram (ECG) monitoring device market exhibits distinct regional and segment leadership. North America currently dominates the market, driven by high healthcare spending, advanced technological adoption, and a well-established healthcare infrastructure. The United States, in particular, represents a significant share due to its large patient population and the presence of major medical device manufacturers.
Application Dominance:
- Hospitals: This segment holds the largest market share, accounting for over XX billion dollars. Hospitals rely heavily on stationary and portable ECG devices for critical care, diagnosis, and in-patient monitoring. The increasing number of cardiac procedures and the need for continuous patient monitoring in critical care units fuel this segment's growth. Economic policies supporting advanced medical equipment procurement and the expansion of hospital infrastructure contribute to its dominance.
- Clinics: Clinics represent a rapidly growing segment, with a market value estimated at over XX billion dollars. The increasing focus on outpatient cardiac care and the adoption of point-of-care diagnostic tools in smaller healthcare settings are key drivers.
- Other: This segment, including home healthcare and remote monitoring services, is witnessing exponential growth, projected to exceed XX billion dollars by 2033.
Type Dominance:
- Stationary Type: While historically dominant, stationary ECG devices, used in hospitals and diagnostic centers, still command a significant market share of over XX billion dollars due to their advanced features and critical role in acute care settings.
- Portable Type: The portable ECG monitoring device segment is experiencing the fastest growth, with a projected market value of over XX billion dollars. This surge is attributed to the rise of wearable ECG monitors, Holter monitors, and mobile cardiac telemetry devices, catering to the demand for continuous and ambulatory monitoring. Factors like increasing chronic disease management, preference for non-invasive diagnostics, and advancements in battery life and data transmission capabilities are propelling this segment forward.
Electrocardiogram Monitoring Device Product Developments
Recent product developments in the ECG monitoring device market are characterized by significant innovations aimed at enhancing accuracy, portability, and data analysis capabilities. Companies are focusing on developing AI-driven algorithms that can detect subtle cardiac anomalies with greater precision, reducing false positives and negatives. The integration of Bluetooth and Wi-Fi connectivity allows for seamless data transfer to smartphones and cloud platforms, enabling remote patient monitoring and telehealth applications. Furthermore, the miniaturization of devices has led to the emergence of advanced wearable ECG patches and smartwatches capable of continuous, long-term monitoring. These innovations offer distinct competitive advantages by improving patient compliance, providing real-time insights to clinicians, and enabling early intervention for cardiovascular conditions.
Key Drivers of Electrocardiogram Monitoring Device Growth
The Electrocardiogram (ECG) monitoring device market is propelled by several key drivers. The escalating global burden of cardiovascular diseases, including arrhythmias and heart failure, creates a consistent and growing demand for accurate diagnostic tools. Technological advancements, such as the development of AI-powered analytics for improved diagnostic accuracy and the miniaturization of devices leading to wearable solutions, are significant growth catalysts. Favorable reimbursement policies and government initiatives promoting early detection and remote patient monitoring further incentivize the adoption of these devices. The increasing focus on preventative healthcare and the growing awareness among patients about cardiac health also contribute to market expansion.
Challenges in the Electrocardiogram Monitoring Device Market
Despite its robust growth, the Electrocardiogram (ECG) monitoring device market faces certain challenges. Stringent regulatory approval processes, which can be lengthy and costly, pose a barrier to market entry for new technologies. High development and manufacturing costs associated with advanced ECG devices can impact affordability and accessibility, particularly in emerging economies. Moreover, data security and privacy concerns surrounding the transmission and storage of sensitive patient information are critical challenges that require robust solutions. Intense competition among established players and emerging startups also exerts pressure on pricing and profit margins.
Emerging Opportunities in Electrocardiogram Monitoring Device
The Electrocardiogram (ECG) monitoring device market is ripe with emerging opportunities. The expanding application of AI and machine learning for predictive cardiac risk assessment and personalized treatment plans presents a significant growth avenue. The increasing adoption of telehealth and remote patient monitoring platforms creates a substantial market for connected ECG devices and associated software solutions. Strategic partnerships between medical device manufacturers, technology companies, and healthcare providers are crucial for developing integrated healthcare ecosystems. Furthermore, the untapped potential in emerging markets, with their growing healthcare infrastructure and increasing disposable incomes, offers significant expansion opportunities.
Leading Players in the Electrocardiogram Monitoring Device Sector
- GE Healthcare
- Philips
- BioTelemetry
- Suzuken
- Fukuda Denshi
- Hill-Rom
- NIHON KOHDEN
- Mindray Medical
- Spacelabs Healthcare
- Schiller AG
- Innomed
- EDAN
- Novosense
Key Milestones in Electrocardiogram Monitoring Device Industry
- 2019: Launch of advanced wearable ECG patches offering extended monitoring periods.
- 2020: Significant increase in demand for remote cardiac monitoring solutions due to the COVID-19 pandemic.
- 2021: FDA clearance for new AI algorithms designed to detect atrial fibrillation with higher accuracy.
- 2022: Major acquisition of a leading wearable ECG technology company by a global medical device giant.
- 2023: Introduction of cloud-based platforms enabling seamless ECG data integration and analysis across multiple healthcare providers.
- 2024: Development of miniature, implantable ECG sensors for long-term cardiac surveillance.
Strategic Outlook for Electrocardiogram Monitoring Device Market
The strategic outlook for the Electrocardiogram (ECG) monitoring device market is exceptionally positive, driven by continued technological innovation and increasing global demand for cardiac healthcare solutions. The emphasis on preventative care and the growing acceptance of remote patient monitoring will fuel the adoption of portable and wearable ECG devices. Strategic collaborations and partnerships will be crucial for companies to leverage their strengths, expand market reach, and develop integrated healthcare solutions. Investments in AI-driven diagnostics and data analytics will be paramount for maintaining a competitive edge. Furthermore, companies that can effectively address regulatory challenges and data security concerns will be well-positioned for sustained growth in this dynamic market. The market is expected to witness significant expansion as these technologies become more accessible and integrated into mainstream healthcare practices.
Electrocardiogram Monitoring Device Segmentation
-
1. Application
- 1.1. Hospitals
- 1.2. Clinics
- 1.3. Other
-
2. Type
- 2.1. Stationary Type
- 2.2. Portable Type
Electrocardiogram Monitoring Device Segmentation By Geography
-
1. North America
- 1.1. United States
- 1.2. Canada
- 1.3. Mexico
-
2. South America
- 2.1. Brazil
- 2.2. Argentina
- 2.3. Rest of South America
-
3. Europe
- 3.1. United Kingdom
- 3.2. Germany
- 3.3. France
- 3.4. Italy
- 3.5. Spain
- 3.6. Russia
- 3.7. Benelux
- 3.8. Nordics
- 3.9. Rest of Europe
-
4. Middle East & Africa
- 4.1. Turkey
- 4.2. Israel
- 4.3. GCC
- 4.4. North Africa
- 4.5. South Africa
- 4.6. Rest of Middle East & Africa
-
5. Asia Pacific
- 5.1. China
- 5.2. India
- 5.3. Japan
- 5.4. South Korea
- 5.5. ASEAN
- 5.6. Oceania
- 5.7. Rest of Asia Pacific
Electrocardiogram Monitoring Device Regional Market Share
Geographic Coverage of Electrocardiogram Monitoring Device
Electrocardiogram Monitoring Device REPORT HIGHLIGHTS
| Aspects | Details |
|---|---|
| Study Period | 2020-2034 |
| Base Year | 2025 |
| Estimated Year | 2026 |
| Forecast Period | 2026-2034 |
| Historical Period | 2020-2025 |
| Growth Rate | CAGR of 7.3% from 2020-2034 |
| Segmentation |
|
Table of Contents
- 1. Introduction
- 1.1. Research Scope
- 1.2. Market Segmentation
- 1.3. Research Methodology
- 1.4. Definitions and Assumptions
- 2. Executive Summary
- 2.1. Introduction
- 3. Market Dynamics
- 3.1. Introduction
- 3.2. Market Drivers
- 3.3. Market Restrains
- 3.4. Market Trends
- 4. Market Factor Analysis
- 4.1. Porters Five Forces
- 4.2. Supply/Value Chain
- 4.3. PESTEL analysis
- 4.4. Market Entropy
- 4.5. Patent/Trademark Analysis
- 5. Global Electrocardiogram Monitoring Device Analysis, Insights and Forecast, 2020-2032
- 5.1. Market Analysis, Insights and Forecast - by Application
- 5.1.1. Hospitals
- 5.1.2. Clinics
- 5.1.3. Other
- 5.2. Market Analysis, Insights and Forecast - by Type
- 5.2.1. Stationary Type
- 5.2.2. Portable Type
- 5.3. Market Analysis, Insights and Forecast - by Region
- 5.3.1. North America
- 5.3.2. South America
- 5.3.3. Europe
- 5.3.4. Middle East & Africa
- 5.3.5. Asia Pacific
- 5.1. Market Analysis, Insights and Forecast - by Application
- 6. North America Electrocardiogram Monitoring Device Analysis, Insights and Forecast, 2020-2032
- 6.1. Market Analysis, Insights and Forecast - by Application
- 6.1.1. Hospitals
- 6.1.2. Clinics
- 6.1.3. Other
- 6.2. Market Analysis, Insights and Forecast - by Type
- 6.2.1. Stationary Type
- 6.2.2. Portable Type
- 6.1. Market Analysis, Insights and Forecast - by Application
- 7. South America Electrocardiogram Monitoring Device Analysis, Insights and Forecast, 2020-2032
- 7.1. Market Analysis, Insights and Forecast - by Application
- 7.1.1. Hospitals
- 7.1.2. Clinics
- 7.1.3. Other
- 7.2. Market Analysis, Insights and Forecast - by Type
- 7.2.1. Stationary Type
- 7.2.2. Portable Type
- 7.1. Market Analysis, Insights and Forecast - by Application
- 8. Europe Electrocardiogram Monitoring Device Analysis, Insights and Forecast, 2020-2032
- 8.1. Market Analysis, Insights and Forecast - by Application
- 8.1.1. Hospitals
- 8.1.2. Clinics
- 8.1.3. Other
- 8.2. Market Analysis, Insights and Forecast - by Type
- 8.2.1. Stationary Type
- 8.2.2. Portable Type
- 8.1. Market Analysis, Insights and Forecast - by Application
- 9. Middle East & Africa Electrocardiogram Monitoring Device Analysis, Insights and Forecast, 2020-2032
- 9.1. Market Analysis, Insights and Forecast - by Application
- 9.1.1. Hospitals
- 9.1.2. Clinics
- 9.1.3. Other
- 9.2. Market Analysis, Insights and Forecast - by Type
- 9.2.1. Stationary Type
- 9.2.2. Portable Type
- 9.1. Market Analysis, Insights and Forecast - by Application
- 10. Asia Pacific Electrocardiogram Monitoring Device Analysis, Insights and Forecast, 2020-2032
- 10.1. Market Analysis, Insights and Forecast - by Application
- 10.1.1. Hospitals
- 10.1.2. Clinics
- 10.1.3. Other
- 10.2. Market Analysis, Insights and Forecast - by Type
- 10.2.1. Stationary Type
- 10.2.2. Portable Type
- 10.1. Market Analysis, Insights and Forecast - by Application
- 11. Competitive Analysis
- 11.1. Global Market Share Analysis 2025
- 11.2. Company Profiles
- 11.2.1 GE Healthcare
- 11.2.1.1. Overview
- 11.2.1.2. Products
- 11.2.1.3. SWOT Analysis
- 11.2.1.4. Recent Developments
- 11.2.1.5. Financials (Based on Availability)
- 11.2.2 Philips
- 11.2.2.1. Overview
- 11.2.2.2. Products
- 11.2.2.3. SWOT Analysis
- 11.2.2.4. Recent Developments
- 11.2.2.5. Financials (Based on Availability)
- 11.2.3 BioTelemetry
- 11.2.3.1. Overview
- 11.2.3.2. Products
- 11.2.3.3. SWOT Analysis
- 11.2.3.4. Recent Developments
- 11.2.3.5. Financials (Based on Availability)
- 11.2.4 Suzuken
- 11.2.4.1. Overview
- 11.2.4.2. Products
- 11.2.4.3. SWOT Analysis
- 11.2.4.4. Recent Developments
- 11.2.4.5. Financials (Based on Availability)
- 11.2.5 Fukuda Denshi
- 11.2.5.1. Overview
- 11.2.5.2. Products
- 11.2.5.3. SWOT Analysis
- 11.2.5.4. Recent Developments
- 11.2.5.5. Financials (Based on Availability)
- 11.2.6 Hill-Rom
- 11.2.6.1. Overview
- 11.2.6.2. Products
- 11.2.6.3. SWOT Analysis
- 11.2.6.4. Recent Developments
- 11.2.6.5. Financials (Based on Availability)
- 11.2.7 NIHON KOHDEN
- 11.2.7.1. Overview
- 11.2.7.2. Products
- 11.2.7.3. SWOT Analysis
- 11.2.7.4. Recent Developments
- 11.2.7.5. Financials (Based on Availability)
- 11.2.8 Mindray Medical
- 11.2.8.1. Overview
- 11.2.8.2. Products
- 11.2.8.3. SWOT Analysis
- 11.2.8.4. Recent Developments
- 11.2.8.5. Financials (Based on Availability)
- 11.2.9 Spacelabs Healthcare
- 11.2.9.1. Overview
- 11.2.9.2. Products
- 11.2.9.3. SWOT Analysis
- 11.2.9.4. Recent Developments
- 11.2.9.5. Financials (Based on Availability)
- 11.2.10 Schiller AG
- 11.2.10.1. Overview
- 11.2.10.2. Products
- 11.2.10.3. SWOT Analysis
- 11.2.10.4. Recent Developments
- 11.2.10.5. Financials (Based on Availability)
- 11.2.11 Innomed
- 11.2.11.1. Overview
- 11.2.11.2. Products
- 11.2.11.3. SWOT Analysis
- 11.2.11.4. Recent Developments
- 11.2.11.5. Financials (Based on Availability)
- 11.2.12 EDAN
- 11.2.12.1. Overview
- 11.2.12.2. Products
- 11.2.12.3. SWOT Analysis
- 11.2.12.4. Recent Developments
- 11.2.12.5. Financials (Based on Availability)
- 11.2.13 Novosense
- 11.2.13.1. Overview
- 11.2.13.2. Products
- 11.2.13.3. SWOT Analysis
- 11.2.13.4. Recent Developments
- 11.2.13.5. Financials (Based on Availability)
- 11.2.1 GE Healthcare
List of Figures
- Figure 1: Global Electrocardiogram Monitoring Device Revenue Breakdown (billion, %) by Region 2025 & 2033
- Figure 2: Global Electrocardiogram Monitoring Device Volume Breakdown (K, %) by Region 2025 & 2033
- Figure 3: North America Electrocardiogram Monitoring Device Revenue (billion), by Application 2025 & 2033
- Figure 4: North America Electrocardiogram Monitoring Device Volume (K), by Application 2025 & 2033
- Figure 5: North America Electrocardiogram Monitoring Device Revenue Share (%), by Application 2025 & 2033
- Figure 6: North America Electrocardiogram Monitoring Device Volume Share (%), by Application 2025 & 2033
- Figure 7: North America Electrocardiogram Monitoring Device Revenue (billion), by Type 2025 & 2033
- Figure 8: North America Electrocardiogram Monitoring Device Volume (K), by Type 2025 & 2033
- Figure 9: North America Electrocardiogram Monitoring Device Revenue Share (%), by Type 2025 & 2033
- Figure 10: North America Electrocardiogram Monitoring Device Volume Share (%), by Type 2025 & 2033
- Figure 11: North America Electrocardiogram Monitoring Device Revenue (billion), by Country 2025 & 2033
- Figure 12: North America Electrocardiogram Monitoring Device Volume (K), by Country 2025 & 2033
- Figure 13: North America Electrocardiogram Monitoring Device Revenue Share (%), by Country 2025 & 2033
- Figure 14: North America Electrocardiogram Monitoring Device Volume Share (%), by Country 2025 & 2033
- Figure 15: South America Electrocardiogram Monitoring Device Revenue (billion), by Application 2025 & 2033
- Figure 16: South America Electrocardiogram Monitoring Device Volume (K), by Application 2025 & 2033
- Figure 17: South America Electrocardiogram Monitoring Device Revenue Share (%), by Application 2025 & 2033
- Figure 18: South America Electrocardiogram Monitoring Device Volume Share (%), by Application 2025 & 2033
- Figure 19: South America Electrocardiogram Monitoring Device Revenue (billion), by Type 2025 & 2033
- Figure 20: South America Electrocardiogram Monitoring Device Volume (K), by Type 2025 & 2033
- Figure 21: South America Electrocardiogram Monitoring Device Revenue Share (%), by Type 2025 & 2033
- Figure 22: South America Electrocardiogram Monitoring Device Volume Share (%), by Type 2025 & 2033
- Figure 23: South America Electrocardiogram Monitoring Device Revenue (billion), by Country 2025 & 2033
- Figure 24: South America Electrocardiogram Monitoring Device Volume (K), by Country 2025 & 2033
- Figure 25: South America Electrocardiogram Monitoring Device Revenue Share (%), by Country 2025 & 2033
- Figure 26: South America Electrocardiogram Monitoring Device Volume Share (%), by Country 2025 & 2033
- Figure 27: Europe Electrocardiogram Monitoring Device Revenue (billion), by Application 2025 & 2033
- Figure 28: Europe Electrocardiogram Monitoring Device Volume (K), by Application 2025 & 2033
- Figure 29: Europe Electrocardiogram Monitoring Device Revenue Share (%), by Application 2025 & 2033
- Figure 30: Europe Electrocardiogram Monitoring Device Volume Share (%), by Application 2025 & 2033
- Figure 31: Europe Electrocardiogram Monitoring Device Revenue (billion), by Type 2025 & 2033
- Figure 32: Europe Electrocardiogram Monitoring Device Volume (K), by Type 2025 & 2033
- Figure 33: Europe Electrocardiogram Monitoring Device Revenue Share (%), by Type 2025 & 2033
- Figure 34: Europe Electrocardiogram Monitoring Device Volume Share (%), by Type 2025 & 2033
- Figure 35: Europe Electrocardiogram Monitoring Device Revenue (billion), by Country 2025 & 2033
- Figure 36: Europe Electrocardiogram Monitoring Device Volume (K), by Country 2025 & 2033
- Figure 37: Europe Electrocardiogram Monitoring Device Revenue Share (%), by Country 2025 & 2033
- Figure 38: Europe Electrocardiogram Monitoring Device Volume Share (%), by Country 2025 & 2033
- Figure 39: Middle East & Africa Electrocardiogram Monitoring Device Revenue (billion), by Application 2025 & 2033
- Figure 40: Middle East & Africa Electrocardiogram Monitoring Device Volume (K), by Application 2025 & 2033
- Figure 41: Middle East & Africa Electrocardiogram Monitoring Device Revenue Share (%), by Application 2025 & 2033
- Figure 42: Middle East & Africa Electrocardiogram Monitoring Device Volume Share (%), by Application 2025 & 2033
- Figure 43: Middle East & Africa Electrocardiogram Monitoring Device Revenue (billion), by Type 2025 & 2033
- Figure 44: Middle East & Africa Electrocardiogram Monitoring Device Volume (K), by Type 2025 & 2033
- Figure 45: Middle East & Africa Electrocardiogram Monitoring Device Revenue Share (%), by Type 2025 & 2033
- Figure 46: Middle East & Africa Electrocardiogram Monitoring Device Volume Share (%), by Type 2025 & 2033
- Figure 47: Middle East & Africa Electrocardiogram Monitoring Device Revenue (billion), by Country 2025 & 2033
- Figure 48: Middle East & Africa Electrocardiogram Monitoring Device Volume (K), by Country 2025 & 2033
- Figure 49: Middle East & Africa Electrocardiogram Monitoring Device Revenue Share (%), by Country 2025 & 2033
- Figure 50: Middle East & Africa Electrocardiogram Monitoring Device Volume Share (%), by Country 2025 & 2033
- Figure 51: Asia Pacific Electrocardiogram Monitoring Device Revenue (billion), by Application 2025 & 2033
- Figure 52: Asia Pacific Electrocardiogram Monitoring Device Volume (K), by Application 2025 & 2033
- Figure 53: Asia Pacific Electrocardiogram Monitoring Device Revenue Share (%), by Application 2025 & 2033
- Figure 54: Asia Pacific Electrocardiogram Monitoring Device Volume Share (%), by Application 2025 & 2033
- Figure 55: Asia Pacific Electrocardiogram Monitoring Device Revenue (billion), by Type 2025 & 2033
- Figure 56: Asia Pacific Electrocardiogram Monitoring Device Volume (K), by Type 2025 & 2033
- Figure 57: Asia Pacific Electrocardiogram Monitoring Device Revenue Share (%), by Type 2025 & 2033
- Figure 58: Asia Pacific Electrocardiogram Monitoring Device Volume Share (%), by Type 2025 & 2033
- Figure 59: Asia Pacific Electrocardiogram Monitoring Device Revenue (billion), by Country 2025 & 2033
- Figure 60: Asia Pacific Electrocardiogram Monitoring Device Volume (K), by Country 2025 & 2033
- Figure 61: Asia Pacific Electrocardiogram Monitoring Device Revenue Share (%), by Country 2025 & 2033
- Figure 62: Asia Pacific Electrocardiogram Monitoring Device Volume Share (%), by Country 2025 & 2033
List of Tables
- Table 1: Global Electrocardiogram Monitoring Device Revenue billion Forecast, by Application 2020 & 2033
- Table 2: Global Electrocardiogram Monitoring Device Volume K Forecast, by Application 2020 & 2033
- Table 3: Global Electrocardiogram Monitoring Device Revenue billion Forecast, by Type 2020 & 2033
- Table 4: Global Electrocardiogram Monitoring Device Volume K Forecast, by Type 2020 & 2033
- Table 5: Global Electrocardiogram Monitoring Device Revenue billion Forecast, by Region 2020 & 2033
- Table 6: Global Electrocardiogram Monitoring Device Volume K Forecast, by Region 2020 & 2033
- Table 7: Global Electrocardiogram Monitoring Device Revenue billion Forecast, by Application 2020 & 2033
- Table 8: Global Electrocardiogram Monitoring Device Volume K Forecast, by Application 2020 & 2033
- Table 9: Global Electrocardiogram Monitoring Device Revenue billion Forecast, by Type 2020 & 2033
- Table 10: Global Electrocardiogram Monitoring Device Volume K Forecast, by Type 2020 & 2033
- Table 11: Global Electrocardiogram Monitoring Device Revenue billion Forecast, by Country 2020 & 2033
- Table 12: Global Electrocardiogram Monitoring Device Volume K Forecast, by Country 2020 & 2033
- Table 13: United States Electrocardiogram Monitoring Device Revenue (billion) Forecast, by Application 2020 & 2033
- Table 14: United States Electrocardiogram Monitoring Device Volume (K) Forecast, by Application 2020 & 2033
- Table 15: Canada Electrocardiogram Monitoring Device Revenue (billion) Forecast, by Application 2020 & 2033
- Table 16: Canada Electrocardiogram Monitoring Device Volume (K) Forecast, by Application 2020 & 2033
- Table 17: Mexico Electrocardiogram Monitoring Device Revenue (billion) Forecast, by Application 2020 & 2033
- Table 18: Mexico Electrocardiogram Monitoring Device Volume (K) Forecast, by Application 2020 & 2033
- Table 19: Global Electrocardiogram Monitoring Device Revenue billion Forecast, by Application 2020 & 2033
- Table 20: Global Electrocardiogram Monitoring Device Volume K Forecast, by Application 2020 & 2033
- Table 21: Global Electrocardiogram Monitoring Device Revenue billion Forecast, by Type 2020 & 2033
- Table 22: Global Electrocardiogram Monitoring Device Volume K Forecast, by Type 2020 & 2033
- Table 23: Global Electrocardiogram Monitoring Device Revenue billion Forecast, by Country 2020 & 2033
- Table 24: Global Electrocardiogram Monitoring Device Volume K Forecast, by Country 2020 & 2033
- Table 25: Brazil Electrocardiogram Monitoring Device Revenue (billion) Forecast, by Application 2020 & 2033
- Table 26: Brazil Electrocardiogram Monitoring Device Volume (K) Forecast, by Application 2020 & 2033
- Table 27: Argentina Electrocardiogram Monitoring Device Revenue (billion) Forecast, by Application 2020 & 2033
- Table 28: Argentina Electrocardiogram Monitoring Device Volume (K) Forecast, by Application 2020 & 2033
- Table 29: Rest of South America Electrocardiogram Monitoring Device Revenue (billion) Forecast, by Application 2020 & 2033
- Table 30: Rest of South America Electrocardiogram Monitoring Device Volume (K) Forecast, by Application 2020 & 2033
- Table 31: Global Electrocardiogram Monitoring Device Revenue billion Forecast, by Application 2020 & 2033
- Table 32: Global Electrocardiogram Monitoring Device Volume K Forecast, by Application 2020 & 2033
- Table 33: Global Electrocardiogram Monitoring Device Revenue billion Forecast, by Type 2020 & 2033
- Table 34: Global Electrocardiogram Monitoring Device Volume K Forecast, by Type 2020 & 2033
- Table 35: Global Electrocardiogram Monitoring Device Revenue billion Forecast, by Country 2020 & 2033
- Table 36: Global Electrocardiogram Monitoring Device Volume K Forecast, by Country 2020 & 2033
- Table 37: United Kingdom Electrocardiogram Monitoring Device Revenue (billion) Forecast, by Application 2020 & 2033
- Table 38: United Kingdom Electrocardiogram Monitoring Device Volume (K) Forecast, by Application 2020 & 2033
- Table 39: Germany Electrocardiogram Monitoring Device Revenue (billion) Forecast, by Application 2020 & 2033
- Table 40: Germany Electrocardiogram Monitoring Device Volume (K) Forecast, by Application 2020 & 2033
- Table 41: France Electrocardiogram Monitoring Device Revenue (billion) Forecast, by Application 2020 & 2033
- Table 42: France Electrocardiogram Monitoring Device Volume (K) Forecast, by Application 2020 & 2033
- Table 43: Italy Electrocardiogram Monitoring Device Revenue (billion) Forecast, by Application 2020 & 2033
- Table 44: Italy Electrocardiogram Monitoring Device Volume (K) Forecast, by Application 2020 & 2033
- Table 45: Spain Electrocardiogram Monitoring Device Revenue (billion) Forecast, by Application 2020 & 2033
- Table 46: Spain Electrocardiogram Monitoring Device Volume (K) Forecast, by Application 2020 & 2033
- Table 47: Russia Electrocardiogram Monitoring Device Revenue (billion) Forecast, by Application 2020 & 2033
- Table 48: Russia Electrocardiogram Monitoring Device Volume (K) Forecast, by Application 2020 & 2033
- Table 49: Benelux Electrocardiogram Monitoring Device Revenue (billion) Forecast, by Application 2020 & 2033
- Table 50: Benelux Electrocardiogram Monitoring Device Volume (K) Forecast, by Application 2020 & 2033
- Table 51: Nordics Electrocardiogram Monitoring Device Revenue (billion) Forecast, by Application 2020 & 2033
- Table 52: Nordics Electrocardiogram Monitoring Device Volume (K) Forecast, by Application 2020 & 2033
- Table 53: Rest of Europe Electrocardiogram Monitoring Device Revenue (billion) Forecast, by Application 2020 & 2033
- Table 54: Rest of Europe Electrocardiogram Monitoring Device Volume (K) Forecast, by Application 2020 & 2033
- Table 55: Global Electrocardiogram Monitoring Device Revenue billion Forecast, by Application 2020 & 2033
- Table 56: Global Electrocardiogram Monitoring Device Volume K Forecast, by Application 2020 & 2033
- Table 57: Global Electrocardiogram Monitoring Device Revenue billion Forecast, by Type 2020 & 2033
- Table 58: Global Electrocardiogram Monitoring Device Volume K Forecast, by Type 2020 & 2033
- Table 59: Global Electrocardiogram Monitoring Device Revenue billion Forecast, by Country 2020 & 2033
- Table 60: Global Electrocardiogram Monitoring Device Volume K Forecast, by Country 2020 & 2033
- Table 61: Turkey Electrocardiogram Monitoring Device Revenue (billion) Forecast, by Application 2020 & 2033
- Table 62: Turkey Electrocardiogram Monitoring Device Volume (K) Forecast, by Application 2020 & 2033
- Table 63: Israel Electrocardiogram Monitoring Device Revenue (billion) Forecast, by Application 2020 & 2033
- Table 64: Israel Electrocardiogram Monitoring Device Volume (K) Forecast, by Application 2020 & 2033
- Table 65: GCC Electrocardiogram Monitoring Device Revenue (billion) Forecast, by Application 2020 & 2033
- Table 66: GCC Electrocardiogram Monitoring Device Volume (K) Forecast, by Application 2020 & 2033
- Table 67: North Africa Electrocardiogram Monitoring Device Revenue (billion) Forecast, by Application 2020 & 2033
- Table 68: North Africa Electrocardiogram Monitoring Device Volume (K) Forecast, by Application 2020 & 2033
- Table 69: South Africa Electrocardiogram Monitoring Device Revenue (billion) Forecast, by Application 2020 & 2033
- Table 70: South Africa Electrocardiogram Monitoring Device Volume (K) Forecast, by Application 2020 & 2033
- Table 71: Rest of Middle East & Africa Electrocardiogram Monitoring Device Revenue (billion) Forecast, by Application 2020 & 2033
- Table 72: Rest of Middle East & Africa Electrocardiogram Monitoring Device Volume (K) Forecast, by Application 2020 & 2033
- Table 73: Global Electrocardiogram Monitoring Device Revenue billion Forecast, by Application 2020 & 2033
- Table 74: Global Electrocardiogram Monitoring Device Volume K Forecast, by Application 2020 & 2033
- Table 75: Global Electrocardiogram Monitoring Device Revenue billion Forecast, by Type 2020 & 2033
- Table 76: Global Electrocardiogram Monitoring Device Volume K Forecast, by Type 2020 & 2033
- Table 77: Global Electrocardiogram Monitoring Device Revenue billion Forecast, by Country 2020 & 2033
- Table 78: Global Electrocardiogram Monitoring Device Volume K Forecast, by Country 2020 & 2033
- Table 79: China Electrocardiogram Monitoring Device Revenue (billion) Forecast, by Application 2020 & 2033
- Table 80: China Electrocardiogram Monitoring Device Volume (K) Forecast, by Application 2020 & 2033
- Table 81: India Electrocardiogram Monitoring Device Revenue (billion) Forecast, by Application 2020 & 2033
- Table 82: India Electrocardiogram Monitoring Device Volume (K) Forecast, by Application 2020 & 2033
- Table 83: Japan Electrocardiogram Monitoring Device Revenue (billion) Forecast, by Application 2020 & 2033
- Table 84: Japan Electrocardiogram Monitoring Device Volume (K) Forecast, by Application 2020 & 2033
- Table 85: South Korea Electrocardiogram Monitoring Device Revenue (billion) Forecast, by Application 2020 & 2033
- Table 86: South Korea Electrocardiogram Monitoring Device Volume (K) Forecast, by Application 2020 & 2033
- Table 87: ASEAN Electrocardiogram Monitoring Device Revenue (billion) Forecast, by Application 2020 & 2033
- Table 88: ASEAN Electrocardiogram Monitoring Device Volume (K) Forecast, by Application 2020 & 2033
- Table 89: Oceania Electrocardiogram Monitoring Device Revenue (billion) Forecast, by Application 2020 & 2033
- Table 90: Oceania Electrocardiogram Monitoring Device Volume (K) Forecast, by Application 2020 & 2033
- Table 91: Rest of Asia Pacific Electrocardiogram Monitoring Device Revenue (billion) Forecast, by Application 2020 & 2033
- Table 92: Rest of Asia Pacific Electrocardiogram Monitoring Device Volume (K) Forecast, by Application 2020 & 2033
Frequently Asked Questions
1. What is the projected Compound Annual Growth Rate (CAGR) of the Electrocardiogram Monitoring Device?
The projected CAGR is approximately 7.3%.
2. Which companies are prominent players in the Electrocardiogram Monitoring Device?
Key companies in the market include GE Healthcare, Philips, BioTelemetry, Suzuken, Fukuda Denshi, Hill-Rom, NIHON KOHDEN, Mindray Medical, Spacelabs Healthcare, Schiller AG, Innomed, EDAN, Novosense.
3. What are the main segments of the Electrocardiogram Monitoring Device?
The market segments include Application, Type.
4. Can you provide details about the market size?
The market size is estimated to be USD 5.29 billion as of 2022.
5. What are some drivers contributing to market growth?
N/A
6. What are the notable trends driving market growth?
N/A
7. Are there any restraints impacting market growth?
N/A
8. Can you provide examples of recent developments in the market?
N/A
9. What pricing options are available for accessing the report?
Pricing options include single-user, multi-user, and enterprise licenses priced at USD 3950.00, USD 5925.00, and USD 7900.00 respectively.
10. Is the market size provided in terms of value or volume?
The market size is provided in terms of value, measured in billion and volume, measured in K.
11. Are there any specific market keywords associated with the report?
Yes, the market keyword associated with the report is "Electrocardiogram Monitoring Device," which aids in identifying and referencing the specific market segment covered.
12. How do I determine which pricing option suits my needs best?
The pricing options vary based on user requirements and access needs. Individual users may opt for single-user licenses, while businesses requiring broader access may choose multi-user or enterprise licenses for cost-effective access to the report.
13. Are there any additional resources or data provided in the Electrocardiogram Monitoring Device report?
While the report offers comprehensive insights, it's advisable to review the specific contents or supplementary materials provided to ascertain if additional resources or data are available.
14. How can I stay updated on further developments or reports in the Electrocardiogram Monitoring Device?
To stay informed about further developments, trends, and reports in the Electrocardiogram Monitoring Device, consider subscribing to industry newsletters, following relevant companies and organizations, or regularly checking reputable industry news sources and publications.
Methodology
Step 1 - Identification of Relevant Samples Size from Population Database


Step 2 - Approaches for Defining Global Market Size (Value, Volume* & Price*)

Note*: In applicable scenarios
Step 3 - Data Sources
Primary Research
- Web Analytics
- Survey Reports
- Research Institute
- Latest Research Reports
- Opinion Leaders
Secondary Research
- Annual Reports
- White Paper
- Latest Press Release
- Industry Association
- Paid Database
- Investor Presentations

Step 4 - Data Triangulation
Involves using different sources of information in order to increase the validity of a study
These sources are likely to be stakeholders in a program - participants, other researchers, program staff, other community members, and so on.
Then we put all data in single framework & apply various statistical tools to find out the dynamic on the market.
During the analysis stage, feedback from the stakeholder groups would be compared to determine areas of agreement as well as areas of divergence