

Key Insights
The global EEG Brain Imaging market is poised for robust expansion, projected to reach an estimated market size of $429 million by 2025, with a compelling Compound Annual Growth Rate (CAGR) of 5.8% during the forecast period of 2025-2033. This significant growth is primarily fueled by the increasing prevalence of neurological disorders such as epilepsy, Alzheimer's disease, and Parkinson's disease, necessitating advanced diagnostic tools like EEG. The rising awareness among healthcare professionals and the general public regarding the early detection and management of these conditions further propel market demand. Furthermore, substantial investments in research and development by leading companies, aimed at innovating and enhancing the capabilities of EEG devices with features like wireless connectivity, improved signal processing, and portable designs, are key drivers. The growing adoption of these sophisticated EEG systems in hospitals and research institutions for both diagnostic and therapeutic applications underpins the market's upward trajectory.
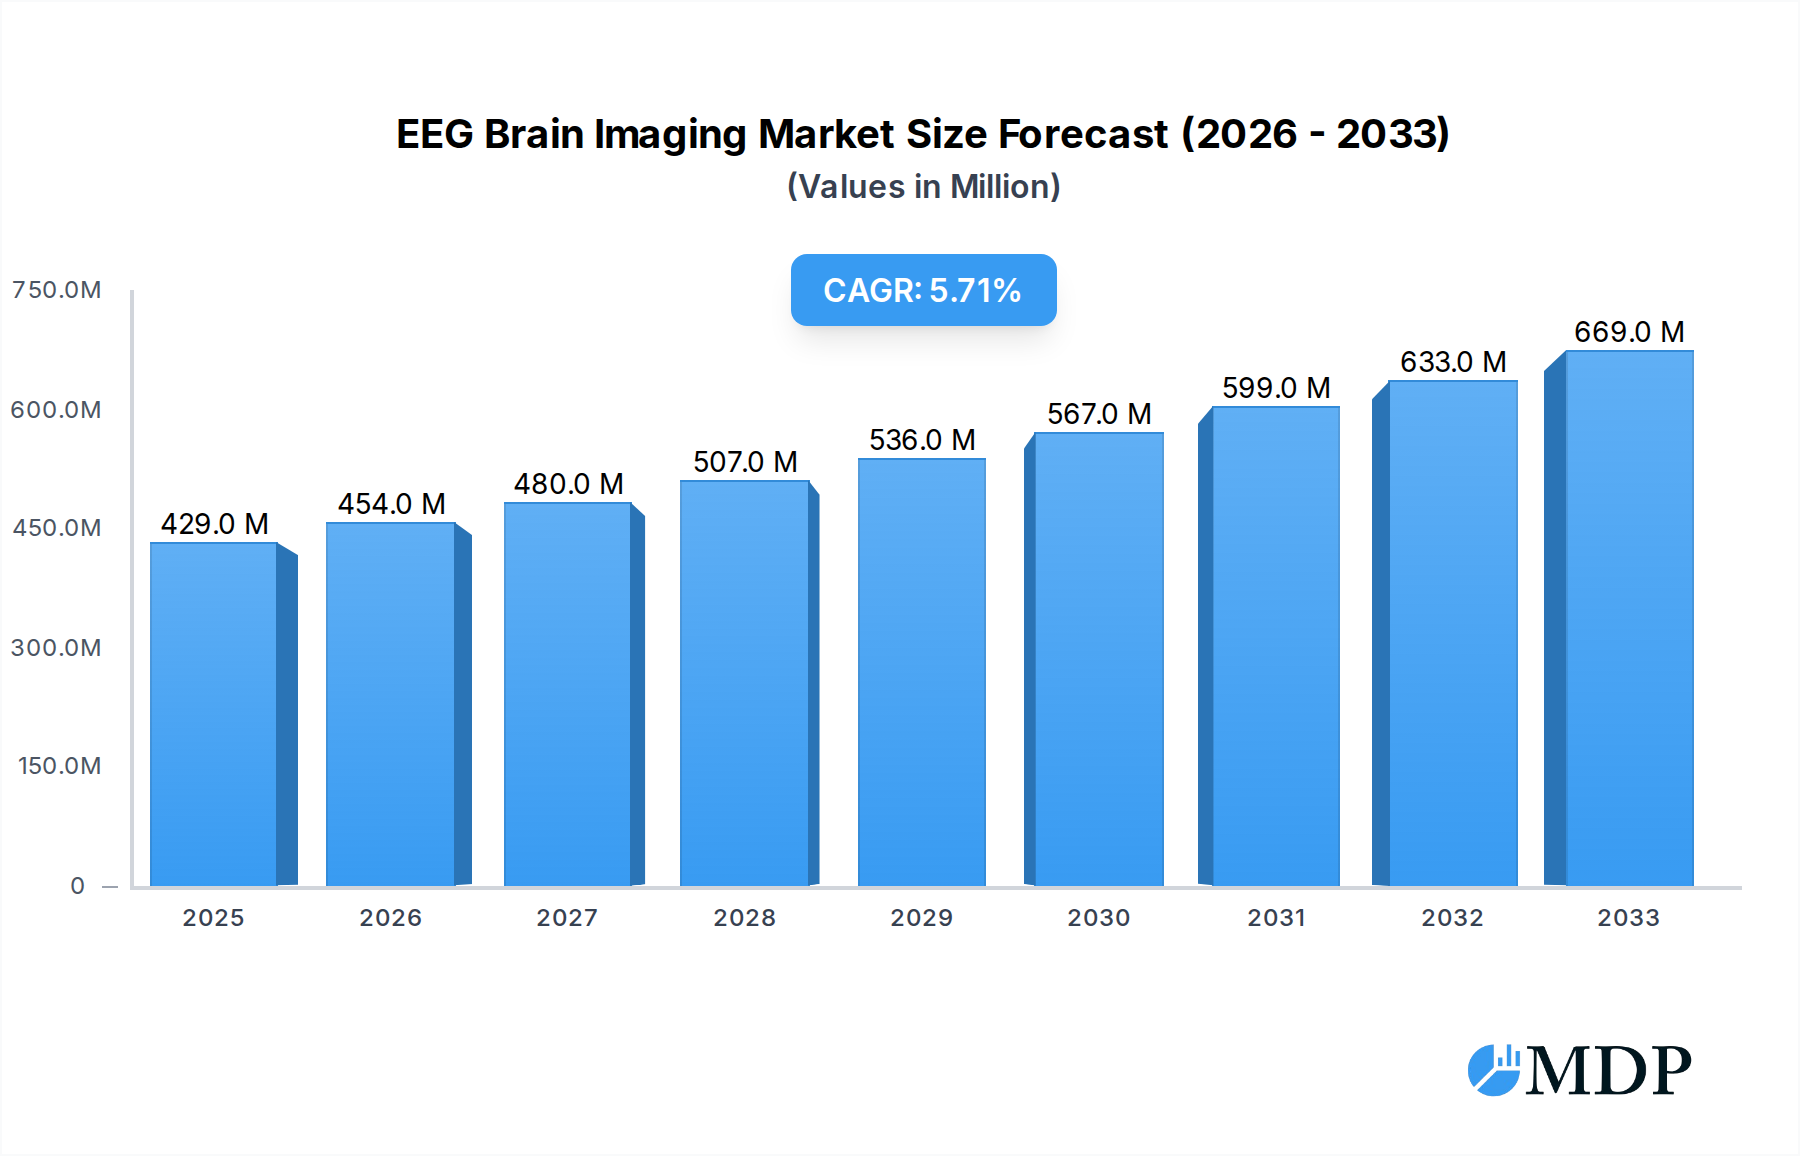
EEG Brain Imaging Market Size (In Million)
The market is segmented by application into hospitals, universities, research institutes, and other segments, with hospitals expected to dominate due to their established infrastructure and patient volume. The university and research institute segments are also anticipated to witness considerable growth, driven by ongoing studies into brain-computer interfaces (BCIs) and advanced neurofeedback applications. By type, the market includes 16-channel, 32-channel, and other advanced EEG systems, with a notable shift towards higher-channel count devices offering greater spatial resolution and diagnostic accuracy. Regional analysis indicates North America as a leading market, owing to high healthcare expenditure and early adoption of advanced medical technologies. Asia Pacific, however, is projected to exhibit the fastest growth, driven by increasing healthcare investments, a rising patient pool for neurological conditions, and a growing number of research initiatives in emerging economies like China and India. While the market is experiencing a strong growth phase, potential restraints include the high cost of advanced EEG systems and the need for skilled personnel to operate and interpret the data accurately.

EEG Brain Imaging Company Market Share
Unlocking the Potential: A Comprehensive Report on the EEG Brain Imaging Market (2019-2033)
This in-depth report provides a panoramic view of the global EEG Brain Imaging market, meticulously analyzing its dynamics, trends, and future trajectory. Spanning the historical period of 2019-2024 and forecasting through 2033, with a base and estimated year of 2025, this research is an indispensable resource for industry stakeholders seeking actionable insights into this rapidly evolving sector. The market is projected to reach a valuation of over one million dollars, driven by advancements in neurological diagnostics and therapeutic interventions.
EEG Brain Imaging Market Dynamics & Concentration
The EEG Brain Imaging market, valued at over one million dollars in the base year of 2025, exhibits a moderate concentration. Key innovation drivers include the relentless pursuit of higher resolution, improved signal-to-noise ratios, and the integration of artificial intelligence for advanced data analysis. Regulatory frameworks, while crucial for ensuring safety and efficacy, can also present barriers to entry. The increasing prevalence of neurological disorders, coupled with a growing understanding of brain function, fuels end-user demand across hospitals, universities, and research institutes. Product substitutes, such as fMRI and MEG, offer alternative imaging modalities, but EEG's non-invasiveness and cost-effectiveness often maintain its competitive edge. Mergers and acquisitions (M&A) are a significant factor shaping market concentration, with approximately xx deals observed historically. Leading companies like Nihon Kohden, Natus Medical, and Medtronic are actively engaged in consolidating their market positions through strategic collaborations and acquisitions, aiming to capture a larger share of the projected over one million dollar market.
EEG Brain Imaging Industry Trends & Analysis
The EEG Brain Imaging industry is poised for robust expansion, projecting a Compound Annual Growth Rate (CAGR) of approximately xx% from 2025 to 2033, propelling its market value beyond one million dollars. This growth is fundamentally underpinned by increasing global healthcare expenditure and a burgeoning demand for sophisticated diagnostic tools in neurology. Technological disruptions are at the forefront, with advancements in dry-electrode technology, miniaturization of EEG devices, and the development of portable, user-friendly systems significantly enhancing accessibility and application scope. The integration of artificial intelligence and machine learning algorithms is revolutionizing data interpretation, enabling faster and more accurate diagnoses of conditions like epilepsy, sleep disorders, and various cognitive impairments. Consumer preferences are shifting towards non-invasive and less burdensome diagnostic procedures, making EEG a preferred choice over more invasive techniques. This trend is further amplified by a growing awareness among the general population regarding brain health and early detection of neurological issues. Competitive dynamics are intensifying, with established players vying for market dominance while agile startups introduce innovative solutions, creating a vibrant ecosystem. The market penetration of advanced EEG systems is steadily increasing, especially in developed economies, but significant opportunities remain in emerging markets, promising substantial growth in the coming years.
Leading Markets & Segments in EEG Brain Imaging
The EEG Brain Imaging market's dominance is characterized by its widespread adoption across various applications and the evolution of its technological types.
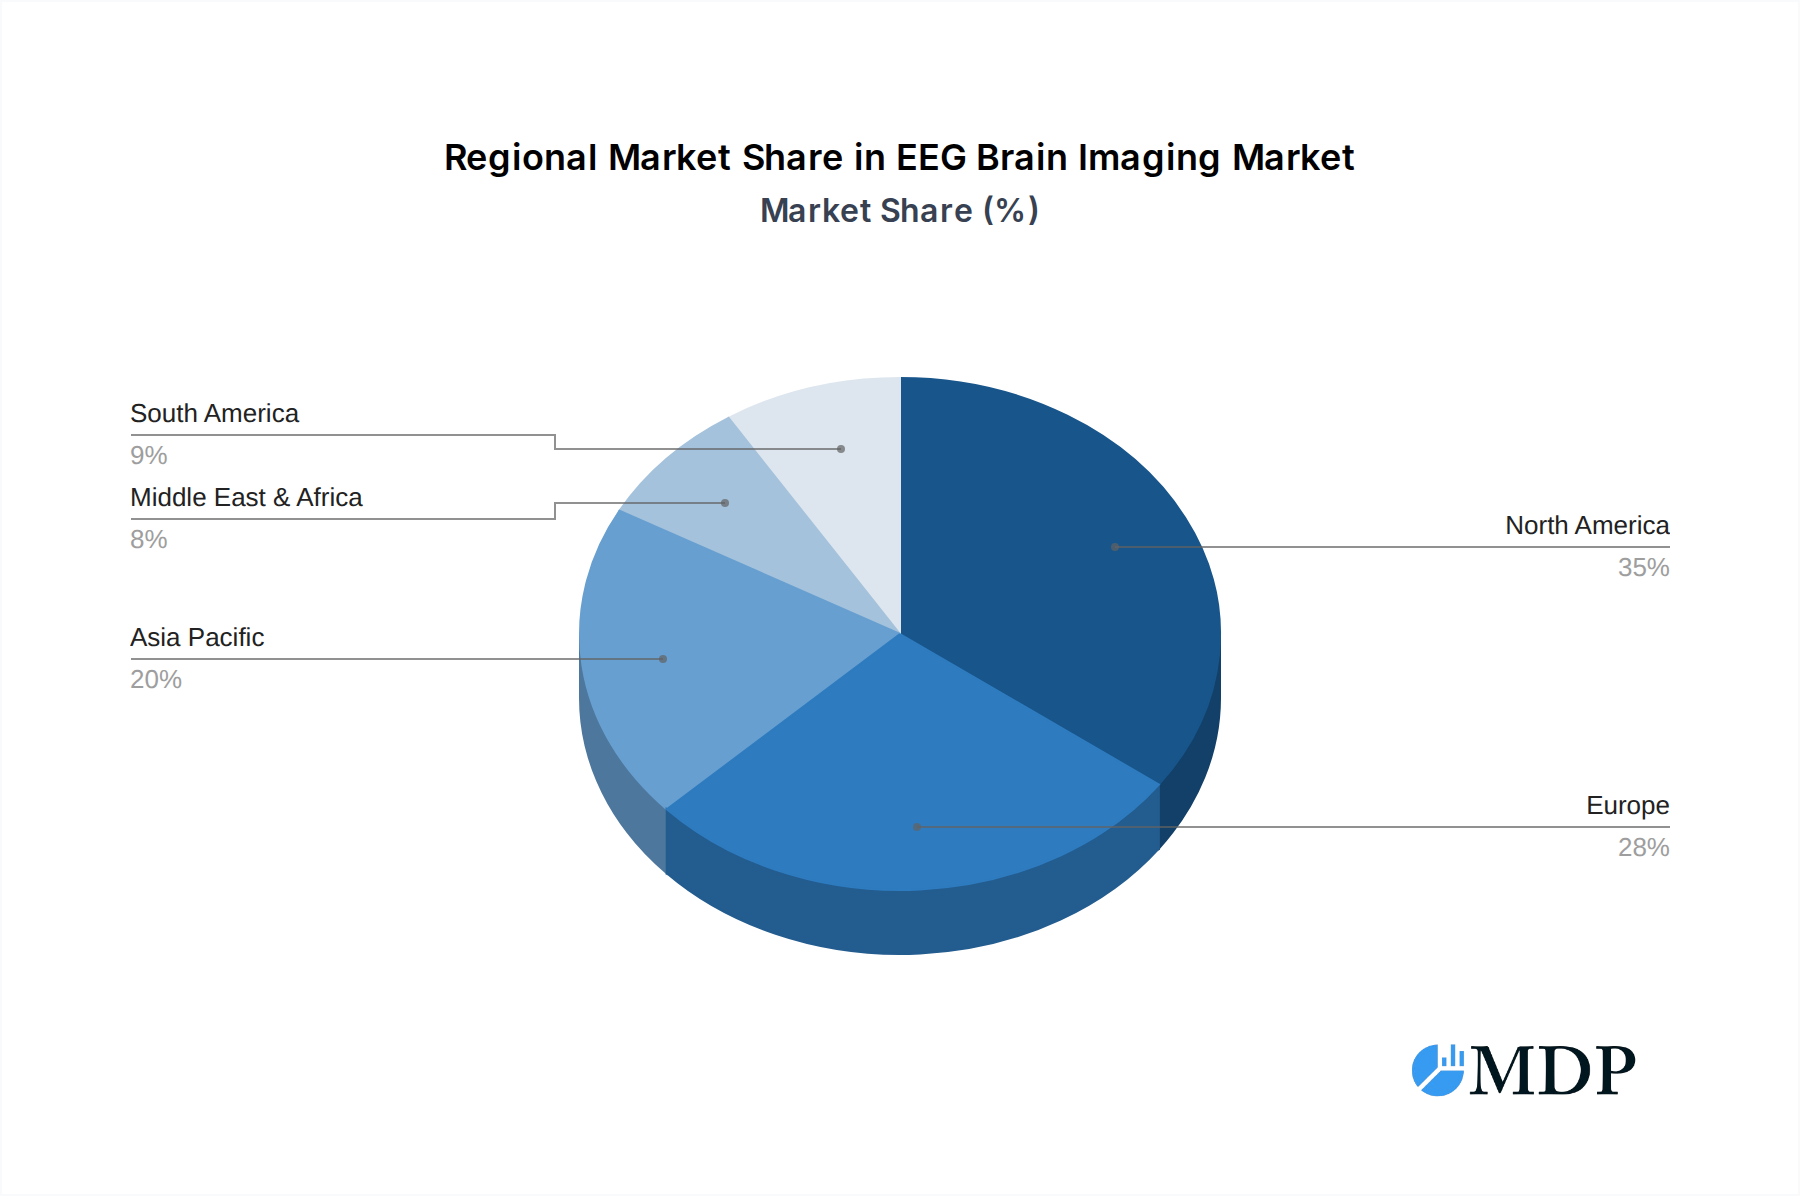
- Dominant Region: North America currently leads the EEG Brain Imaging market, driven by high healthcare spending, a strong research infrastructure, and a high prevalence of neurological disorders. The region's robust economic policies and advanced healthcare infrastructure facilitate the adoption of cutting-edge EEG technologies.
- Key Country: The United States, within North America, stands as the primary market driver. Its significant investment in medical research and development, coupled with a large patient population actively seeking neurological solutions, fuels demand for advanced EEG systems.
- Dominant Application Segment:
- Hospital: Hospitals represent the largest application segment due to their critical role in diagnosing and managing acute and chronic neurological conditions. The demand for real-time monitoring and advanced diagnostic capabilities in critical care settings drives the adoption of sophisticated EEG equipment.
- University: Universities are pivotal in advancing EEG research and developing novel applications, contributing to the market's growth through continuous innovation and talent development. Their demand for high-fidelity research-grade EEG systems is substantial.
- Research Institute: Research institutes are at the forefront of exploring new frontiers in neuroscience, utilizing EEG for studies ranging from cognitive function to brain-computer interfaces. Their specialized research needs contribute to the demand for highly customizable and advanced EEG solutions.
- Dominant Type Segment:
- 32-Channel EEG Systems: These systems offer a good balance between diagnostic accuracy and practical usability, making them the most prevalent choice for clinical and research applications. Their ability to capture nuanced brain activity with sufficient detail for a wide range of neurological assessments drives their market dominance.
- 16-Channel EEG Systems: While less comprehensive than 32-channel systems, 16-channel devices remain popular for simpler diagnostic needs and as entry-level equipment due to their cost-effectiveness and ease of use in less complex scenarios.
EEG Brain Imaging Product Developments
Recent EEG Brain Imaging product developments are characterized by enhanced portability, improved signal quality, and sophisticated data analysis capabilities. Innovations in dry-electrode technology are reducing setup times and improving patient comfort, while miniaturized and wireless systems are enabling more naturalistic data acquisition for ambulatory monitoring. Furthermore, the integration of AI-powered algorithms is enhancing diagnostic accuracy and enabling predictive analytics for neurological conditions, offering significant competitive advantages to manufacturers and improved patient outcomes.
Key Drivers of EEG Brain Imaging Growth
Several key factors are propelling the growth of the EEG Brain Imaging market. Technological advancements, such as the development of high-density EEG caps and AI-driven data interpretation tools, are enhancing diagnostic precision. The rising global incidence of neurological disorders, including epilepsy, Alzheimer's, and Parkinson's disease, is creating a sustained demand for effective diagnostic solutions. Furthermore, increasing government initiatives and healthcare funding aimed at improving neurological care infrastructure and research are providing a significant economic boost to the sector. The growing awareness and acceptance of non-invasive diagnostic methods among patients and healthcare providers also contribute to market expansion.
Challenges in the EEG Brain Imaging Market
Despite its promising growth, the EEG Brain Imaging market faces certain challenges. Stringent regulatory approvals for new devices can prolong time-to-market and increase development costs. The high initial investment required for advanced EEG systems can be a barrier for smaller clinics and research institutions, particularly in developing economies. Moreover, the need for specialized training to operate complex EEG equipment and interpret nuanced data can limit widespread adoption. Competitive pressures from alternative neuroimaging techniques and the constant need for innovation to stay ahead of technological advancements also present ongoing challenges.
Emerging Opportunities in EEG Brain Imaging
Emerging opportunities in the EEG Brain Imaging market are driven by significant technological breakthroughs and strategic market expansion. The development of wearable and consumer-grade EEG devices for wellness and cognitive monitoring presents a vast untapped market. Advancements in brain-computer interfaces (BCIs) are opening new avenues for assistive technologies for individuals with disabilities. Furthermore, the increasing focus on personalized medicine and precision diagnostics is spurring the development of advanced EEG analysis techniques tailored to individual patient profiles. Strategic partnerships between technology developers and healthcare providers are also crucial for accelerating the adoption of novel EEG solutions.
Leading Players in the EEG Brain Imaging Sector
- Nihon Kohden
- Natus Medical
- Medtronic
- Compumedics
- Micromed
- EGI
- Cadwell
- NCC Medical
- SYMTOP
- NEUROWERK
Key Milestones in EEG Brain Imaging Industry
- 2019: Significant advancements in AI algorithms for real-time EEG data analysis introduced, improving diagnostic efficiency.
- 2020: Launch of novel dry-electrode EEG systems, enhancing patient comfort and reducing setup time.
- 2021: Increased investment in research for non-invasive brain stimulation techniques utilizing EEG feedback.
- 2022: FDA approval for advanced EEG-based diagnostic tools for early detection of neurodegenerative diseases.
- 2023: Expansion of cloud-based EEG data management platforms, facilitating remote monitoring and collaboration.
- 2024: Emergence of portable and wearable EEG devices for consumer-level brain health monitoring.
Strategic Outlook for EEG Brain Imaging Market
The strategic outlook for the EEG Brain Imaging market is exceptionally positive, driven by continuous innovation and expanding applications. The integration of artificial intelligence and machine learning will further refine diagnostic accuracy and enable predictive capabilities. Growth accelerators include the increasing demand for non-invasive neurological diagnostics, the development of advanced brain-computer interfaces, and the expansion of home-use EEG devices. Strategic opportunities lie in targeting emerging markets, fostering collaborations for product development, and leveraging advancements in neuroscience to unlock new therapeutic and diagnostic avenues. The market is well-positioned for sustained growth, exceeding one million dollars in valuation throughout the forecast period.
EEG Brain Imaging Segmentation
-
1. Application
- 1.1. Hospital
- 1.2. University
- 1.3. Research Institute
- 1.4. Other
-
2. Types
- 2.1. 16-Channel
- 2.2. 32-Channel
- 2.3. Other
EEG Brain Imaging Segmentation By Geography
-
1. North America
- 1.1. United States
- 1.2. Canada
- 1.3. Mexico
-
2. South America
- 2.1. Brazil
- 2.2. Argentina
- 2.3. Rest of South America
-
3. Europe
- 3.1. United Kingdom
- 3.2. Germany
- 3.3. France
- 3.4. Italy
- 3.5. Spain
- 3.6. Russia
- 3.7. Benelux
- 3.8. Nordics
- 3.9. Rest of Europe
-
4. Middle East & Africa
- 4.1. Turkey
- 4.2. Israel
- 4.3. GCC
- 4.4. North Africa
- 4.5. South Africa
- 4.6. Rest of Middle East & Africa
-
5. Asia Pacific
- 5.1. China
- 5.2. India
- 5.3. Japan
- 5.4. South Korea
- 5.5. ASEAN
- 5.6. Oceania
- 5.7. Rest of Asia Pacific
EEG Brain Imaging Regional Market Share
Geographic Coverage of EEG Brain Imaging
EEG Brain Imaging REPORT HIGHLIGHTS
| Aspects | Details |
|---|---|
| Study Period | 2020-2034 |
| Base Year | 2025 |
| Estimated Year | 2026 |
| Forecast Period | 2026-2034 |
| Historical Period | 2020-2025 |
| Growth Rate | CAGR of 5.8% from 2020-2034 |
| Segmentation |
|
Table of Contents
- 1. Introduction
- 1.1. Research Scope
- 1.2. Market Segmentation
- 1.3. Research Methodology
- 1.4. Definitions and Assumptions
- 2. Executive Summary
- 2.1. Introduction
- 3. Market Dynamics
- 3.1. Introduction
- 3.2. Market Drivers
- 3.3. Market Restrains
- 3.4. Market Trends
- 4. Market Factor Analysis
- 4.1. Porters Five Forces
- 4.2. Supply/Value Chain
- 4.3. PESTEL analysis
- 4.4. Market Entropy
- 4.5. Patent/Trademark Analysis
- 5. Global EEG Brain Imaging Analysis, Insights and Forecast, 2020-2032
- 5.1. Market Analysis, Insights and Forecast - by Application
- 5.1.1. Hospital
- 5.1.2. University
- 5.1.3. Research Institute
- 5.1.4. Other
- 5.2. Market Analysis, Insights and Forecast - by Types
- 5.2.1. 16-Channel
- 5.2.2. 32-Channel
- 5.2.3. Other
- 5.3. Market Analysis, Insights and Forecast - by Region
- 5.3.1. North America
- 5.3.2. South America
- 5.3.3. Europe
- 5.3.4. Middle East & Africa
- 5.3.5. Asia Pacific
- 5.1. Market Analysis, Insights and Forecast - by Application
- 6. North America EEG Brain Imaging Analysis, Insights and Forecast, 2020-2032
- 6.1. Market Analysis, Insights and Forecast - by Application
- 6.1.1. Hospital
- 6.1.2. University
- 6.1.3. Research Institute
- 6.1.4. Other
- 6.2. Market Analysis, Insights and Forecast - by Types
- 6.2.1. 16-Channel
- 6.2.2. 32-Channel
- 6.2.3. Other
- 6.1. Market Analysis, Insights and Forecast - by Application
- 7. South America EEG Brain Imaging Analysis, Insights and Forecast, 2020-2032
- 7.1. Market Analysis, Insights and Forecast - by Application
- 7.1.1. Hospital
- 7.1.2. University
- 7.1.3. Research Institute
- 7.1.4. Other
- 7.2. Market Analysis, Insights and Forecast - by Types
- 7.2.1. 16-Channel
- 7.2.2. 32-Channel
- 7.2.3. Other
- 7.1. Market Analysis, Insights and Forecast - by Application
- 8. Europe EEG Brain Imaging Analysis, Insights and Forecast, 2020-2032
- 8.1. Market Analysis, Insights and Forecast - by Application
- 8.1.1. Hospital
- 8.1.2. University
- 8.1.3. Research Institute
- 8.1.4. Other
- 8.2. Market Analysis, Insights and Forecast - by Types
- 8.2.1. 16-Channel
- 8.2.2. 32-Channel
- 8.2.3. Other
- 8.1. Market Analysis, Insights and Forecast - by Application
- 9. Middle East & Africa EEG Brain Imaging Analysis, Insights and Forecast, 2020-2032
- 9.1. Market Analysis, Insights and Forecast - by Application
- 9.1.1. Hospital
- 9.1.2. University
- 9.1.3. Research Institute
- 9.1.4. Other
- 9.2. Market Analysis, Insights and Forecast - by Types
- 9.2.1. 16-Channel
- 9.2.2. 32-Channel
- 9.2.3. Other
- 9.1. Market Analysis, Insights and Forecast - by Application
- 10. Asia Pacific EEG Brain Imaging Analysis, Insights and Forecast, 2020-2032
- 10.1. Market Analysis, Insights and Forecast - by Application
- 10.1.1. Hospital
- 10.1.2. University
- 10.1.3. Research Institute
- 10.1.4. Other
- 10.2. Market Analysis, Insights and Forecast - by Types
- 10.2.1. 16-Channel
- 10.2.2. 32-Channel
- 10.2.3. Other
- 10.1. Market Analysis, Insights and Forecast - by Application
- 11. Competitive Analysis
- 11.1. Global Market Share Analysis 2025
- 11.2. Company Profiles
- 11.2.1 Nihon Kohden
- 11.2.1.1. Overview
- 11.2.1.2. Products
- 11.2.1.3. SWOT Analysis
- 11.2.1.4. Recent Developments
- 11.2.1.5. Financials (Based on Availability)
- 11.2.2 Natus Medical
- 11.2.2.1. Overview
- 11.2.2.2. Products
- 11.2.2.3. SWOT Analysis
- 11.2.2.4. Recent Developments
- 11.2.2.5. Financials (Based on Availability)
- 11.2.3 Medtronic
- 11.2.3.1. Overview
- 11.2.3.2. Products
- 11.2.3.3. SWOT Analysis
- 11.2.3.4. Recent Developments
- 11.2.3.5. Financials (Based on Availability)
- 11.2.4 Compumedics
- 11.2.4.1. Overview
- 11.2.4.2. Products
- 11.2.4.3. SWOT Analysis
- 11.2.4.4. Recent Developments
- 11.2.4.5. Financials (Based on Availability)
- 11.2.5 Micromed
- 11.2.5.1. Overview
- 11.2.5.2. Products
- 11.2.5.3. SWOT Analysis
- 11.2.5.4. Recent Developments
- 11.2.5.5. Financials (Based on Availability)
- 11.2.6 EGI
- 11.2.6.1. Overview
- 11.2.6.2. Products
- 11.2.6.3. SWOT Analysis
- 11.2.6.4. Recent Developments
- 11.2.6.5. Financials (Based on Availability)
- 11.2.7 Cadwell
- 11.2.7.1. Overview
- 11.2.7.2. Products
- 11.2.7.3. SWOT Analysis
- 11.2.7.4. Recent Developments
- 11.2.7.5. Financials (Based on Availability)
- 11.2.8 NCC Medical
- 11.2.8.1. Overview
- 11.2.8.2. Products
- 11.2.8.3. SWOT Analysis
- 11.2.8.4. Recent Developments
- 11.2.8.5. Financials (Based on Availability)
- 11.2.9 SYMTOP
- 11.2.9.1. Overview
- 11.2.9.2. Products
- 11.2.9.3. SWOT Analysis
- 11.2.9.4. Recent Developments
- 11.2.9.5. Financials (Based on Availability)
- 11.2.10 NEUROWERK
- 11.2.10.1. Overview
- 11.2.10.2. Products
- 11.2.10.3. SWOT Analysis
- 11.2.10.4. Recent Developments
- 11.2.10.5. Financials (Based on Availability)
- 11.2.1 Nihon Kohden
List of Figures
- Figure 1: Global EEG Brain Imaging Revenue Breakdown (million, %) by Region 2025 & 2033
- Figure 2: Global EEG Brain Imaging Volume Breakdown (K, %) by Region 2025 & 2033
- Figure 3: North America EEG Brain Imaging Revenue (million), by Application 2025 & 2033
- Figure 4: North America EEG Brain Imaging Volume (K), by Application 2025 & 2033
- Figure 5: North America EEG Brain Imaging Revenue Share (%), by Application 2025 & 2033
- Figure 6: North America EEG Brain Imaging Volume Share (%), by Application 2025 & 2033
- Figure 7: North America EEG Brain Imaging Revenue (million), by Types 2025 & 2033
- Figure 8: North America EEG Brain Imaging Volume (K), by Types 2025 & 2033
- Figure 9: North America EEG Brain Imaging Revenue Share (%), by Types 2025 & 2033
- Figure 10: North America EEG Brain Imaging Volume Share (%), by Types 2025 & 2033
- Figure 11: North America EEG Brain Imaging Revenue (million), by Country 2025 & 2033
- Figure 12: North America EEG Brain Imaging Volume (K), by Country 2025 & 2033
- Figure 13: North America EEG Brain Imaging Revenue Share (%), by Country 2025 & 2033
- Figure 14: North America EEG Brain Imaging Volume Share (%), by Country 2025 & 2033
- Figure 15: South America EEG Brain Imaging Revenue (million), by Application 2025 & 2033
- Figure 16: South America EEG Brain Imaging Volume (K), by Application 2025 & 2033
- Figure 17: South America EEG Brain Imaging Revenue Share (%), by Application 2025 & 2033
- Figure 18: South America EEG Brain Imaging Volume Share (%), by Application 2025 & 2033
- Figure 19: South America EEG Brain Imaging Revenue (million), by Types 2025 & 2033
- Figure 20: South America EEG Brain Imaging Volume (K), by Types 2025 & 2033
- Figure 21: South America EEG Brain Imaging Revenue Share (%), by Types 2025 & 2033
- Figure 22: South America EEG Brain Imaging Volume Share (%), by Types 2025 & 2033
- Figure 23: South America EEG Brain Imaging Revenue (million), by Country 2025 & 2033
- Figure 24: South America EEG Brain Imaging Volume (K), by Country 2025 & 2033
- Figure 25: South America EEG Brain Imaging Revenue Share (%), by Country 2025 & 2033
- Figure 26: South America EEG Brain Imaging Volume Share (%), by Country 2025 & 2033
- Figure 27: Europe EEG Brain Imaging Revenue (million), by Application 2025 & 2033
- Figure 28: Europe EEG Brain Imaging Volume (K), by Application 2025 & 2033
- Figure 29: Europe EEG Brain Imaging Revenue Share (%), by Application 2025 & 2033
- Figure 30: Europe EEG Brain Imaging Volume Share (%), by Application 2025 & 2033
- Figure 31: Europe EEG Brain Imaging Revenue (million), by Types 2025 & 2033
- Figure 32: Europe EEG Brain Imaging Volume (K), by Types 2025 & 2033
- Figure 33: Europe EEG Brain Imaging Revenue Share (%), by Types 2025 & 2033
- Figure 34: Europe EEG Brain Imaging Volume Share (%), by Types 2025 & 2033
- Figure 35: Europe EEG Brain Imaging Revenue (million), by Country 2025 & 2033
- Figure 36: Europe EEG Brain Imaging Volume (K), by Country 2025 & 2033
- Figure 37: Europe EEG Brain Imaging Revenue Share (%), by Country 2025 & 2033
- Figure 38: Europe EEG Brain Imaging Volume Share (%), by Country 2025 & 2033
- Figure 39: Middle East & Africa EEG Brain Imaging Revenue (million), by Application 2025 & 2033
- Figure 40: Middle East & Africa EEG Brain Imaging Volume (K), by Application 2025 & 2033
- Figure 41: Middle East & Africa EEG Brain Imaging Revenue Share (%), by Application 2025 & 2033
- Figure 42: Middle East & Africa EEG Brain Imaging Volume Share (%), by Application 2025 & 2033
- Figure 43: Middle East & Africa EEG Brain Imaging Revenue (million), by Types 2025 & 2033
- Figure 44: Middle East & Africa EEG Brain Imaging Volume (K), by Types 2025 & 2033
- Figure 45: Middle East & Africa EEG Brain Imaging Revenue Share (%), by Types 2025 & 2033
- Figure 46: Middle East & Africa EEG Brain Imaging Volume Share (%), by Types 2025 & 2033
- Figure 47: Middle East & Africa EEG Brain Imaging Revenue (million), by Country 2025 & 2033
- Figure 48: Middle East & Africa EEG Brain Imaging Volume (K), by Country 2025 & 2033
- Figure 49: Middle East & Africa EEG Brain Imaging Revenue Share (%), by Country 2025 & 2033
- Figure 50: Middle East & Africa EEG Brain Imaging Volume Share (%), by Country 2025 & 2033
- Figure 51: Asia Pacific EEG Brain Imaging Revenue (million), by Application 2025 & 2033
- Figure 52: Asia Pacific EEG Brain Imaging Volume (K), by Application 2025 & 2033
- Figure 53: Asia Pacific EEG Brain Imaging Revenue Share (%), by Application 2025 & 2033
- Figure 54: Asia Pacific EEG Brain Imaging Volume Share (%), by Application 2025 & 2033
- Figure 55: Asia Pacific EEG Brain Imaging Revenue (million), by Types 2025 & 2033
- Figure 56: Asia Pacific EEG Brain Imaging Volume (K), by Types 2025 & 2033
- Figure 57: Asia Pacific EEG Brain Imaging Revenue Share (%), by Types 2025 & 2033
- Figure 58: Asia Pacific EEG Brain Imaging Volume Share (%), by Types 2025 & 2033
- Figure 59: Asia Pacific EEG Brain Imaging Revenue (million), by Country 2025 & 2033
- Figure 60: Asia Pacific EEG Brain Imaging Volume (K), by Country 2025 & 2033
- Figure 61: Asia Pacific EEG Brain Imaging Revenue Share (%), by Country 2025 & 2033
- Figure 62: Asia Pacific EEG Brain Imaging Volume Share (%), by Country 2025 & 2033
List of Tables
- Table 1: Global EEG Brain Imaging Revenue million Forecast, by Application 2020 & 2033
- Table 2: Global EEG Brain Imaging Volume K Forecast, by Application 2020 & 2033
- Table 3: Global EEG Brain Imaging Revenue million Forecast, by Types 2020 & 2033
- Table 4: Global EEG Brain Imaging Volume K Forecast, by Types 2020 & 2033
- Table 5: Global EEG Brain Imaging Revenue million Forecast, by Region 2020 & 2033
- Table 6: Global EEG Brain Imaging Volume K Forecast, by Region 2020 & 2033
- Table 7: Global EEG Brain Imaging Revenue million Forecast, by Application 2020 & 2033
- Table 8: Global EEG Brain Imaging Volume K Forecast, by Application 2020 & 2033
- Table 9: Global EEG Brain Imaging Revenue million Forecast, by Types 2020 & 2033
- Table 10: Global EEG Brain Imaging Volume K Forecast, by Types 2020 & 2033
- Table 11: Global EEG Brain Imaging Revenue million Forecast, by Country 2020 & 2033
- Table 12: Global EEG Brain Imaging Volume K Forecast, by Country 2020 & 2033
- Table 13: United States EEG Brain Imaging Revenue (million) Forecast, by Application 2020 & 2033
- Table 14: United States EEG Brain Imaging Volume (K) Forecast, by Application 2020 & 2033
- Table 15: Canada EEG Brain Imaging Revenue (million) Forecast, by Application 2020 & 2033
- Table 16: Canada EEG Brain Imaging Volume (K) Forecast, by Application 2020 & 2033
- Table 17: Mexico EEG Brain Imaging Revenue (million) Forecast, by Application 2020 & 2033
- Table 18: Mexico EEG Brain Imaging Volume (K) Forecast, by Application 2020 & 2033
- Table 19: Global EEG Brain Imaging Revenue million Forecast, by Application 2020 & 2033
- Table 20: Global EEG Brain Imaging Volume K Forecast, by Application 2020 & 2033
- Table 21: Global EEG Brain Imaging Revenue million Forecast, by Types 2020 & 2033
- Table 22: Global EEG Brain Imaging Volume K Forecast, by Types 2020 & 2033
- Table 23: Global EEG Brain Imaging Revenue million Forecast, by Country 2020 & 2033
- Table 24: Global EEG Brain Imaging Volume K Forecast, by Country 2020 & 2033
- Table 25: Brazil EEG Brain Imaging Revenue (million) Forecast, by Application 2020 & 2033
- Table 26: Brazil EEG Brain Imaging Volume (K) Forecast, by Application 2020 & 2033
- Table 27: Argentina EEG Brain Imaging Revenue (million) Forecast, by Application 2020 & 2033
- Table 28: Argentina EEG Brain Imaging Volume (K) Forecast, by Application 2020 & 2033
- Table 29: Rest of South America EEG Brain Imaging Revenue (million) Forecast, by Application 2020 & 2033
- Table 30: Rest of South America EEG Brain Imaging Volume (K) Forecast, by Application 2020 & 2033
- Table 31: Global EEG Brain Imaging Revenue million Forecast, by Application 2020 & 2033
- Table 32: Global EEG Brain Imaging Volume K Forecast, by Application 2020 & 2033
- Table 33: Global EEG Brain Imaging Revenue million Forecast, by Types 2020 & 2033
- Table 34: Global EEG Brain Imaging Volume K Forecast, by Types 2020 & 2033
- Table 35: Global EEG Brain Imaging Revenue million Forecast, by Country 2020 & 2033
- Table 36: Global EEG Brain Imaging Volume K Forecast, by Country 2020 & 2033
- Table 37: United Kingdom EEG Brain Imaging Revenue (million) Forecast, by Application 2020 & 2033
- Table 38: United Kingdom EEG Brain Imaging Volume (K) Forecast, by Application 2020 & 2033
- Table 39: Germany EEG Brain Imaging Revenue (million) Forecast, by Application 2020 & 2033
- Table 40: Germany EEG Brain Imaging Volume (K) Forecast, by Application 2020 & 2033
- Table 41: France EEG Brain Imaging Revenue (million) Forecast, by Application 2020 & 2033
- Table 42: France EEG Brain Imaging Volume (K) Forecast, by Application 2020 & 2033
- Table 43: Italy EEG Brain Imaging Revenue (million) Forecast, by Application 2020 & 2033
- Table 44: Italy EEG Brain Imaging Volume (K) Forecast, by Application 2020 & 2033
- Table 45: Spain EEG Brain Imaging Revenue (million) Forecast, by Application 2020 & 2033
- Table 46: Spain EEG Brain Imaging Volume (K) Forecast, by Application 2020 & 2033
- Table 47: Russia EEG Brain Imaging Revenue (million) Forecast, by Application 2020 & 2033
- Table 48: Russia EEG Brain Imaging Volume (K) Forecast, by Application 2020 & 2033
- Table 49: Benelux EEG Brain Imaging Revenue (million) Forecast, by Application 2020 & 2033
- Table 50: Benelux EEG Brain Imaging Volume (K) Forecast, by Application 2020 & 2033
- Table 51: Nordics EEG Brain Imaging Revenue (million) Forecast, by Application 2020 & 2033
- Table 52: Nordics EEG Brain Imaging Volume (K) Forecast, by Application 2020 & 2033
- Table 53: Rest of Europe EEG Brain Imaging Revenue (million) Forecast, by Application 2020 & 2033
- Table 54: Rest of Europe EEG Brain Imaging Volume (K) Forecast, by Application 2020 & 2033
- Table 55: Global EEG Brain Imaging Revenue million Forecast, by Application 2020 & 2033
- Table 56: Global EEG Brain Imaging Volume K Forecast, by Application 2020 & 2033
- Table 57: Global EEG Brain Imaging Revenue million Forecast, by Types 2020 & 2033
- Table 58: Global EEG Brain Imaging Volume K Forecast, by Types 2020 & 2033
- Table 59: Global EEG Brain Imaging Revenue million Forecast, by Country 2020 & 2033
- Table 60: Global EEG Brain Imaging Volume K Forecast, by Country 2020 & 2033
- Table 61: Turkey EEG Brain Imaging Revenue (million) Forecast, by Application 2020 & 2033
- Table 62: Turkey EEG Brain Imaging Volume (K) Forecast, by Application 2020 & 2033
- Table 63: Israel EEG Brain Imaging Revenue (million) Forecast, by Application 2020 & 2033
- Table 64: Israel EEG Brain Imaging Volume (K) Forecast, by Application 2020 & 2033
- Table 65: GCC EEG Brain Imaging Revenue (million) Forecast, by Application 2020 & 2033
- Table 66: GCC EEG Brain Imaging Volume (K) Forecast, by Application 2020 & 2033
- Table 67: North Africa EEG Brain Imaging Revenue (million) Forecast, by Application 2020 & 2033
- Table 68: North Africa EEG Brain Imaging Volume (K) Forecast, by Application 2020 & 2033
- Table 69: South Africa EEG Brain Imaging Revenue (million) Forecast, by Application 2020 & 2033
- Table 70: South Africa EEG Brain Imaging Volume (K) Forecast, by Application 2020 & 2033
- Table 71: Rest of Middle East & Africa EEG Brain Imaging Revenue (million) Forecast, by Application 2020 & 2033
- Table 72: Rest of Middle East & Africa EEG Brain Imaging Volume (K) Forecast, by Application 2020 & 2033
- Table 73: Global EEG Brain Imaging Revenue million Forecast, by Application 2020 & 2033
- Table 74: Global EEG Brain Imaging Volume K Forecast, by Application 2020 & 2033
- Table 75: Global EEG Brain Imaging Revenue million Forecast, by Types 2020 & 2033
- Table 76: Global EEG Brain Imaging Volume K Forecast, by Types 2020 & 2033
- Table 77: Global EEG Brain Imaging Revenue million Forecast, by Country 2020 & 2033
- Table 78: Global EEG Brain Imaging Volume K Forecast, by Country 2020 & 2033
- Table 79: China EEG Brain Imaging Revenue (million) Forecast, by Application 2020 & 2033
- Table 80: China EEG Brain Imaging Volume (K) Forecast, by Application 2020 & 2033
- Table 81: India EEG Brain Imaging Revenue (million) Forecast, by Application 2020 & 2033
- Table 82: India EEG Brain Imaging Volume (K) Forecast, by Application 2020 & 2033
- Table 83: Japan EEG Brain Imaging Revenue (million) Forecast, by Application 2020 & 2033
- Table 84: Japan EEG Brain Imaging Volume (K) Forecast, by Application 2020 & 2033
- Table 85: South Korea EEG Brain Imaging Revenue (million) Forecast, by Application 2020 & 2033
- Table 86: South Korea EEG Brain Imaging Volume (K) Forecast, by Application 2020 & 2033
- Table 87: ASEAN EEG Brain Imaging Revenue (million) Forecast, by Application 2020 & 2033
- Table 88: ASEAN EEG Brain Imaging Volume (K) Forecast, by Application 2020 & 2033
- Table 89: Oceania EEG Brain Imaging Revenue (million) Forecast, by Application 2020 & 2033
- Table 90: Oceania EEG Brain Imaging Volume (K) Forecast, by Application 2020 & 2033
- Table 91: Rest of Asia Pacific EEG Brain Imaging Revenue (million) Forecast, by Application 2020 & 2033
- Table 92: Rest of Asia Pacific EEG Brain Imaging Volume (K) Forecast, by Application 2020 & 2033
Frequently Asked Questions
1. What is the projected Compound Annual Growth Rate (CAGR) of the EEG Brain Imaging?
The projected CAGR is approximately 5.8%.
2. Which companies are prominent players in the EEG Brain Imaging?
Key companies in the market include Nihon Kohden, Natus Medical, Medtronic, Compumedics, Micromed, EGI, Cadwell, NCC Medical, SYMTOP, NEUROWERK.
3. What are the main segments of the EEG Brain Imaging?
The market segments include Application, Types.
4. Can you provide details about the market size?
The market size is estimated to be USD 429 million as of 2022.
5. What are some drivers contributing to market growth?
N/A
6. What are the notable trends driving market growth?
N/A
7. Are there any restraints impacting market growth?
N/A
8. Can you provide examples of recent developments in the market?
N/A
9. What pricing options are available for accessing the report?
Pricing options include single-user, multi-user, and enterprise licenses priced at USD 3950.00, USD 5925.00, and USD 7900.00 respectively.
10. Is the market size provided in terms of value or volume?
The market size is provided in terms of value, measured in million and volume, measured in K.
11. Are there any specific market keywords associated with the report?
Yes, the market keyword associated with the report is "EEG Brain Imaging," which aids in identifying and referencing the specific market segment covered.
12. How do I determine which pricing option suits my needs best?
The pricing options vary based on user requirements and access needs. Individual users may opt for single-user licenses, while businesses requiring broader access may choose multi-user or enterprise licenses for cost-effective access to the report.
13. Are there any additional resources or data provided in the EEG Brain Imaging report?
While the report offers comprehensive insights, it's advisable to review the specific contents or supplementary materials provided to ascertain if additional resources or data are available.
14. How can I stay updated on further developments or reports in the EEG Brain Imaging?
To stay informed about further developments, trends, and reports in the EEG Brain Imaging, consider subscribing to industry newsletters, following relevant companies and organizations, or regularly checking reputable industry news sources and publications.
Methodology
Step 1 - Identification of Relevant Samples Size from Population Database


Step 2 - Approaches for Defining Global Market Size (Value, Volume* & Price*)

Note*: In applicable scenarios
Step 3 - Data Sources
Primary Research
- Web Analytics
- Survey Reports
- Research Institute
- Latest Research Reports
- Opinion Leaders
Secondary Research
- Annual Reports
- White Paper
- Latest Press Release
- Industry Association
- Paid Database
- Investor Presentations

Step 4 - Data Triangulation
Involves using different sources of information in order to increase the validity of a study
These sources are likely to be stakeholders in a program - participants, other researchers, program staff, other community members, and so on.
Then we put all data in single framework & apply various statistical tools to find out the dynamic on the market.
During the analysis stage, feedback from the stakeholder groups would be compared to determine areas of agreement as well as areas of divergence