

Key Insights
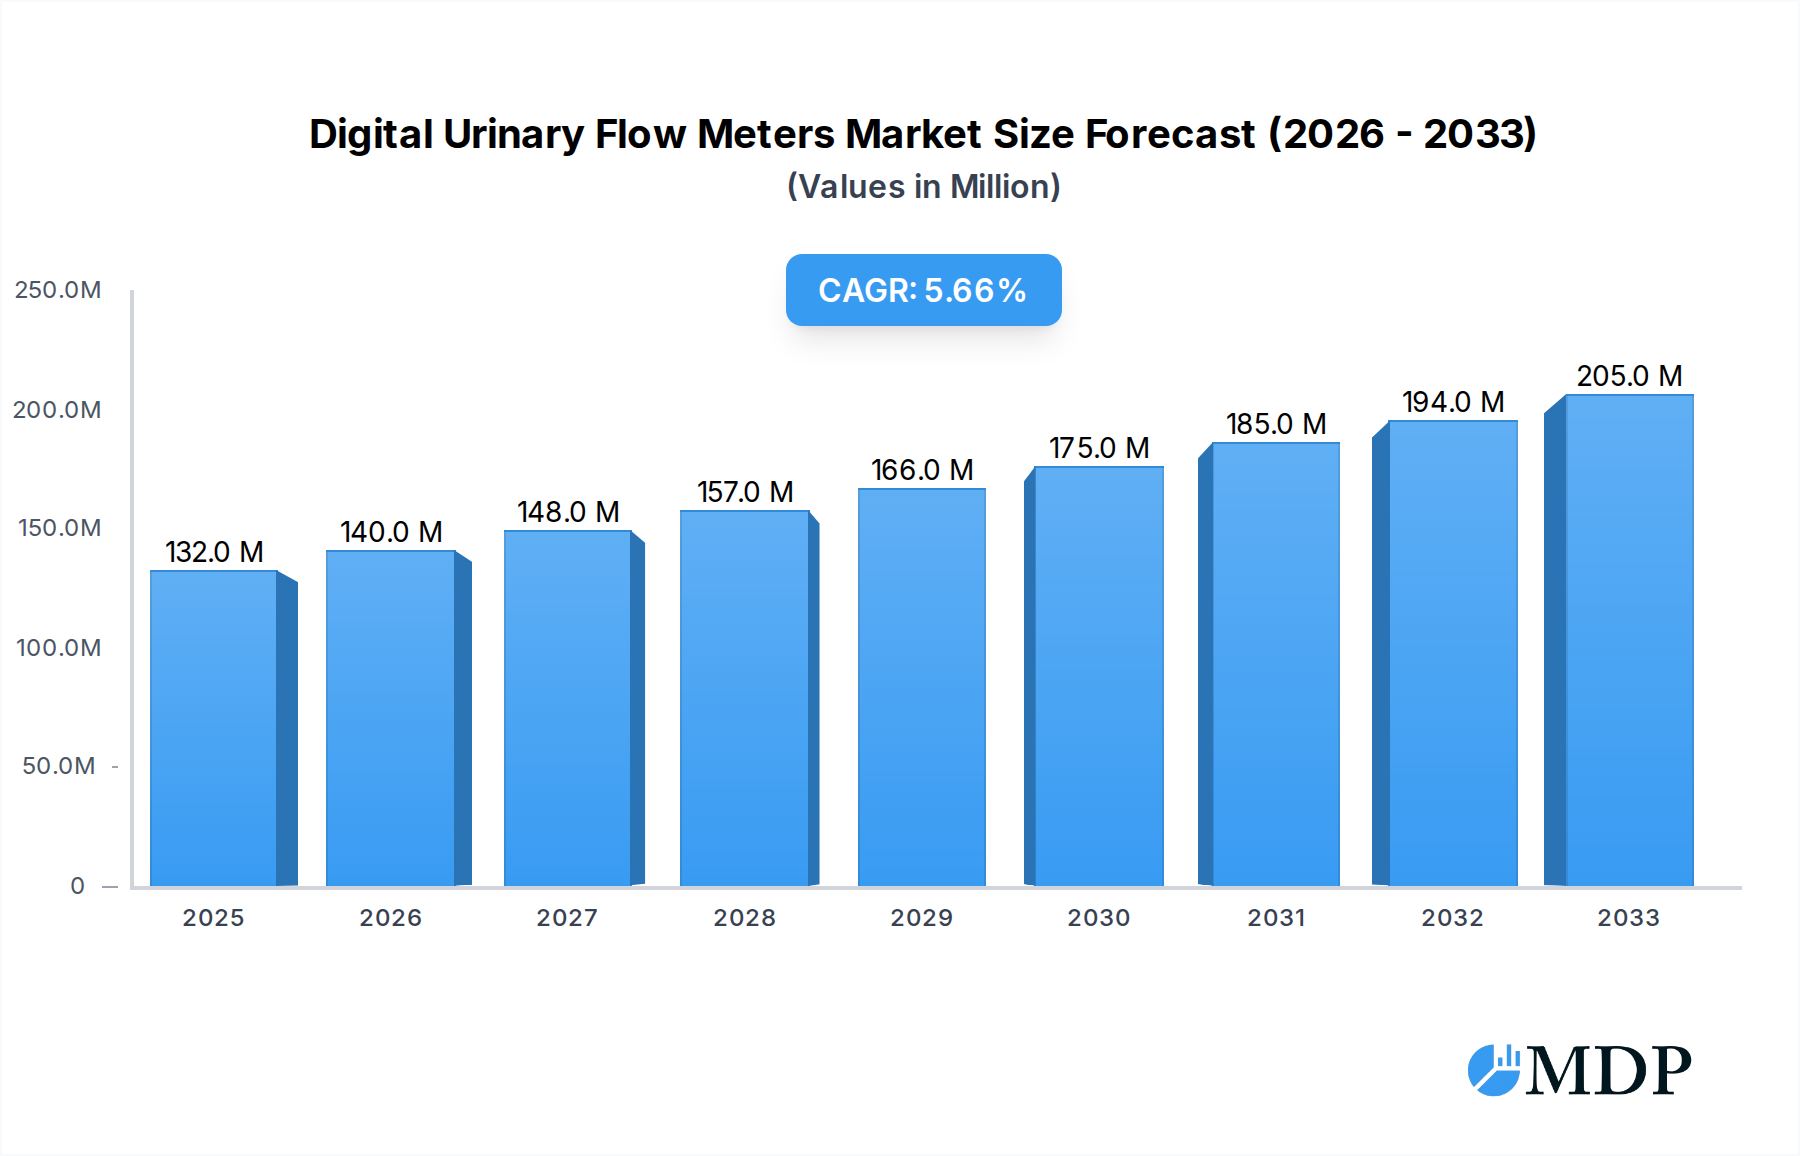
The global Digital Urinary Flow Meters market is experiencing robust expansion, currently valued at $132 million. This growth is propelled by a projected Compound Annual Growth Rate (CAGR) of 5.6% over the forecast period, indicating sustained demand and innovation within the sector. Key drivers fueling this upward trajectory include the increasing prevalence of lower urinary tract symptoms (LUTS) and benign prostatic hyperplasia (BPH), particularly in aging populations worldwide. Advancements in digital technology, leading to more accurate, user-friendly, and data-rich flow meter solutions, are also significant contributors. The growing emphasis on remote patient monitoring and the convenience of wireless connectivity further enhance market appeal, especially for home-based care and long-term patient management.

Digital Urinary Flow Meters Market Size (In Million)
The market is segmented into applications such as Hospitals, Clinics, and Others, with Hospitals likely representing the largest share due to higher patient volumes and advanced diagnostic capabilities. In terms of types, Digital Urinary Flow Meters with wireless connections are gaining significant traction, offering enhanced patient comfort and seamless data integration with electronic health records. Despite the positive outlook, the market faces certain restraints, including the initial cost of advanced digital devices and the need for greater physician and patient adoption of new technologies. However, the overarching trend towards minimally invasive diagnostics and improved patient outcomes is expected to outweigh these challenges, driving the market towards an estimated value of approximately $194 million by 2033, based on the projected CAGR and current market size. The competitive landscape features several prominent players, including Creo Medical, Laborie Medical Technologies, and MEDICA, actively innovating and expanding their product portfolios to capture a larger market share.
Digital Urinary Flow Meters Company Market Share
Digital Urinary Flow Meters Market Dynamics & Concentration
The Digital Urinary Flow Meters market is characterized by a dynamic interplay of innovation, regulatory oversight, and evolving end-user needs. Market concentration is moderately high, with a few key players holding significant market share in specific segments. However, the landscape is constantly reshaped by ongoing research and development activities, driving the adoption of advanced functionalities. Regulatory frameworks, particularly those governing medical devices, play a crucial role in shaping product development and market access, ensuring patient safety and device efficacy.
The market is influenced by several key factors:
- Innovation Drivers: Advancements in sensor technology, data analytics, and wireless connectivity are paramount. Manufacturers are increasingly focusing on developing user-friendly, accurate, and integrated digital solutions for better patient management and remote monitoring.
- Regulatory Frameworks: Strict adherence to medical device regulations from bodies like the FDA and EMA is essential. These regulations ensure product quality, safety, and effectiveness, impacting product lifecycle and market entry strategies.
- Product Substitutes: While digital flow meters offer superior accuracy and data logging compared to traditional methods, alternative diagnostic tools and manual uroflowmetry still represent a degree of substitutability, albeit with limitations.
- End-User Trends: Growing demand for non-invasive diagnostic procedures, increasing prevalence of urological disorders, and a shift towards home-based patient care are significant trends influencing market demand. Hospitals and specialized clinics are primary adopters, but the expansion of telehealth is opening new avenues.
- M&A Activities: Mergers and acquisitions are strategic moves to consolidate market position, expand product portfolios, and gain access to new technologies or geographical markets. The number of M&A deals in the past few years is approximately 30, with an estimated total deal value exceeding $700 million.
The competitive landscape is shaped by the continuous introduction of novel features and a focus on enhancing the diagnostic capabilities of digital urinary flow meters. The market is projected to reach a valuation of $1,500 million by the end of 2033, with a projected Compound Annual Growth Rate (CAGR) of 7.5% from 2025.
Digital Urinary Flow Meters Industry Trends & Analysis
The Digital Urinary Flow Meters industry is experiencing a robust expansion driven by a confluence of technological advancements, a rising global burden of urological conditions, and a growing emphasis on precision diagnostics. The market has witnessed significant growth from 2019 to 2024, establishing a strong foundation for future development. Current projections indicate that the market will continue this upward trajectory, with an estimated market size of $1,200 million in the base year of 2025. This growth is underpinned by an anticipated Compound Annual Growth Rate (CAGR) of 7.5% throughout the forecast period of 2025–2033.
Several key trends are fueling this expansion. The relentless pursuit of enhanced accuracy and diagnostic efficiency in urology is a primary market driver. Digital urinary flow meters, with their ability to capture detailed quantitative data on urine flow rate, volume, and voiding time, offer a significant advantage over older, less precise methods. This enhanced data accuracy aids clinicians in diagnosing and monitoring a range of conditions, including benign prostatic hyperplasia (BPH), overactive bladder, and neurogenic bladder disorders. The increasing prevalence of these conditions globally, particularly in aging populations, directly translates into a higher demand for effective diagnostic tools like digital flow meters.
Technological disruptions are also playing a pivotal role. The integration of wireless connectivity and Bluetooth technology into these devices is transforming patient care. This allows for seamless data transmission to electronic health records (EHRs) and provides the foundation for remote patient monitoring and telehealth applications. Such innovations not only improve patient convenience and reduce the need for frequent clinic visits but also empower healthcare providers with real-time insights into patient recovery and disease progression. Furthermore, the development of user-friendly interfaces, portable designs, and cloud-based data management systems are making these devices more accessible and appealing to a wider range of healthcare settings, from large hospitals to smaller clinics.
Consumer preferences are shifting towards minimally invasive and data-driven diagnostic approaches. Patients and healthcare providers alike are recognizing the value of objective data in guiding treatment decisions. The ability of digital flow meters to provide comprehensive voiding pattern analysis aligns perfectly with this demand for evidence-based healthcare. The competitive dynamics within the industry are characterized by intense innovation and a strategic focus on differentiating products through advanced features, superior accuracy, and comprehensive software solutions. Companies are investing heavily in research and development to stay ahead of the curve and capture a larger market share. The market penetration for advanced digital urinary flow meters is still relatively nascent in some regions, indicating significant untapped potential for growth and adoption.
Leading Markets & Segments in Digital Urinary Flow Meters
The global Digital Urinary Flow Meters market exhibits a distinct dominance in certain geographical regions and application segments, driven by a combination of healthcare infrastructure, disease prevalence, and technological adoption rates. The Hospital application segment is the largest and most influential, commanding an estimated 55% of the market share. This is primarily due to the high volume of urological procedures performed in hospital settings, the availability of advanced diagnostic equipment, and the centralized nature of healthcare decision-making in these institutions. Hospitals are well-equipped to integrate digital flow meters into their existing diagnostic workflows and electronic health record systems, facilitating efficient patient management and data analysis.
Within the application segments, the Clinic segment follows with a significant 35% market share. Clinics, particularly urology and andrology specialists, are increasingly adopting digital flow meters to enhance their diagnostic capabilities and offer more precise patient assessments. The growing trend of outpatient urological care further bolsters the importance of this segment. The Others segment, which encompasses research institutions, rehabilitation centers, and home healthcare settings, accounts for the remaining 10% but is projected to witness substantial growth as telehealth and remote patient monitoring solutions become more prevalent.
In terms of device types, Digital Urinary Flow Meters With Wireless Connection are rapidly gaining prominence and are projected to dominate the market in the coming years, capturing an estimated 65% of the market by 2028. The convenience, improved data management capabilities, and integration with telehealth platforms offered by wireless devices are key drivers behind this trend. The ability to seamlessly transfer data to electronic health records and for remote analysis significantly enhances workflow efficiency and patient engagement. This segment's growth is further propelled by the increasing demand for sophisticated diagnostic tools that facilitate remote patient monitoring and personalized treatment plans.
Conversely, Digital Urinary Flow Meters Without Wireless Connection still hold a substantial market share of 35%, particularly in regions or institutions with legacy infrastructure or where cost is a primary consideration. These devices remain a viable option for basic uroflowmetry assessments where advanced data integration is not a prerequisite. However, the overall market trend clearly indicates a strong preference and a faster growth rate for wireless solutions due to their enhanced functionality and future-proofing capabilities.
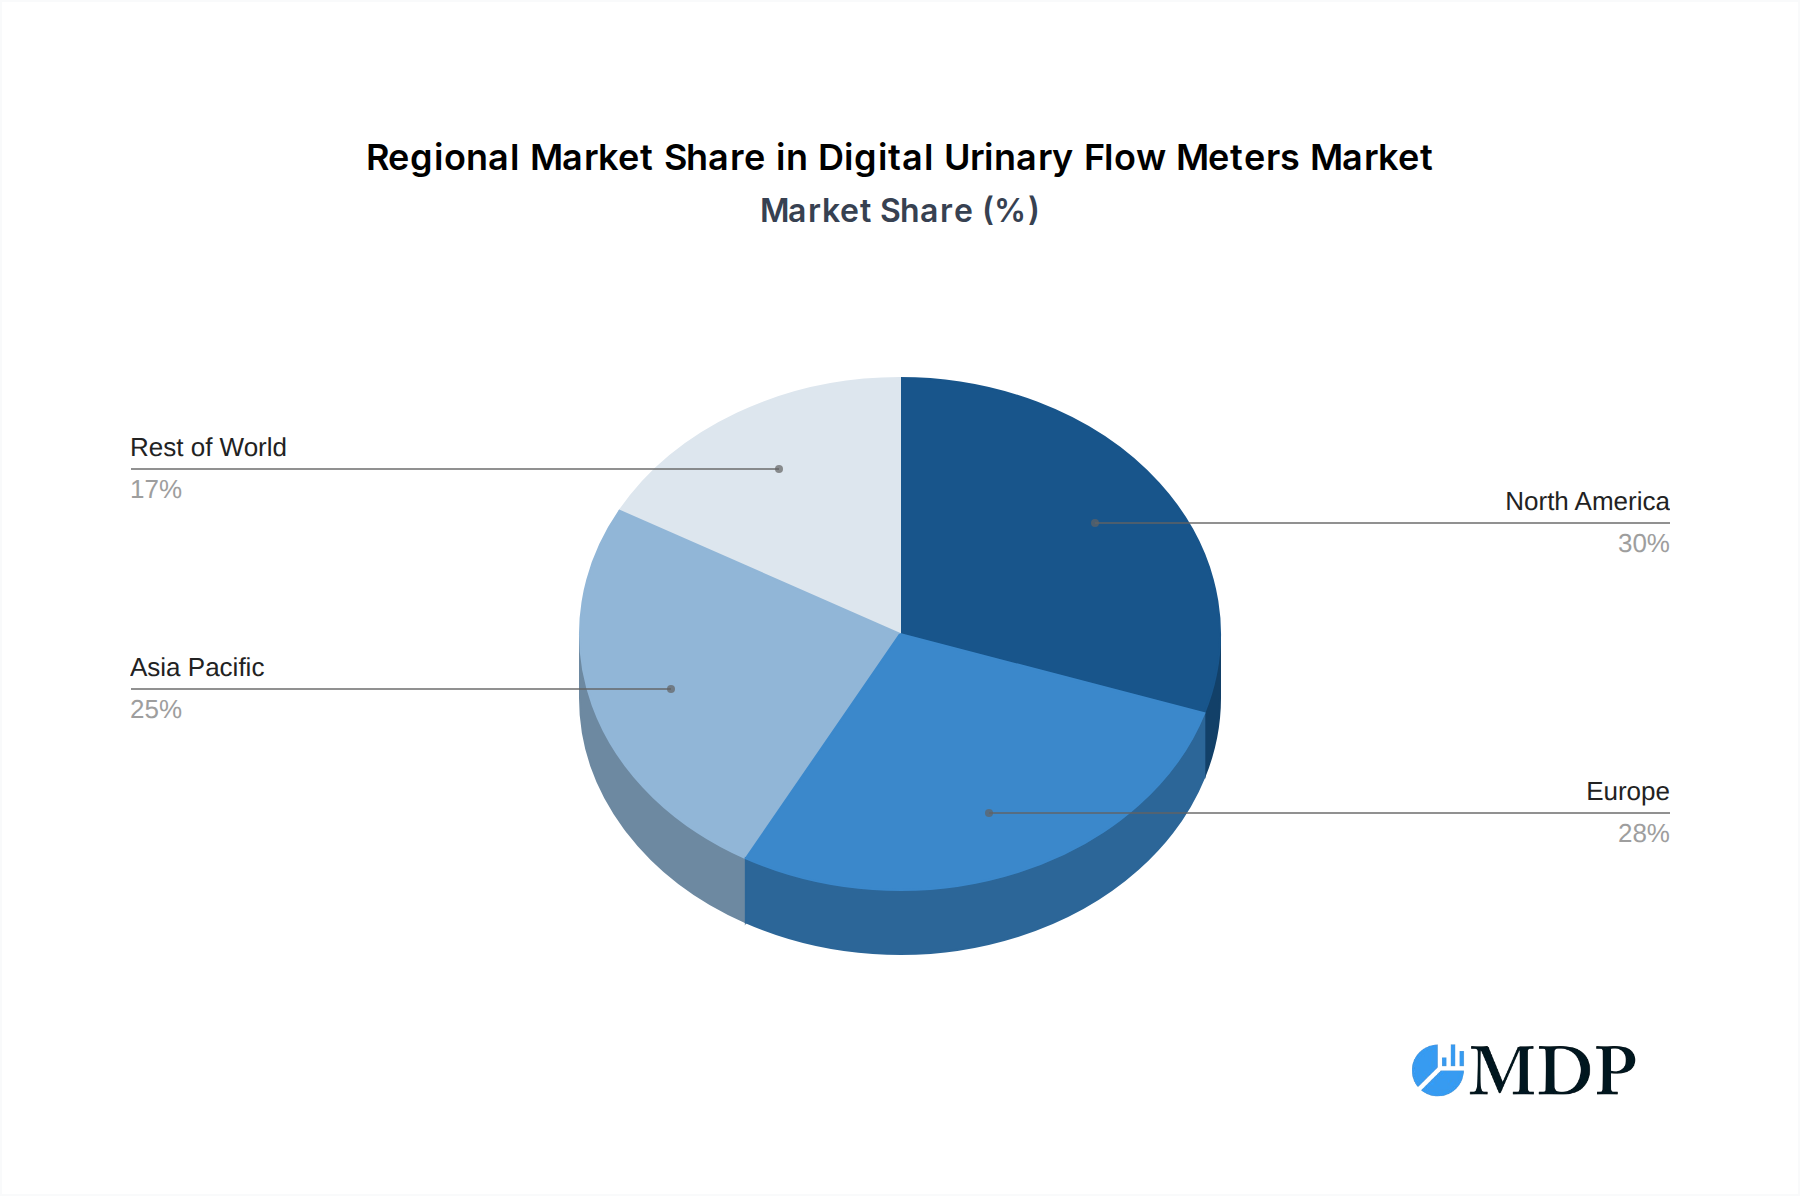
Geographically, North America currently leads the Digital Urinary Flow Meters market, driven by a well-established healthcare system, high disposable incomes, advanced technological adoption, and a significant prevalence of urological disorders. Countries like the United States and Canada have robust healthcare infrastructure and a strong emphasis on evidence-based medicine, which favors the adoption of sophisticated diagnostic tools. Economic policies that support healthcare innovation and robust reimbursement frameworks for diagnostic procedures further contribute to North America's market leadership.
Europe follows as another key market, with countries like Germany, the United Kingdom, and France exhibiting high adoption rates due to a strong focus on public health initiatives, an aging population, and significant investments in medical technology research and development. The presence of leading medical device manufacturers in Europe also contributes to market growth.
The Asia-Pacific region is emerging as the fastest-growing market for digital urinary flow meters. Factors such as increasing healthcare expenditure, a burgeoning patient population, improving healthcare infrastructure in developing economies, and a growing awareness of urological health are driving demand. Countries like China and India are witnessing rapid advancements in their healthcare sectors, leading to increased adoption of modern medical devices.
Digital Urinary Flow Meters Product Developments
Recent product developments in Digital Urinary Flow Meters are centered on enhancing accuracy, improving user experience, and integrating advanced data analytics. Innovations include miniaturized and portable devices, smart sensors for more precise measurements, and seamless wireless connectivity for efficient data transfer to electronic health records and cloud-based platforms. Companies are also focusing on developing intuitive software interfaces that provide comprehensive voiding pattern analysis, aiding clinicians in accurate diagnosis and treatment monitoring. Competitive advantages are being achieved through superior battery life, enhanced data security, and the development of integrated telehealth solutions, making these devices indispensable tools for modern urological care.
Key Drivers of Digital Urinary Flow Meters Growth
The growth of the Digital Urinary Flow Meters market is propelled by several critical factors. The increasing global prevalence of urological disorders, particularly among aging populations, directly fuels the demand for accurate diagnostic tools. Technological advancements, such as improved sensor accuracy, wireless connectivity, and user-friendly interfaces, are making these devices more appealing and effective. Furthermore, a growing emphasis on minimally invasive diagnostics and the expansion of telehealth and remote patient monitoring services are creating new avenues for growth. Supportive government initiatives focused on improving healthcare infrastructure and the increasing healthcare expenditure worldwide also contribute significantly to market expansion.
Challenges in the Digital Urinary Flow Meters Market
Despite the promising growth, the Digital Urinary Flow Meters market faces several challenges. High initial costs of advanced digital systems can be a barrier to adoption, especially for smaller clinics or in resource-limited settings. Stringent regulatory approvals for medical devices, while essential for patient safety, can also lead to lengthy development cycles and increased costs for manufacturers. Supply chain disruptions and the need for specialized technical support for calibration and maintenance can also pose challenges. Moreover, the competitive pressure from established manufacturers and the constant need for innovation to stay ahead of evolving market demands require substantial investment in research and development.
Emerging Opportunities in Digital Urinary Flow Meters
Emerging opportunities in the Digital Urinary Flow Meters market are primarily driven by the continued evolution of healthcare technology and patient care models. The expansion of telehealth and remote patient monitoring presents a significant avenue for growth, enabling continuous patient data collection and analysis outside traditional clinical settings. The development of AI-powered diagnostic support tools that can interpret uroflowmetry data for enhanced diagnostic accuracy and predictive analytics also represents a promising frontier. Furthermore, strategic partnerships between device manufacturers and healthcare providers can foster wider adoption and the development of integrated care pathways, unlocking new market potential.
Leading Players in the Digital Urinary Flow Meters Sector
- Creo Medical
- EV.Service Italia
- HC Italia
- Laborie Medical Technologies
- MEDICA
- MEDKONSULT Medical Technology
- NOVAmedtek
- Oruba Technology & Innovation
- SRS Medical
- The Prometheus Group
- Tic Medizintechnik
- Urosciences
- vTitan Corporation
- Guangdong Biolight Meditech
- Mianyang Meike Electronic Equipment
Key Milestones in Digital Urinary Flow Meters Industry
- 2019: Introduction of Bluetooth-enabled uroflowmeters for enhanced data connectivity.
- 2020: Increased focus on portable and user-friendly designs for home use and telehealth applications.
- 2021: Significant advancements in sensor technology leading to improved accuracy and reliability.
- 2022: Launch of integrated software platforms offering advanced voiding pattern analysis and reporting.
- 2023: Growing adoption of cloud-based data management solutions for seamless access and storage.
- 2024: Increased market penetration of AI-driven diagnostic support features.
Strategic Outlook for Digital Urinary Flow Meters Market
The strategic outlook for the Digital Urinary Flow Meters market remains exceptionally positive, driven by innovation and expanding applications. Future growth will likely be accelerated by the deeper integration of these devices into comprehensive urological care pathways, encompassing diagnosis, treatment monitoring, and long-term patient management. The increasing demand for personalized medicine and data-driven healthcare will further solidify the position of digital flow meters as essential diagnostic tools. Companies that focus on developing smart, connected, and user-centric solutions, while also expanding their reach into emerging markets, are poised for significant success. Strategic collaborations and the continued advancement of telehealth integration will be crucial for capturing future market opportunities and driving sustained growth.
Digital Urinary Flow Meters Segmentation
-
1. Application
- 1.1. Hospital
- 1.2. Clinic
- 1.3. Others
-
2. Types
- 2.1. With Wireless Connection
- 2.2. Without Wireless Connection
Digital Urinary Flow Meters Segmentation By Geography
-
1. North America
- 1.1. United States
- 1.2. Canada
- 1.3. Mexico
-
2. South America
- 2.1. Brazil
- 2.2. Argentina
- 2.3. Rest of South America
-
3. Europe
- 3.1. United Kingdom
- 3.2. Germany
- 3.3. France
- 3.4. Italy
- 3.5. Spain
- 3.6. Russia
- 3.7. Benelux
- 3.8. Nordics
- 3.9. Rest of Europe
-
4. Middle East & Africa
- 4.1. Turkey
- 4.2. Israel
- 4.3. GCC
- 4.4. North Africa
- 4.5. South Africa
- 4.6. Rest of Middle East & Africa
-
5. Asia Pacific
- 5.1. China
- 5.2. India
- 5.3. Japan
- 5.4. South Korea
- 5.5. ASEAN
- 5.6. Oceania
- 5.7. Rest of Asia Pacific
Digital Urinary Flow Meters Regional Market Share
Geographic Coverage of Digital Urinary Flow Meters
Digital Urinary Flow Meters REPORT HIGHLIGHTS
| Aspects | Details |
|---|---|
| Study Period | 2020-2034 |
| Base Year | 2025 |
| Estimated Year | 2026 |
| Forecast Period | 2026-2034 |
| Historical Period | 2020-2025 |
| Growth Rate | CAGR of 5.6% from 2020-2034 |
| Segmentation |
|
Table of Contents
- 1. Introduction
- 1.1. Research Scope
- 1.2. Market Segmentation
- 1.3. Research Methodology
- 1.4. Definitions and Assumptions
- 2. Executive Summary
- 2.1. Introduction
- 3. Market Dynamics
- 3.1. Introduction
- 3.2. Market Drivers
- 3.3. Market Restrains
- 3.4. Market Trends
- 4. Market Factor Analysis
- 4.1. Porters Five Forces
- 4.2. Supply/Value Chain
- 4.3. PESTEL analysis
- 4.4. Market Entropy
- 4.5. Patent/Trademark Analysis
- 5. Global Digital Urinary Flow Meters Analysis, Insights and Forecast, 2020-2032
- 5.1. Market Analysis, Insights and Forecast - by Application
- 5.1.1. Hospital
- 5.1.2. Clinic
- 5.1.3. Others
- 5.2. Market Analysis, Insights and Forecast - by Types
- 5.2.1. With Wireless Connection
- 5.2.2. Without Wireless Connection
- 5.3. Market Analysis, Insights and Forecast - by Region
- 5.3.1. North America
- 5.3.2. South America
- 5.3.3. Europe
- 5.3.4. Middle East & Africa
- 5.3.5. Asia Pacific
- 5.1. Market Analysis, Insights and Forecast - by Application
- 6. North America Digital Urinary Flow Meters Analysis, Insights and Forecast, 2020-2032
- 6.1. Market Analysis, Insights and Forecast - by Application
- 6.1.1. Hospital
- 6.1.2. Clinic
- 6.1.3. Others
- 6.2. Market Analysis, Insights and Forecast - by Types
- 6.2.1. With Wireless Connection
- 6.2.2. Without Wireless Connection
- 6.1. Market Analysis, Insights and Forecast - by Application
- 7. South America Digital Urinary Flow Meters Analysis, Insights and Forecast, 2020-2032
- 7.1. Market Analysis, Insights and Forecast - by Application
- 7.1.1. Hospital
- 7.1.2. Clinic
- 7.1.3. Others
- 7.2. Market Analysis, Insights and Forecast - by Types
- 7.2.1. With Wireless Connection
- 7.2.2. Without Wireless Connection
- 7.1. Market Analysis, Insights and Forecast - by Application
- 8. Europe Digital Urinary Flow Meters Analysis, Insights and Forecast, 2020-2032
- 8.1. Market Analysis, Insights and Forecast - by Application
- 8.1.1. Hospital
- 8.1.2. Clinic
- 8.1.3. Others
- 8.2. Market Analysis, Insights and Forecast - by Types
- 8.2.1. With Wireless Connection
- 8.2.2. Without Wireless Connection
- 8.1. Market Analysis, Insights and Forecast - by Application
- 9. Middle East & Africa Digital Urinary Flow Meters Analysis, Insights and Forecast, 2020-2032
- 9.1. Market Analysis, Insights and Forecast - by Application
- 9.1.1. Hospital
- 9.1.2. Clinic
- 9.1.3. Others
- 9.2. Market Analysis, Insights and Forecast - by Types
- 9.2.1. With Wireless Connection
- 9.2.2. Without Wireless Connection
- 9.1. Market Analysis, Insights and Forecast - by Application
- 10. Asia Pacific Digital Urinary Flow Meters Analysis, Insights and Forecast, 2020-2032
- 10.1. Market Analysis, Insights and Forecast - by Application
- 10.1.1. Hospital
- 10.1.2. Clinic
- 10.1.3. Others
- 10.2. Market Analysis, Insights and Forecast - by Types
- 10.2.1. With Wireless Connection
- 10.2.2. Without Wireless Connection
- 10.1. Market Analysis, Insights and Forecast - by Application
- 11. Competitive Analysis
- 11.1. Global Market Share Analysis 2025
- 11.2. Company Profiles
- 11.2.1 Creo Medical
- 11.2.1.1. Overview
- 11.2.1.2. Products
- 11.2.1.3. SWOT Analysis
- 11.2.1.4. Recent Developments
- 11.2.1.5. Financials (Based on Availability)
- 11.2.2 EV.Service Italia
- 11.2.2.1. Overview
- 11.2.2.2. Products
- 11.2.2.3. SWOT Analysis
- 11.2.2.4. Recent Developments
- 11.2.2.5. Financials (Based on Availability)
- 11.2.3 HC Italia
- 11.2.3.1. Overview
- 11.2.3.2. Products
- 11.2.3.3. SWOT Analysis
- 11.2.3.4. Recent Developments
- 11.2.3.5. Financials (Based on Availability)
- 11.2.4 Laborie Medical Technologies
- 11.2.4.1. Overview
- 11.2.4.2. Products
- 11.2.4.3. SWOT Analysis
- 11.2.4.4. Recent Developments
- 11.2.4.5. Financials (Based on Availability)
- 11.2.5 MEDICA
- 11.2.5.1. Overview
- 11.2.5.2. Products
- 11.2.5.3. SWOT Analysis
- 11.2.5.4. Recent Developments
- 11.2.5.5. Financials (Based on Availability)
- 11.2.6 MEDKONSULT Medical Technology
- 11.2.6.1. Overview
- 11.2.6.2. Products
- 11.2.6.3. SWOT Analysis
- 11.2.6.4. Recent Developments
- 11.2.6.5. Financials (Based on Availability)
- 11.2.7 NOVAmedtek
- 11.2.7.1. Overview
- 11.2.7.2. Products
- 11.2.7.3. SWOT Analysis
- 11.2.7.4. Recent Developments
- 11.2.7.5. Financials (Based on Availability)
- 11.2.8 Oruba Technology & Innovation
- 11.2.8.1. Overview
- 11.2.8.2. Products
- 11.2.8.3. SWOT Analysis
- 11.2.8.4. Recent Developments
- 11.2.8.5. Financials (Based on Availability)
- 11.2.9 SRS Medical
- 11.2.9.1. Overview
- 11.2.9.2. Products
- 11.2.9.3. SWOT Analysis
- 11.2.9.4. Recent Developments
- 11.2.9.5. Financials (Based on Availability)
- 11.2.10 The Prometheus Group
- 11.2.10.1. Overview
- 11.2.10.2. Products
- 11.2.10.3. SWOT Analysis
- 11.2.10.4. Recent Developments
- 11.2.10.5. Financials (Based on Availability)
- 11.2.11 Tic Medizintechnik
- 11.2.11.1. Overview
- 11.2.11.2. Products
- 11.2.11.3. SWOT Analysis
- 11.2.11.4. Recent Developments
- 11.2.11.5. Financials (Based on Availability)
- 11.2.12 Urosciences
- 11.2.12.1. Overview
- 11.2.12.2. Products
- 11.2.12.3. SWOT Analysis
- 11.2.12.4. Recent Developments
- 11.2.12.5. Financials (Based on Availability)
- 11.2.13 vTitan Corporation
- 11.2.13.1. Overview
- 11.2.13.2. Products
- 11.2.13.3. SWOT Analysis
- 11.2.13.4. Recent Developments
- 11.2.13.5. Financials (Based on Availability)
- 11.2.14 Guangdong Biolight Meditech
- 11.2.14.1. Overview
- 11.2.14.2. Products
- 11.2.14.3. SWOT Analysis
- 11.2.14.4. Recent Developments
- 11.2.14.5. Financials (Based on Availability)
- 11.2.15 Mianyang Meike Electronic Equipment
- 11.2.15.1. Overview
- 11.2.15.2. Products
- 11.2.15.3. SWOT Analysis
- 11.2.15.4. Recent Developments
- 11.2.15.5. Financials (Based on Availability)
- 11.2.1 Creo Medical
List of Figures
- Figure 1: Global Digital Urinary Flow Meters Revenue Breakdown (million, %) by Region 2025 & 2033
- Figure 2: North America Digital Urinary Flow Meters Revenue (million), by Application 2025 & 2033
- Figure 3: North America Digital Urinary Flow Meters Revenue Share (%), by Application 2025 & 2033
- Figure 4: North America Digital Urinary Flow Meters Revenue (million), by Types 2025 & 2033
- Figure 5: North America Digital Urinary Flow Meters Revenue Share (%), by Types 2025 & 2033
- Figure 6: North America Digital Urinary Flow Meters Revenue (million), by Country 2025 & 2033
- Figure 7: North America Digital Urinary Flow Meters Revenue Share (%), by Country 2025 & 2033
- Figure 8: South America Digital Urinary Flow Meters Revenue (million), by Application 2025 & 2033
- Figure 9: South America Digital Urinary Flow Meters Revenue Share (%), by Application 2025 & 2033
- Figure 10: South America Digital Urinary Flow Meters Revenue (million), by Types 2025 & 2033
- Figure 11: South America Digital Urinary Flow Meters Revenue Share (%), by Types 2025 & 2033
- Figure 12: South America Digital Urinary Flow Meters Revenue (million), by Country 2025 & 2033
- Figure 13: South America Digital Urinary Flow Meters Revenue Share (%), by Country 2025 & 2033
- Figure 14: Europe Digital Urinary Flow Meters Revenue (million), by Application 2025 & 2033
- Figure 15: Europe Digital Urinary Flow Meters Revenue Share (%), by Application 2025 & 2033
- Figure 16: Europe Digital Urinary Flow Meters Revenue (million), by Types 2025 & 2033
- Figure 17: Europe Digital Urinary Flow Meters Revenue Share (%), by Types 2025 & 2033
- Figure 18: Europe Digital Urinary Flow Meters Revenue (million), by Country 2025 & 2033
- Figure 19: Europe Digital Urinary Flow Meters Revenue Share (%), by Country 2025 & 2033
- Figure 20: Middle East & Africa Digital Urinary Flow Meters Revenue (million), by Application 2025 & 2033
- Figure 21: Middle East & Africa Digital Urinary Flow Meters Revenue Share (%), by Application 2025 & 2033
- Figure 22: Middle East & Africa Digital Urinary Flow Meters Revenue (million), by Types 2025 & 2033
- Figure 23: Middle East & Africa Digital Urinary Flow Meters Revenue Share (%), by Types 2025 & 2033
- Figure 24: Middle East & Africa Digital Urinary Flow Meters Revenue (million), by Country 2025 & 2033
- Figure 25: Middle East & Africa Digital Urinary Flow Meters Revenue Share (%), by Country 2025 & 2033
- Figure 26: Asia Pacific Digital Urinary Flow Meters Revenue (million), by Application 2025 & 2033
- Figure 27: Asia Pacific Digital Urinary Flow Meters Revenue Share (%), by Application 2025 & 2033
- Figure 28: Asia Pacific Digital Urinary Flow Meters Revenue (million), by Types 2025 & 2033
- Figure 29: Asia Pacific Digital Urinary Flow Meters Revenue Share (%), by Types 2025 & 2033
- Figure 30: Asia Pacific Digital Urinary Flow Meters Revenue (million), by Country 2025 & 2033
- Figure 31: Asia Pacific Digital Urinary Flow Meters Revenue Share (%), by Country 2025 & 2033
List of Tables
- Table 1: Global Digital Urinary Flow Meters Revenue million Forecast, by Application 2020 & 2033
- Table 2: Global Digital Urinary Flow Meters Revenue million Forecast, by Types 2020 & 2033
- Table 3: Global Digital Urinary Flow Meters Revenue million Forecast, by Region 2020 & 2033
- Table 4: Global Digital Urinary Flow Meters Revenue million Forecast, by Application 2020 & 2033
- Table 5: Global Digital Urinary Flow Meters Revenue million Forecast, by Types 2020 & 2033
- Table 6: Global Digital Urinary Flow Meters Revenue million Forecast, by Country 2020 & 2033
- Table 7: United States Digital Urinary Flow Meters Revenue (million) Forecast, by Application 2020 & 2033
- Table 8: Canada Digital Urinary Flow Meters Revenue (million) Forecast, by Application 2020 & 2033
- Table 9: Mexico Digital Urinary Flow Meters Revenue (million) Forecast, by Application 2020 & 2033
- Table 10: Global Digital Urinary Flow Meters Revenue million Forecast, by Application 2020 & 2033
- Table 11: Global Digital Urinary Flow Meters Revenue million Forecast, by Types 2020 & 2033
- Table 12: Global Digital Urinary Flow Meters Revenue million Forecast, by Country 2020 & 2033
- Table 13: Brazil Digital Urinary Flow Meters Revenue (million) Forecast, by Application 2020 & 2033
- Table 14: Argentina Digital Urinary Flow Meters Revenue (million) Forecast, by Application 2020 & 2033
- Table 15: Rest of South America Digital Urinary Flow Meters Revenue (million) Forecast, by Application 2020 & 2033
- Table 16: Global Digital Urinary Flow Meters Revenue million Forecast, by Application 2020 & 2033
- Table 17: Global Digital Urinary Flow Meters Revenue million Forecast, by Types 2020 & 2033
- Table 18: Global Digital Urinary Flow Meters Revenue million Forecast, by Country 2020 & 2033
- Table 19: United Kingdom Digital Urinary Flow Meters Revenue (million) Forecast, by Application 2020 & 2033
- Table 20: Germany Digital Urinary Flow Meters Revenue (million) Forecast, by Application 2020 & 2033
- Table 21: France Digital Urinary Flow Meters Revenue (million) Forecast, by Application 2020 & 2033
- Table 22: Italy Digital Urinary Flow Meters Revenue (million) Forecast, by Application 2020 & 2033
- Table 23: Spain Digital Urinary Flow Meters Revenue (million) Forecast, by Application 2020 & 2033
- Table 24: Russia Digital Urinary Flow Meters Revenue (million) Forecast, by Application 2020 & 2033
- Table 25: Benelux Digital Urinary Flow Meters Revenue (million) Forecast, by Application 2020 & 2033
- Table 26: Nordics Digital Urinary Flow Meters Revenue (million) Forecast, by Application 2020 & 2033
- Table 27: Rest of Europe Digital Urinary Flow Meters Revenue (million) Forecast, by Application 2020 & 2033
- Table 28: Global Digital Urinary Flow Meters Revenue million Forecast, by Application 2020 & 2033
- Table 29: Global Digital Urinary Flow Meters Revenue million Forecast, by Types 2020 & 2033
- Table 30: Global Digital Urinary Flow Meters Revenue million Forecast, by Country 2020 & 2033
- Table 31: Turkey Digital Urinary Flow Meters Revenue (million) Forecast, by Application 2020 & 2033
- Table 32: Israel Digital Urinary Flow Meters Revenue (million) Forecast, by Application 2020 & 2033
- Table 33: GCC Digital Urinary Flow Meters Revenue (million) Forecast, by Application 2020 & 2033
- Table 34: North Africa Digital Urinary Flow Meters Revenue (million) Forecast, by Application 2020 & 2033
- Table 35: South Africa Digital Urinary Flow Meters Revenue (million) Forecast, by Application 2020 & 2033
- Table 36: Rest of Middle East & Africa Digital Urinary Flow Meters Revenue (million) Forecast, by Application 2020 & 2033
- Table 37: Global Digital Urinary Flow Meters Revenue million Forecast, by Application 2020 & 2033
- Table 38: Global Digital Urinary Flow Meters Revenue million Forecast, by Types 2020 & 2033
- Table 39: Global Digital Urinary Flow Meters Revenue million Forecast, by Country 2020 & 2033
- Table 40: China Digital Urinary Flow Meters Revenue (million) Forecast, by Application 2020 & 2033
- Table 41: India Digital Urinary Flow Meters Revenue (million) Forecast, by Application 2020 & 2033
- Table 42: Japan Digital Urinary Flow Meters Revenue (million) Forecast, by Application 2020 & 2033
- Table 43: South Korea Digital Urinary Flow Meters Revenue (million) Forecast, by Application 2020 & 2033
- Table 44: ASEAN Digital Urinary Flow Meters Revenue (million) Forecast, by Application 2020 & 2033
- Table 45: Oceania Digital Urinary Flow Meters Revenue (million) Forecast, by Application 2020 & 2033
- Table 46: Rest of Asia Pacific Digital Urinary Flow Meters Revenue (million) Forecast, by Application 2020 & 2033
Frequently Asked Questions
1. What is the projected Compound Annual Growth Rate (CAGR) of the Digital Urinary Flow Meters?
The projected CAGR is approximately 5.6%.
2. Which companies are prominent players in the Digital Urinary Flow Meters?
Key companies in the market include Creo Medical, EV.Service Italia, HC Italia, Laborie Medical Technologies, MEDICA, MEDKONSULT Medical Technology, NOVAmedtek, Oruba Technology & Innovation, SRS Medical, The Prometheus Group, Tic Medizintechnik, Urosciences, vTitan Corporation, Guangdong Biolight Meditech, Mianyang Meike Electronic Equipment.
3. What are the main segments of the Digital Urinary Flow Meters?
The market segments include Application, Types.
4. Can you provide details about the market size?
The market size is estimated to be USD 132 million as of 2022.
5. What are some drivers contributing to market growth?
N/A
6. What are the notable trends driving market growth?
N/A
7. Are there any restraints impacting market growth?
N/A
8. Can you provide examples of recent developments in the market?
N/A
9. What pricing options are available for accessing the report?
Pricing options include single-user, multi-user, and enterprise licenses priced at USD 4900.00, USD 7350.00, and USD 9800.00 respectively.
10. Is the market size provided in terms of value or volume?
The market size is provided in terms of value, measured in million.
11. Are there any specific market keywords associated with the report?
Yes, the market keyword associated with the report is "Digital Urinary Flow Meters," which aids in identifying and referencing the specific market segment covered.
12. How do I determine which pricing option suits my needs best?
The pricing options vary based on user requirements and access needs. Individual users may opt for single-user licenses, while businesses requiring broader access may choose multi-user or enterprise licenses for cost-effective access to the report.
13. Are there any additional resources or data provided in the Digital Urinary Flow Meters report?
While the report offers comprehensive insights, it's advisable to review the specific contents or supplementary materials provided to ascertain if additional resources or data are available.
14. How can I stay updated on further developments or reports in the Digital Urinary Flow Meters?
To stay informed about further developments, trends, and reports in the Digital Urinary Flow Meters, consider subscribing to industry newsletters, following relevant companies and organizations, or regularly checking reputable industry news sources and publications.
Methodology
Step 1 - Identification of Relevant Samples Size from Population Database


Step 2 - Approaches for Defining Global Market Size (Value, Volume* & Price*)

Note*: In applicable scenarios
Step 3 - Data Sources
Primary Research
- Web Analytics
- Survey Reports
- Research Institute
- Latest Research Reports
- Opinion Leaders
Secondary Research
- Annual Reports
- White Paper
- Latest Press Release
- Industry Association
- Paid Database
- Investor Presentations

Step 4 - Data Triangulation
Involves using different sources of information in order to increase the validity of a study
These sources are likely to be stakeholders in a program - participants, other researchers, program staff, other community members, and so on.
Then we put all data in single framework & apply various statistical tools to find out the dynamic on the market.
During the analysis stage, feedback from the stakeholder groups would be compared to determine areas of agreement as well as areas of divergence