

Key Insights
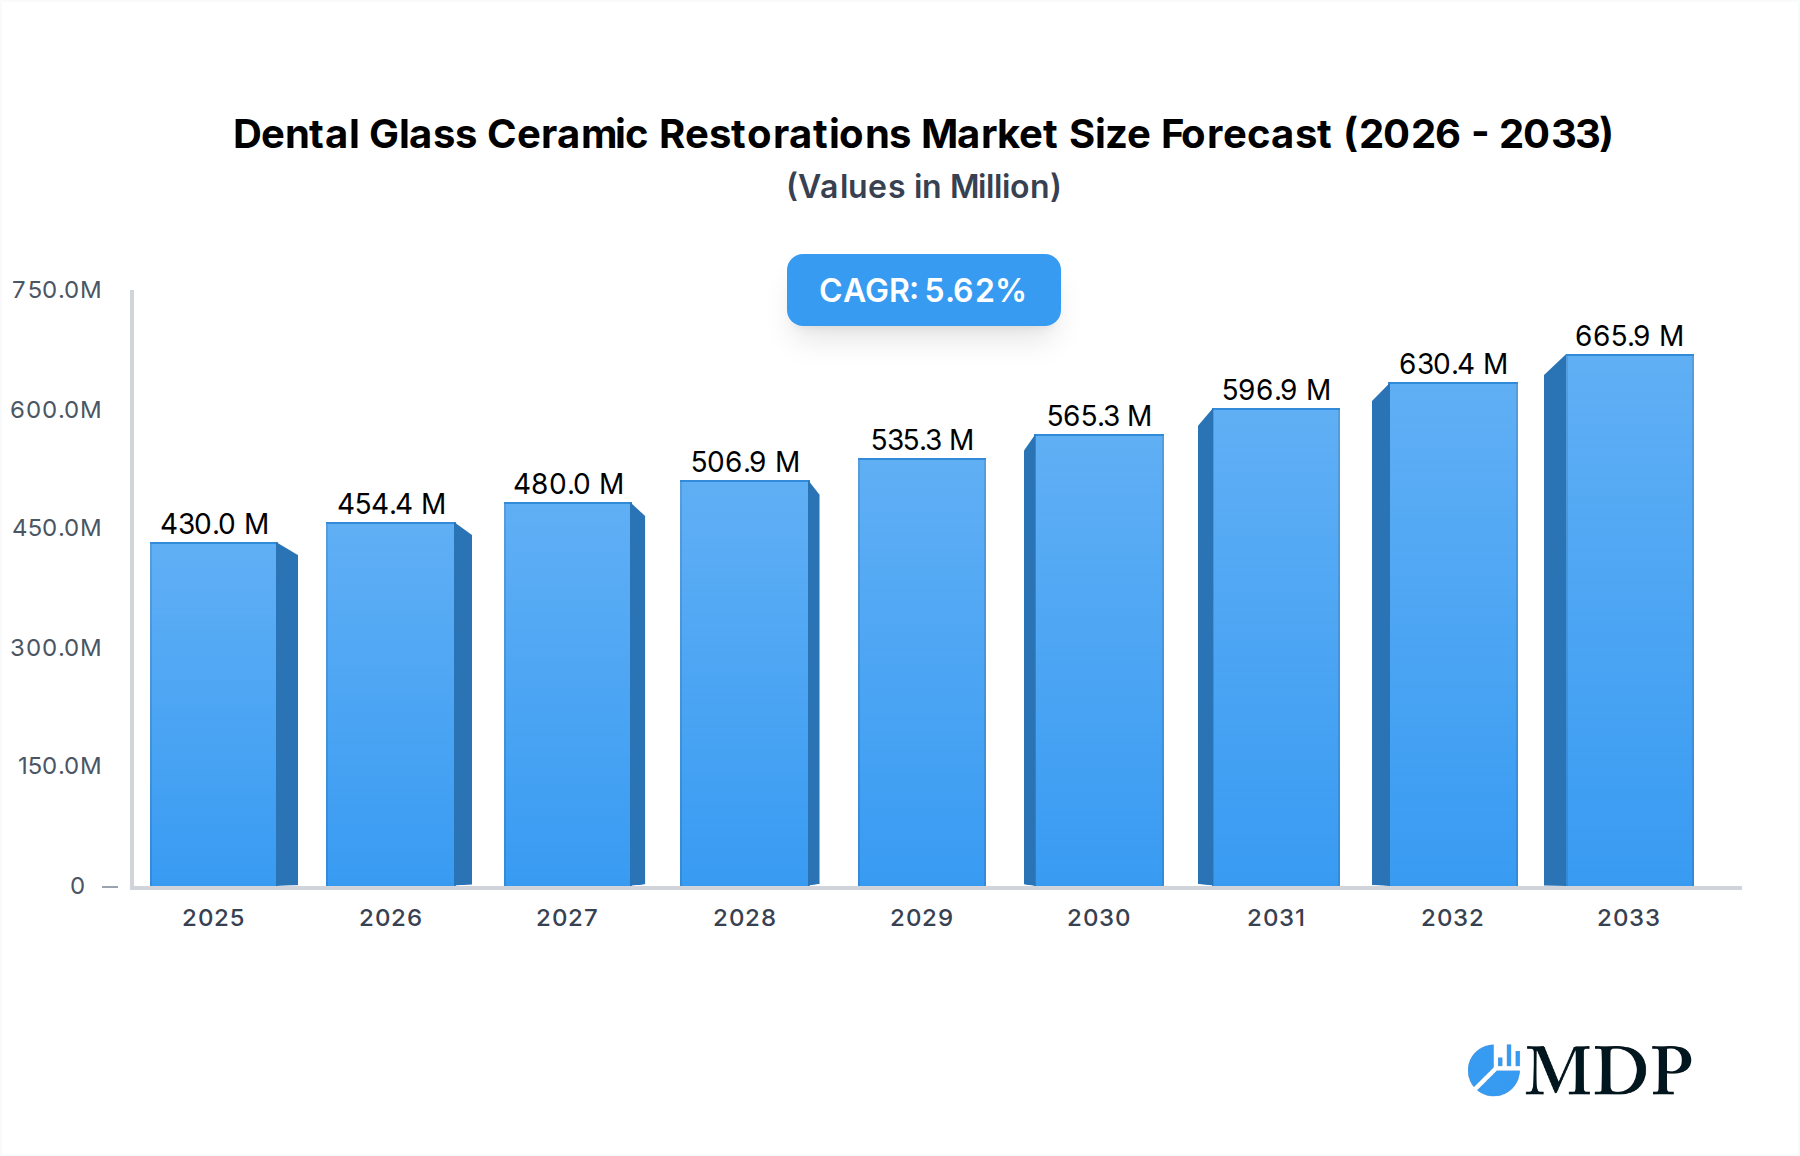
The global market for Dental Glass Ceramic Restorations is poised for significant expansion, driven by an increasing demand for aesthetically pleasing and biocompatible dental treatments. With a projected market size of $430 million in 2025, the sector is expected to witness robust growth at a Compound Annual Growth Rate (CAGR) of 5.6% through 2033. This upward trajectory is primarily fueled by advancements in material science leading to more durable and natural-looking ceramic options, coupled with a rising global awareness of oral hygiene and a growing preference for minimally invasive cosmetic dentistry procedures. The aging global population also contributes to market expansion, as the prevalence of dental issues increases with age, necessitating restorative treatments. Furthermore, technological innovations in digital dentistry, such as CAD/CAM systems, are streamlining the fabrication process, making these restorations more accessible and cost-effective for both dental professionals and patients.

Dental Glass Ceramic Restorations Market Size (In Million)
The market's growth is further propelled by a strong emphasis on patient satisfaction and the pursuit of long-term dental health solutions. Hospitals and specialized dental clinics represent the primary application segments, reflecting the sophisticated nature of these restorative procedures. The key types of glass ceramic powders – Inert and Reactive – cater to diverse clinical needs, offering versatility in bonding and aesthetic outcomes. While the market demonstrates a promising outlook, challenges such as the initial cost of advanced dental equipment and the need for specialized training for dental practitioners could present some restraints. However, the continuous innovation from leading companies like Schott, 3M, and Corning, alongside emerging players, is expected to mitigate these challenges, fostering a dynamic and competitive landscape. The Asia Pacific region, with its rapidly expanding healthcare infrastructure and increasing disposable incomes, is anticipated to emerge as a significant growth engine in the coming years.
Dental Glass Ceramic Restorations Company Market Share
Unlocking the Future of Dental Aesthetics: Comprehensive Report on Dental Glass Ceramic Restorations
This in-depth market research report offers a panoramic view of the global Dental Glass Ceramic Restorations market, spanning the historical period from 2019 to 2024, a base year of 2025, an estimated year of 2025, and a robust forecast period from 2025 to 2033. With an estimated market size projected to reach one million by 2025 and an anticipated Compound Annual Growth Rate (CAGR) of xx%, this report is an indispensable resource for manufacturers, suppliers, dental professionals, investors, and all stakeholders seeking to capitalize on the burgeoning demand for advanced dental restorative solutions. We delve into the intricate dynamics, evolving trends, leading markets, and pivotal players shaping this dynamic industry.
Dental Glass Ceramic Restorations Market Dynamics & Concentration
The global Dental Glass Ceramic Restorations market exhibits a moderate to high concentration, with key players like Schott, 3M, and Corning holding significant market shares. Innovation remains a primary driver, fueled by continuous advancements in material science, leading to enhanced biocompatibility, aesthetic appeal, and mechanical strength. Regulatory frameworks, particularly stringent approvals from bodies like the FDA and EMA, govern product development and market entry, ensuring patient safety and efficacy. Product substitutes, though present in traditional materials like metal-ceramics and composites, are increasingly being displaced by the superior properties of glass ceramics. End-user trends highlight a growing patient demand for minimally invasive procedures and highly aesthetic restorations, directly influencing the adoption of glass ceramic materials. Mergers and acquisitions (M&A) activity is moderate, with companies strategically acquiring smaller innovators or expanding their product portfolios to gain a competitive edge. M&A deal counts are projected to increase by xx% in the forecast period.
Dental Glass Ceramic Restorations Industry Trends & Analysis
The dental glass ceramic restorations industry is experiencing robust growth, propelled by several interconnected trends. The increasing global prevalence of dental caries, periodontal diseases, and tooth wear is a fundamental market driver, necessitating durable and aesthetically pleasing restorative solutions. Technological disruptions, particularly in the realm of CAD/CAM (Computer-Aided Design/Computer-Aided Manufacturing) technology, have revolutionized the fabrication of custom dental restorations, enabling greater precision, efficiency, and patient comfort. This shift towards digital dentistry directly benefits the adoption of glass ceramic materials, which are highly compatible with CAD/CAM workflows. Consumer preferences are increasingly leaning towards highly aesthetic and biocompatible dental treatments. Patients are more informed than ever and actively seek restorations that mimic natural tooth structure, offering translucency, color stability, and smooth surface textures. Glass ceramics excel in these aspects, providing lifelike results that are often indistinguishable from natural teeth. This aesthetic demand, coupled with a growing emphasis on preventive dentistry and patient education, is expanding the market penetration of glass ceramic restorations across all age demographics. Furthermore, the rising disposable incomes in emerging economies are making advanced dental treatments more accessible, contributing to a significant expansion of the global market. The competitive landscape is characterized by a blend of established multinational corporations and innovative niche players, all vying for market dominance through product differentiation, strategic partnerships, and geographical expansion. The estimated market penetration is expected to reach xx% by 2033.
Leading Markets & Segments in Dental Glass Ceramic Restorations
North America currently dominates the global Dental Glass Ceramic Restorations market, driven by a highly developed healthcare infrastructure, a strong emphasis on cosmetic dentistry, and a significant patient pool with high disposable incomes. Within North America, the United States leads, with robust demand from both established and emerging dental clinics. The Dental Clinics segment is the largest application, accounting for approximately xx% of the market share, owing to the widespread adoption of advanced restorative techniques and the preference for chairside fabrication of restorations.
Key drivers for this dominance include:
- Economic Policies: Favorable reimbursement policies for advanced dental procedures and significant private healthcare spending.
- Infrastructure: Advanced dental laboratory infrastructure and widespread availability of CAD/CAM technology, facilitating the production and fitting of glass ceramic restorations.
- Technological Adoption: High adoption rates of new dental technologies and materials among practitioners, eager to offer state-of-the-art treatments.
- Consumer Awareness: A well-informed patient population actively seeking high-quality, aesthetic, and durable dental solutions.
In terms of material types, Reactive Glass Powders are gaining significant traction and are projected to witness a higher CAGR of xx% compared to Inert Glass Powders. This is due to their superior bonding capabilities with dental substrates, leading to more durable and aesthetically integrated restorations. The application in Hospitals also shows steady growth, driven by complex restorative cases and the increasing use of glass ceramics in prosthodontics for implant-supported restorations. The "Others" segment, encompassing specialized dental laboratories and academic institutions, plays a crucial role in research and development, further driving innovation.
Dental Glass Ceramic Restorations Product Developments
Recent product developments in dental glass ceramic restorations are focused on enhancing material properties and streamlining clinical workflows. Innovations in lithium disilicate and zirconia-reinforced glass ceramics are leading to restorations with improved fracture toughness and a more natural translucency, mimicking enamel and dentin. Manufacturers like Schott and Corning are investing heavily in R&D to create biocompatible materials with exceptional wear resistance and color stability. These advancements allow for the creation of ultra-thin veneers, conservative inlays, onlays, and crowns, minimizing tooth preparation and maximizing patient comfort. The competitive advantage lies in the ability to achieve superior aesthetics with enhanced durability, making these materials the gold standard for a wide range of restorative applications.
Key Drivers of Dental Glass Ceramic Restorations Growth
The growth of the Dental Glass Ceramic Restorations market is significantly propelled by technological advancements, particularly the integration of CAD/CAM systems, which enhance precision and efficiency in fabrication. Growing patient demand for aesthetically pleasing and biocompatible dental solutions is a major catalyst, driven by increasing awareness of oral health and cosmetic dentistry. Furthermore, favorable economic factors, including rising disposable incomes and increased healthcare expenditure globally, are making advanced dental treatments more accessible. Regulatory support for innovative dental materials, coupled with the continuous development of superior glass ceramic formulations by companies like 3M and Specialty Glass, further fuels market expansion.
Challenges in the Dental Glass Ceramic Restorations Market
Despite the promising outlook, the Dental Glass Ceramic Restorations market faces several challenges. High material costs and the specialized equipment required for fabrication and application can be a barrier for smaller dental practices, impacting market penetration in price-sensitive regions. Stringent regulatory approvals for new materials, although essential for patient safety, can lead to extended product development timelines and increased research and development expenses for companies like LASCOD S.p.A. and Prevest DenPro Limited. Supply chain disruptions, particularly for specialized raw materials, can affect production and availability. Additionally, competition from alternative restorative materials, such as advanced composites and metal-ceramics, continues to exert pressure, requiring continuous innovation and demonstration of superior benefits.
Emerging Opportunities in Dental Glass Ceramic Restorations
Emerging opportunities in the Dental Glass Ceramic Restorations market are abundant, driven by ongoing technological breakthroughs and evolving patient needs. The increasing focus on minimally invasive dentistry presents a significant avenue for growth, as glass ceramics allow for the fabrication of thinner yet stronger restorations. Advancements in 3D printing technologies for dental applications are also opening new frontiers for custom glass ceramic restorations, promising increased efficiency and cost-effectiveness. Strategic partnerships between material manufacturers like Ferro and dental technology providers can accelerate innovation and market reach. Furthermore, the untapped potential in emerging economies, coupled with the growing demand for personalized dental care, offers substantial opportunities for market expansion and increased adoption of high-quality glass ceramic solutions.
Leading Players in the Dental Glass Ceramic Restorations Sector
- Schott
- Ferro
- James Kent Group
- 3M
- Corning
- Specialty Glass
- LASCOD S.p.A.
- Prevest DenPro Limited
Key Milestones in Dental Glass Ceramic Restorations Industry
- 2019: Introduction of advanced lithium disilicate materials with enhanced translucency and strength.
- 2020: Widespread adoption of AI-driven CAD software for restorative design, improving precision.
- 2021: Launch of new biocompatible glass ceramic formulations with improved wear resistance.
- 2022: Significant advancements in CAD/CAM milling technologies, enabling faster and more accurate fabrication.
- 2023: Increased research and development in multi-layer glass ceramics for superior aesthetics.
- 2024: Emergence of novel bonding agents specifically designed for enhanced adhesion with glass ceramic restorations.
Strategic Outlook for Dental Glass Ceramic Restorations Market
The strategic outlook for the Dental Glass Ceramic Restorations market is exceptionally positive, characterized by strong growth accelerators. Continued investment in research and development by leading players will drive the creation of even more durable, aesthetic, and bio-integrated materials. The expansion of digital dentistry workflows and the increasing integration of AI in dental practices will further streamline the restorative process, enhancing efficiency and patient satisfaction. Strategic collaborations and potential acquisitions will likely shape the competitive landscape, fostering innovation and market penetration. The growing global demand for aesthetically pleasing and high-quality dental care, coupled with rising healthcare expenditure, positions the dental glass ceramic restorations market for sustained and significant expansion in the coming years.
Dental Glass Ceramic Restorations Segmentation
-
1. Application
- 1.1. Hospitals
- 1.2. Dental Clinics
- 1.3. Others
-
2. Types
- 2.1. Inert Glass Powders
- 2.2. Reactive Glass Powders
Dental Glass Ceramic Restorations Segmentation By Geography
-
1. North America
- 1.1. United States
- 1.2. Canada
- 1.3. Mexico
-
2. South America
- 2.1. Brazil
- 2.2. Argentina
- 2.3. Rest of South America
-
3. Europe
- 3.1. United Kingdom
- 3.2. Germany
- 3.3. France
- 3.4. Italy
- 3.5. Spain
- 3.6. Russia
- 3.7. Benelux
- 3.8. Nordics
- 3.9. Rest of Europe
-
4. Middle East & Africa
- 4.1. Turkey
- 4.2. Israel
- 4.3. GCC
- 4.4. North Africa
- 4.5. South Africa
- 4.6. Rest of Middle East & Africa
-
5. Asia Pacific
- 5.1. China
- 5.2. India
- 5.3. Japan
- 5.4. South Korea
- 5.5. ASEAN
- 5.6. Oceania
- 5.7. Rest of Asia Pacific
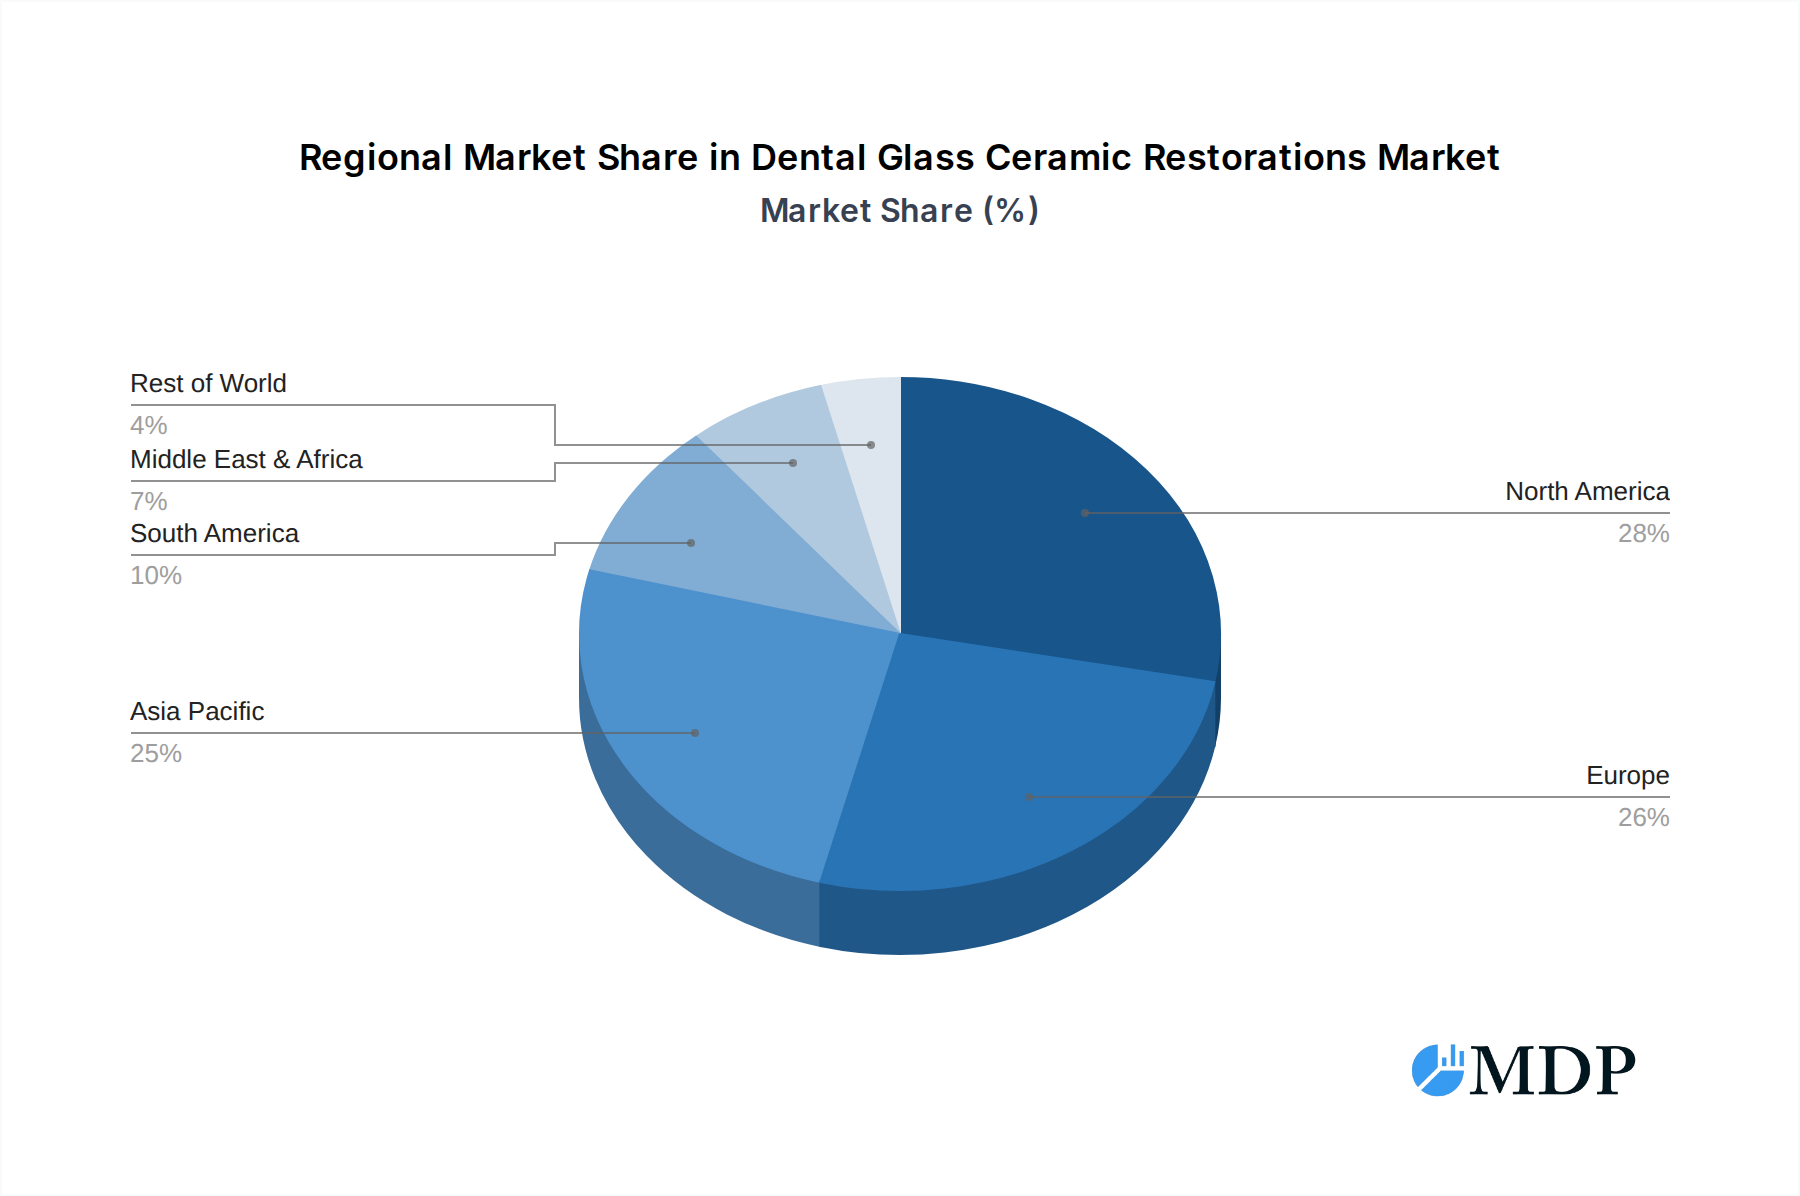
Dental Glass Ceramic Restorations Regional Market Share
Geographic Coverage of Dental Glass Ceramic Restorations
Dental Glass Ceramic Restorations REPORT HIGHLIGHTS
| Aspects | Details |
|---|---|
| Study Period | 2020-2034 |
| Base Year | 2025 |
| Estimated Year | 2026 |
| Forecast Period | 2026-2034 |
| Historical Period | 2020-2025 |
| Growth Rate | CAGR of 5.8% from 2020-2034 |
| Segmentation |
|
Table of Contents
- 1. Introduction
- 1.1. Research Scope
- 1.2. Market Segmentation
- 1.3. Research Methodology
- 1.4. Definitions and Assumptions
- 2. Executive Summary
- 2.1. Introduction
- 3. Market Dynamics
- 3.1. Introduction
- 3.2. Market Drivers
- 3.3. Market Restrains
- 3.4. Market Trends
- 4. Market Factor Analysis
- 4.1. Porters Five Forces
- 4.2. Supply/Value Chain
- 4.3. PESTEL analysis
- 4.4. Market Entropy
- 4.5. Patent/Trademark Analysis
- 5. Global Dental Glass Ceramic Restorations Analysis, Insights and Forecast, 2020-2032
- 5.1. Market Analysis, Insights and Forecast - by Application
- 5.1.1. Hospitals
- 5.1.2. Dental Clinics
- 5.1.3. Others
- 5.2. Market Analysis, Insights and Forecast - by Types
- 5.2.1. Inert Glass Powders
- 5.2.2. Reactive Glass Powders
- 5.3. Market Analysis, Insights and Forecast - by Region
- 5.3.1. North America
- 5.3.2. South America
- 5.3.3. Europe
- 5.3.4. Middle East & Africa
- 5.3.5. Asia Pacific
- 5.1. Market Analysis, Insights and Forecast - by Application
- 6. North America Dental Glass Ceramic Restorations Analysis, Insights and Forecast, 2020-2032
- 6.1. Market Analysis, Insights and Forecast - by Application
- 6.1.1. Hospitals
- 6.1.2. Dental Clinics
- 6.1.3. Others
- 6.2. Market Analysis, Insights and Forecast - by Types
- 6.2.1. Inert Glass Powders
- 6.2.2. Reactive Glass Powders
- 6.1. Market Analysis, Insights and Forecast - by Application
- 7. South America Dental Glass Ceramic Restorations Analysis, Insights and Forecast, 2020-2032
- 7.1. Market Analysis, Insights and Forecast - by Application
- 7.1.1. Hospitals
- 7.1.2. Dental Clinics
- 7.1.3. Others
- 7.2. Market Analysis, Insights and Forecast - by Types
- 7.2.1. Inert Glass Powders
- 7.2.2. Reactive Glass Powders
- 7.1. Market Analysis, Insights and Forecast - by Application
- 8. Europe Dental Glass Ceramic Restorations Analysis, Insights and Forecast, 2020-2032
- 8.1. Market Analysis, Insights and Forecast - by Application
- 8.1.1. Hospitals
- 8.1.2. Dental Clinics
- 8.1.3. Others
- 8.2. Market Analysis, Insights and Forecast - by Types
- 8.2.1. Inert Glass Powders
- 8.2.2. Reactive Glass Powders
- 8.1. Market Analysis, Insights and Forecast - by Application
- 9. Middle East & Africa Dental Glass Ceramic Restorations Analysis, Insights and Forecast, 2020-2032
- 9.1. Market Analysis, Insights and Forecast - by Application
- 9.1.1. Hospitals
- 9.1.2. Dental Clinics
- 9.1.3. Others
- 9.2. Market Analysis, Insights and Forecast - by Types
- 9.2.1. Inert Glass Powders
- 9.2.2. Reactive Glass Powders
- 9.1. Market Analysis, Insights and Forecast - by Application
- 10. Asia Pacific Dental Glass Ceramic Restorations Analysis, Insights and Forecast, 2020-2032
- 10.1. Market Analysis, Insights and Forecast - by Application
- 10.1.1. Hospitals
- 10.1.2. Dental Clinics
- 10.1.3. Others
- 10.2. Market Analysis, Insights and Forecast - by Types
- 10.2.1. Inert Glass Powders
- 10.2.2. Reactive Glass Powders
- 10.1. Market Analysis, Insights and Forecast - by Application
- 11. Competitive Analysis
- 11.1. Global Market Share Analysis 2025
- 11.2. Company Profiles
- 11.2.1 Schott
- 11.2.1.1. Overview
- 11.2.1.2. Products
- 11.2.1.3. SWOT Analysis
- 11.2.1.4. Recent Developments
- 11.2.1.5. Financials (Based on Availability)
- 11.2.2 Ferro
- 11.2.2.1. Overview
- 11.2.2.2. Products
- 11.2.2.3. SWOT Analysis
- 11.2.2.4. Recent Developments
- 11.2.2.5. Financials (Based on Availability)
- 11.2.3 James Kent Group
- 11.2.3.1. Overview
- 11.2.3.2. Products
- 11.2.3.3. SWOT Analysis
- 11.2.3.4. Recent Developments
- 11.2.3.5. Financials (Based on Availability)
- 11.2.4 3M
- 11.2.4.1. Overview
- 11.2.4.2. Products
- 11.2.4.3. SWOT Analysis
- 11.2.4.4. Recent Developments
- 11.2.4.5. Financials (Based on Availability)
- 11.2.5 Corning
- 11.2.5.1. Overview
- 11.2.5.2. Products
- 11.2.5.3. SWOT Analysis
- 11.2.5.4. Recent Developments
- 11.2.5.5. Financials (Based on Availability)
- 11.2.6 Specialty Glass
- 11.2.6.1. Overview
- 11.2.6.2. Products
- 11.2.6.3. SWOT Analysis
- 11.2.6.4. Recent Developments
- 11.2.6.5. Financials (Based on Availability)
- 11.2.7 LASCOD S.p.A.
- 11.2.7.1. Overview
- 11.2.7.2. Products
- 11.2.7.3. SWOT Analysis
- 11.2.7.4. Recent Developments
- 11.2.7.5. Financials (Based on Availability)
- 11.2.8 Prevest DenPro Limited
- 11.2.8.1. Overview
- 11.2.8.2. Products
- 11.2.8.3. SWOT Analysis
- 11.2.8.4. Recent Developments
- 11.2.8.5. Financials (Based on Availability)
- 11.2.1 Schott
List of Figures
- Figure 1: Global Dental Glass Ceramic Restorations Revenue Breakdown (undefined, %) by Region 2025 & 2033
- Figure 2: Global Dental Glass Ceramic Restorations Volume Breakdown (K, %) by Region 2025 & 2033
- Figure 3: North America Dental Glass Ceramic Restorations Revenue (undefined), by Application 2025 & 2033
- Figure 4: North America Dental Glass Ceramic Restorations Volume (K), by Application 2025 & 2033
- Figure 5: North America Dental Glass Ceramic Restorations Revenue Share (%), by Application 2025 & 2033
- Figure 6: North America Dental Glass Ceramic Restorations Volume Share (%), by Application 2025 & 2033
- Figure 7: North America Dental Glass Ceramic Restorations Revenue (undefined), by Types 2025 & 2033
- Figure 8: North America Dental Glass Ceramic Restorations Volume (K), by Types 2025 & 2033
- Figure 9: North America Dental Glass Ceramic Restorations Revenue Share (%), by Types 2025 & 2033
- Figure 10: North America Dental Glass Ceramic Restorations Volume Share (%), by Types 2025 & 2033
- Figure 11: North America Dental Glass Ceramic Restorations Revenue (undefined), by Country 2025 & 2033
- Figure 12: North America Dental Glass Ceramic Restorations Volume (K), by Country 2025 & 2033
- Figure 13: North America Dental Glass Ceramic Restorations Revenue Share (%), by Country 2025 & 2033
- Figure 14: North America Dental Glass Ceramic Restorations Volume Share (%), by Country 2025 & 2033
- Figure 15: South America Dental Glass Ceramic Restorations Revenue (undefined), by Application 2025 & 2033
- Figure 16: South America Dental Glass Ceramic Restorations Volume (K), by Application 2025 & 2033
- Figure 17: South America Dental Glass Ceramic Restorations Revenue Share (%), by Application 2025 & 2033
- Figure 18: South America Dental Glass Ceramic Restorations Volume Share (%), by Application 2025 & 2033
- Figure 19: South America Dental Glass Ceramic Restorations Revenue (undefined), by Types 2025 & 2033
- Figure 20: South America Dental Glass Ceramic Restorations Volume (K), by Types 2025 & 2033
- Figure 21: South America Dental Glass Ceramic Restorations Revenue Share (%), by Types 2025 & 2033
- Figure 22: South America Dental Glass Ceramic Restorations Volume Share (%), by Types 2025 & 2033
- Figure 23: South America Dental Glass Ceramic Restorations Revenue (undefined), by Country 2025 & 2033
- Figure 24: South America Dental Glass Ceramic Restorations Volume (K), by Country 2025 & 2033
- Figure 25: South America Dental Glass Ceramic Restorations Revenue Share (%), by Country 2025 & 2033
- Figure 26: South America Dental Glass Ceramic Restorations Volume Share (%), by Country 2025 & 2033
- Figure 27: Europe Dental Glass Ceramic Restorations Revenue (undefined), by Application 2025 & 2033
- Figure 28: Europe Dental Glass Ceramic Restorations Volume (K), by Application 2025 & 2033
- Figure 29: Europe Dental Glass Ceramic Restorations Revenue Share (%), by Application 2025 & 2033
- Figure 30: Europe Dental Glass Ceramic Restorations Volume Share (%), by Application 2025 & 2033
- Figure 31: Europe Dental Glass Ceramic Restorations Revenue (undefined), by Types 2025 & 2033
- Figure 32: Europe Dental Glass Ceramic Restorations Volume (K), by Types 2025 & 2033
- Figure 33: Europe Dental Glass Ceramic Restorations Revenue Share (%), by Types 2025 & 2033
- Figure 34: Europe Dental Glass Ceramic Restorations Volume Share (%), by Types 2025 & 2033
- Figure 35: Europe Dental Glass Ceramic Restorations Revenue (undefined), by Country 2025 & 2033
- Figure 36: Europe Dental Glass Ceramic Restorations Volume (K), by Country 2025 & 2033
- Figure 37: Europe Dental Glass Ceramic Restorations Revenue Share (%), by Country 2025 & 2033
- Figure 38: Europe Dental Glass Ceramic Restorations Volume Share (%), by Country 2025 & 2033
- Figure 39: Middle East & Africa Dental Glass Ceramic Restorations Revenue (undefined), by Application 2025 & 2033
- Figure 40: Middle East & Africa Dental Glass Ceramic Restorations Volume (K), by Application 2025 & 2033
- Figure 41: Middle East & Africa Dental Glass Ceramic Restorations Revenue Share (%), by Application 2025 & 2033
- Figure 42: Middle East & Africa Dental Glass Ceramic Restorations Volume Share (%), by Application 2025 & 2033
- Figure 43: Middle East & Africa Dental Glass Ceramic Restorations Revenue (undefined), by Types 2025 & 2033
- Figure 44: Middle East & Africa Dental Glass Ceramic Restorations Volume (K), by Types 2025 & 2033
- Figure 45: Middle East & Africa Dental Glass Ceramic Restorations Revenue Share (%), by Types 2025 & 2033
- Figure 46: Middle East & Africa Dental Glass Ceramic Restorations Volume Share (%), by Types 2025 & 2033
- Figure 47: Middle East & Africa Dental Glass Ceramic Restorations Revenue (undefined), by Country 2025 & 2033
- Figure 48: Middle East & Africa Dental Glass Ceramic Restorations Volume (K), by Country 2025 & 2033
- Figure 49: Middle East & Africa Dental Glass Ceramic Restorations Revenue Share (%), by Country 2025 & 2033
- Figure 50: Middle East & Africa Dental Glass Ceramic Restorations Volume Share (%), by Country 2025 & 2033
- Figure 51: Asia Pacific Dental Glass Ceramic Restorations Revenue (undefined), by Application 2025 & 2033
- Figure 52: Asia Pacific Dental Glass Ceramic Restorations Volume (K), by Application 2025 & 2033
- Figure 53: Asia Pacific Dental Glass Ceramic Restorations Revenue Share (%), by Application 2025 & 2033
- Figure 54: Asia Pacific Dental Glass Ceramic Restorations Volume Share (%), by Application 2025 & 2033
- Figure 55: Asia Pacific Dental Glass Ceramic Restorations Revenue (undefined), by Types 2025 & 2033
- Figure 56: Asia Pacific Dental Glass Ceramic Restorations Volume (K), by Types 2025 & 2033
- Figure 57: Asia Pacific Dental Glass Ceramic Restorations Revenue Share (%), by Types 2025 & 2033
- Figure 58: Asia Pacific Dental Glass Ceramic Restorations Volume Share (%), by Types 2025 & 2033
- Figure 59: Asia Pacific Dental Glass Ceramic Restorations Revenue (undefined), by Country 2025 & 2033
- Figure 60: Asia Pacific Dental Glass Ceramic Restorations Volume (K), by Country 2025 & 2033
- Figure 61: Asia Pacific Dental Glass Ceramic Restorations Revenue Share (%), by Country 2025 & 2033
- Figure 62: Asia Pacific Dental Glass Ceramic Restorations Volume Share (%), by Country 2025 & 2033
List of Tables
- Table 1: Global Dental Glass Ceramic Restorations Revenue undefined Forecast, by Application 2020 & 2033
- Table 2: Global Dental Glass Ceramic Restorations Volume K Forecast, by Application 2020 & 2033
- Table 3: Global Dental Glass Ceramic Restorations Revenue undefined Forecast, by Types 2020 & 2033
- Table 4: Global Dental Glass Ceramic Restorations Volume K Forecast, by Types 2020 & 2033
- Table 5: Global Dental Glass Ceramic Restorations Revenue undefined Forecast, by Region 2020 & 2033
- Table 6: Global Dental Glass Ceramic Restorations Volume K Forecast, by Region 2020 & 2033
- Table 7: Global Dental Glass Ceramic Restorations Revenue undefined Forecast, by Application 2020 & 2033
- Table 8: Global Dental Glass Ceramic Restorations Volume K Forecast, by Application 2020 & 2033
- Table 9: Global Dental Glass Ceramic Restorations Revenue undefined Forecast, by Types 2020 & 2033
- Table 10: Global Dental Glass Ceramic Restorations Volume K Forecast, by Types 2020 & 2033
- Table 11: Global Dental Glass Ceramic Restorations Revenue undefined Forecast, by Country 2020 & 2033
- Table 12: Global Dental Glass Ceramic Restorations Volume K Forecast, by Country 2020 & 2033
- Table 13: United States Dental Glass Ceramic Restorations Revenue (undefined) Forecast, by Application 2020 & 2033
- Table 14: United States Dental Glass Ceramic Restorations Volume (K) Forecast, by Application 2020 & 2033
- Table 15: Canada Dental Glass Ceramic Restorations Revenue (undefined) Forecast, by Application 2020 & 2033
- Table 16: Canada Dental Glass Ceramic Restorations Volume (K) Forecast, by Application 2020 & 2033
- Table 17: Mexico Dental Glass Ceramic Restorations Revenue (undefined) Forecast, by Application 2020 & 2033
- Table 18: Mexico Dental Glass Ceramic Restorations Volume (K) Forecast, by Application 2020 & 2033
- Table 19: Global Dental Glass Ceramic Restorations Revenue undefined Forecast, by Application 2020 & 2033
- Table 20: Global Dental Glass Ceramic Restorations Volume K Forecast, by Application 2020 & 2033
- Table 21: Global Dental Glass Ceramic Restorations Revenue undefined Forecast, by Types 2020 & 2033
- Table 22: Global Dental Glass Ceramic Restorations Volume K Forecast, by Types 2020 & 2033
- Table 23: Global Dental Glass Ceramic Restorations Revenue undefined Forecast, by Country 2020 & 2033
- Table 24: Global Dental Glass Ceramic Restorations Volume K Forecast, by Country 2020 & 2033
- Table 25: Brazil Dental Glass Ceramic Restorations Revenue (undefined) Forecast, by Application 2020 & 2033
- Table 26: Brazil Dental Glass Ceramic Restorations Volume (K) Forecast, by Application 2020 & 2033
- Table 27: Argentina Dental Glass Ceramic Restorations Revenue (undefined) Forecast, by Application 2020 & 2033
- Table 28: Argentina Dental Glass Ceramic Restorations Volume (K) Forecast, by Application 2020 & 2033
- Table 29: Rest of South America Dental Glass Ceramic Restorations Revenue (undefined) Forecast, by Application 2020 & 2033
- Table 30: Rest of South America Dental Glass Ceramic Restorations Volume (K) Forecast, by Application 2020 & 2033
- Table 31: Global Dental Glass Ceramic Restorations Revenue undefined Forecast, by Application 2020 & 2033
- Table 32: Global Dental Glass Ceramic Restorations Volume K Forecast, by Application 2020 & 2033
- Table 33: Global Dental Glass Ceramic Restorations Revenue undefined Forecast, by Types 2020 & 2033
- Table 34: Global Dental Glass Ceramic Restorations Volume K Forecast, by Types 2020 & 2033
- Table 35: Global Dental Glass Ceramic Restorations Revenue undefined Forecast, by Country 2020 & 2033
- Table 36: Global Dental Glass Ceramic Restorations Volume K Forecast, by Country 2020 & 2033
- Table 37: United Kingdom Dental Glass Ceramic Restorations Revenue (undefined) Forecast, by Application 2020 & 2033
- Table 38: United Kingdom Dental Glass Ceramic Restorations Volume (K) Forecast, by Application 2020 & 2033
- Table 39: Germany Dental Glass Ceramic Restorations Revenue (undefined) Forecast, by Application 2020 & 2033
- Table 40: Germany Dental Glass Ceramic Restorations Volume (K) Forecast, by Application 2020 & 2033
- Table 41: France Dental Glass Ceramic Restorations Revenue (undefined) Forecast, by Application 2020 & 2033
- Table 42: France Dental Glass Ceramic Restorations Volume (K) Forecast, by Application 2020 & 2033
- Table 43: Italy Dental Glass Ceramic Restorations Revenue (undefined) Forecast, by Application 2020 & 2033
- Table 44: Italy Dental Glass Ceramic Restorations Volume (K) Forecast, by Application 2020 & 2033
- Table 45: Spain Dental Glass Ceramic Restorations Revenue (undefined) Forecast, by Application 2020 & 2033
- Table 46: Spain Dental Glass Ceramic Restorations Volume (K) Forecast, by Application 2020 & 2033
- Table 47: Russia Dental Glass Ceramic Restorations Revenue (undefined) Forecast, by Application 2020 & 2033
- Table 48: Russia Dental Glass Ceramic Restorations Volume (K) Forecast, by Application 2020 & 2033
- Table 49: Benelux Dental Glass Ceramic Restorations Revenue (undefined) Forecast, by Application 2020 & 2033
- Table 50: Benelux Dental Glass Ceramic Restorations Volume (K) Forecast, by Application 2020 & 2033
- Table 51: Nordics Dental Glass Ceramic Restorations Revenue (undefined) Forecast, by Application 2020 & 2033
- Table 52: Nordics Dental Glass Ceramic Restorations Volume (K) Forecast, by Application 2020 & 2033
- Table 53: Rest of Europe Dental Glass Ceramic Restorations Revenue (undefined) Forecast, by Application 2020 & 2033
- Table 54: Rest of Europe Dental Glass Ceramic Restorations Volume (K) Forecast, by Application 2020 & 2033
- Table 55: Global Dental Glass Ceramic Restorations Revenue undefined Forecast, by Application 2020 & 2033
- Table 56: Global Dental Glass Ceramic Restorations Volume K Forecast, by Application 2020 & 2033
- Table 57: Global Dental Glass Ceramic Restorations Revenue undefined Forecast, by Types 2020 & 2033
- Table 58: Global Dental Glass Ceramic Restorations Volume K Forecast, by Types 2020 & 2033
- Table 59: Global Dental Glass Ceramic Restorations Revenue undefined Forecast, by Country 2020 & 2033
- Table 60: Global Dental Glass Ceramic Restorations Volume K Forecast, by Country 2020 & 2033
- Table 61: Turkey Dental Glass Ceramic Restorations Revenue (undefined) Forecast, by Application 2020 & 2033
- Table 62: Turkey Dental Glass Ceramic Restorations Volume (K) Forecast, by Application 2020 & 2033
- Table 63: Israel Dental Glass Ceramic Restorations Revenue (undefined) Forecast, by Application 2020 & 2033
- Table 64: Israel Dental Glass Ceramic Restorations Volume (K) Forecast, by Application 2020 & 2033
- Table 65: GCC Dental Glass Ceramic Restorations Revenue (undefined) Forecast, by Application 2020 & 2033
- Table 66: GCC Dental Glass Ceramic Restorations Volume (K) Forecast, by Application 2020 & 2033
- Table 67: North Africa Dental Glass Ceramic Restorations Revenue (undefined) Forecast, by Application 2020 & 2033
- Table 68: North Africa Dental Glass Ceramic Restorations Volume (K) Forecast, by Application 2020 & 2033
- Table 69: South Africa Dental Glass Ceramic Restorations Revenue (undefined) Forecast, by Application 2020 & 2033
- Table 70: South Africa Dental Glass Ceramic Restorations Volume (K) Forecast, by Application 2020 & 2033
- Table 71: Rest of Middle East & Africa Dental Glass Ceramic Restorations Revenue (undefined) Forecast, by Application 2020 & 2033
- Table 72: Rest of Middle East & Africa Dental Glass Ceramic Restorations Volume (K) Forecast, by Application 2020 & 2033
- Table 73: Global Dental Glass Ceramic Restorations Revenue undefined Forecast, by Application 2020 & 2033
- Table 74: Global Dental Glass Ceramic Restorations Volume K Forecast, by Application 2020 & 2033
- Table 75: Global Dental Glass Ceramic Restorations Revenue undefined Forecast, by Types 2020 & 2033
- Table 76: Global Dental Glass Ceramic Restorations Volume K Forecast, by Types 2020 & 2033
- Table 77: Global Dental Glass Ceramic Restorations Revenue undefined Forecast, by Country 2020 & 2033
- Table 78: Global Dental Glass Ceramic Restorations Volume K Forecast, by Country 2020 & 2033
- Table 79: China Dental Glass Ceramic Restorations Revenue (undefined) Forecast, by Application 2020 & 2033
- Table 80: China Dental Glass Ceramic Restorations Volume (K) Forecast, by Application 2020 & 2033
- Table 81: India Dental Glass Ceramic Restorations Revenue (undefined) Forecast, by Application 2020 & 2033
- Table 82: India Dental Glass Ceramic Restorations Volume (K) Forecast, by Application 2020 & 2033
- Table 83: Japan Dental Glass Ceramic Restorations Revenue (undefined) Forecast, by Application 2020 & 2033
- Table 84: Japan Dental Glass Ceramic Restorations Volume (K) Forecast, by Application 2020 & 2033
- Table 85: South Korea Dental Glass Ceramic Restorations Revenue (undefined) Forecast, by Application 2020 & 2033
- Table 86: South Korea Dental Glass Ceramic Restorations Volume (K) Forecast, by Application 2020 & 2033
- Table 87: ASEAN Dental Glass Ceramic Restorations Revenue (undefined) Forecast, by Application 2020 & 2033
- Table 88: ASEAN Dental Glass Ceramic Restorations Volume (K) Forecast, by Application 2020 & 2033
- Table 89: Oceania Dental Glass Ceramic Restorations Revenue (undefined) Forecast, by Application 2020 & 2033
- Table 90: Oceania Dental Glass Ceramic Restorations Volume (K) Forecast, by Application 2020 & 2033
- Table 91: Rest of Asia Pacific Dental Glass Ceramic Restorations Revenue (undefined) Forecast, by Application 2020 & 2033
- Table 92: Rest of Asia Pacific Dental Glass Ceramic Restorations Volume (K) Forecast, by Application 2020 & 2033
Frequently Asked Questions
1. What is the projected Compound Annual Growth Rate (CAGR) of the Dental Glass Ceramic Restorations?
The projected CAGR is approximately 5.8%.
2. Which companies are prominent players in the Dental Glass Ceramic Restorations?
Key companies in the market include Schott, Ferro, James Kent Group, 3M, Corning, Specialty Glass, LASCOD S.p.A., Prevest DenPro Limited.
3. What are the main segments of the Dental Glass Ceramic Restorations?
The market segments include Application, Types.
4. Can you provide details about the market size?
The market size is estimated to be USD XXX N/A as of 2022.
5. What are some drivers contributing to market growth?
N/A
6. What are the notable trends driving market growth?
N/A
7. Are there any restraints impacting market growth?
N/A
8. Can you provide examples of recent developments in the market?
N/A
9. What pricing options are available for accessing the report?
Pricing options include single-user, multi-user, and enterprise licenses priced at USD 3950.00, USD 5925.00, and USD 7900.00 respectively.
10. Is the market size provided in terms of value or volume?
The market size is provided in terms of value, measured in N/A and volume, measured in K.
11. Are there any specific market keywords associated with the report?
Yes, the market keyword associated with the report is "Dental Glass Ceramic Restorations," which aids in identifying and referencing the specific market segment covered.
12. How do I determine which pricing option suits my needs best?
The pricing options vary based on user requirements and access needs. Individual users may opt for single-user licenses, while businesses requiring broader access may choose multi-user or enterprise licenses for cost-effective access to the report.
13. Are there any additional resources or data provided in the Dental Glass Ceramic Restorations report?
While the report offers comprehensive insights, it's advisable to review the specific contents or supplementary materials provided to ascertain if additional resources or data are available.
14. How can I stay updated on further developments or reports in the Dental Glass Ceramic Restorations?
To stay informed about further developments, trends, and reports in the Dental Glass Ceramic Restorations, consider subscribing to industry newsletters, following relevant companies and organizations, or regularly checking reputable industry news sources and publications.
Methodology
Step 1 - Identification of Relevant Samples Size from Population Database


Step 2 - Approaches for Defining Global Market Size (Value, Volume* & Price*)

Note*: In applicable scenarios
Step 3 - Data Sources
Primary Research
- Web Analytics
- Survey Reports
- Research Institute
- Latest Research Reports
- Opinion Leaders
Secondary Research
- Annual Reports
- White Paper
- Latest Press Release
- Industry Association
- Paid Database
- Investor Presentations

Step 4 - Data Triangulation
Involves using different sources of information in order to increase the validity of a study
These sources are likely to be stakeholders in a program - participants, other researchers, program staff, other community members, and so on.
Then we put all data in single framework & apply various statistical tools to find out the dynamic on the market.
During the analysis stage, feedback from the stakeholder groups would be compared to determine areas of agreement as well as areas of divergence