

Key Insights
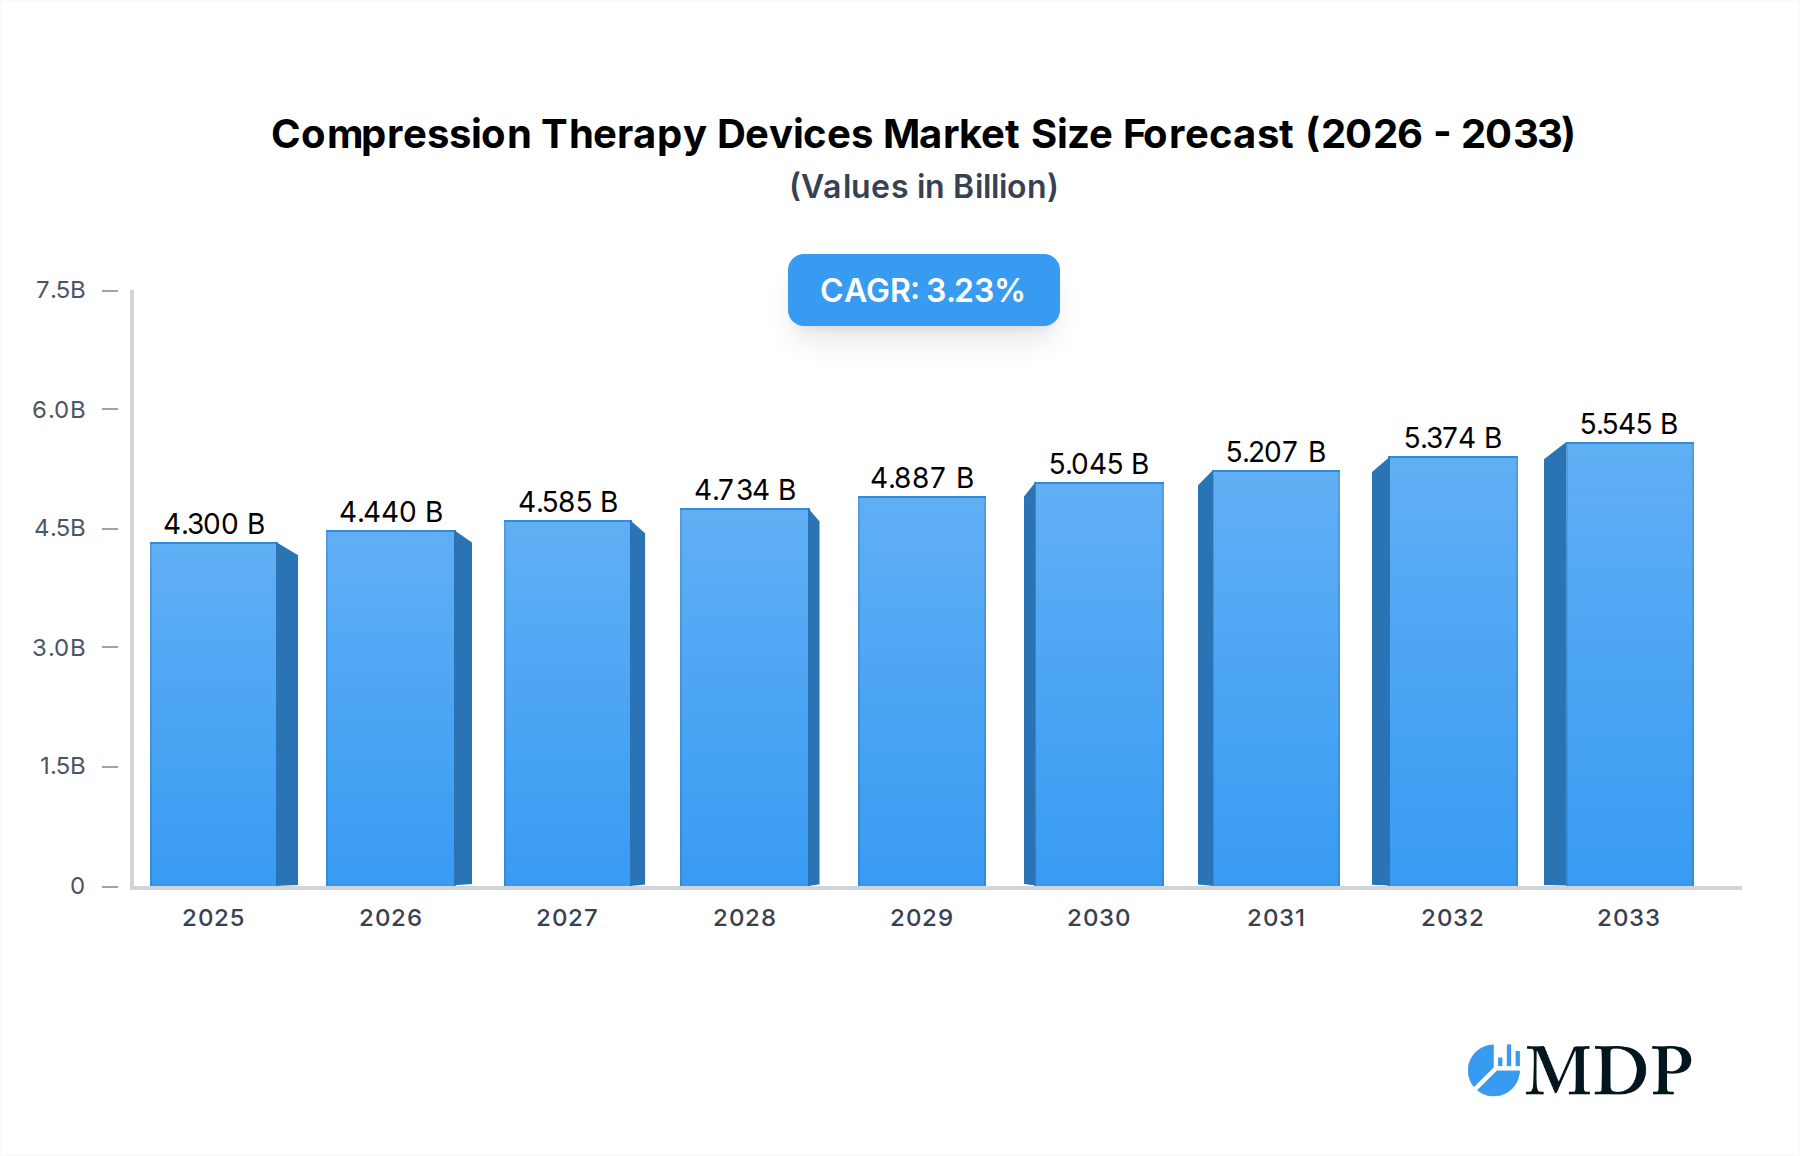
The global Compression Therapy Devices market is poised for robust growth, projected to reach USD 4.3 billion in 2025 and expand at a compound annual growth rate (CAGR) of 3.2% through 2033. This expansion is primarily fueled by the increasing prevalence of chronic venous diseases, deep vein thrombosis (DVT), and lymphedema, conditions that necessitate effective compression solutions. A growing aging population, coupled with rising healthcare expenditure and greater awareness regarding preventive healthcare measures, are significant drivers propelling market demand. Furthermore, advancements in product innovation, including the development of more comfortable, user-friendly, and technologically advanced compression devices, are contributing to market penetration and adoption across various healthcare settings. The rising incidence of lifestyle-related diseases and the growing number of surgical procedures also play a crucial role in the sustained demand for compression therapy.

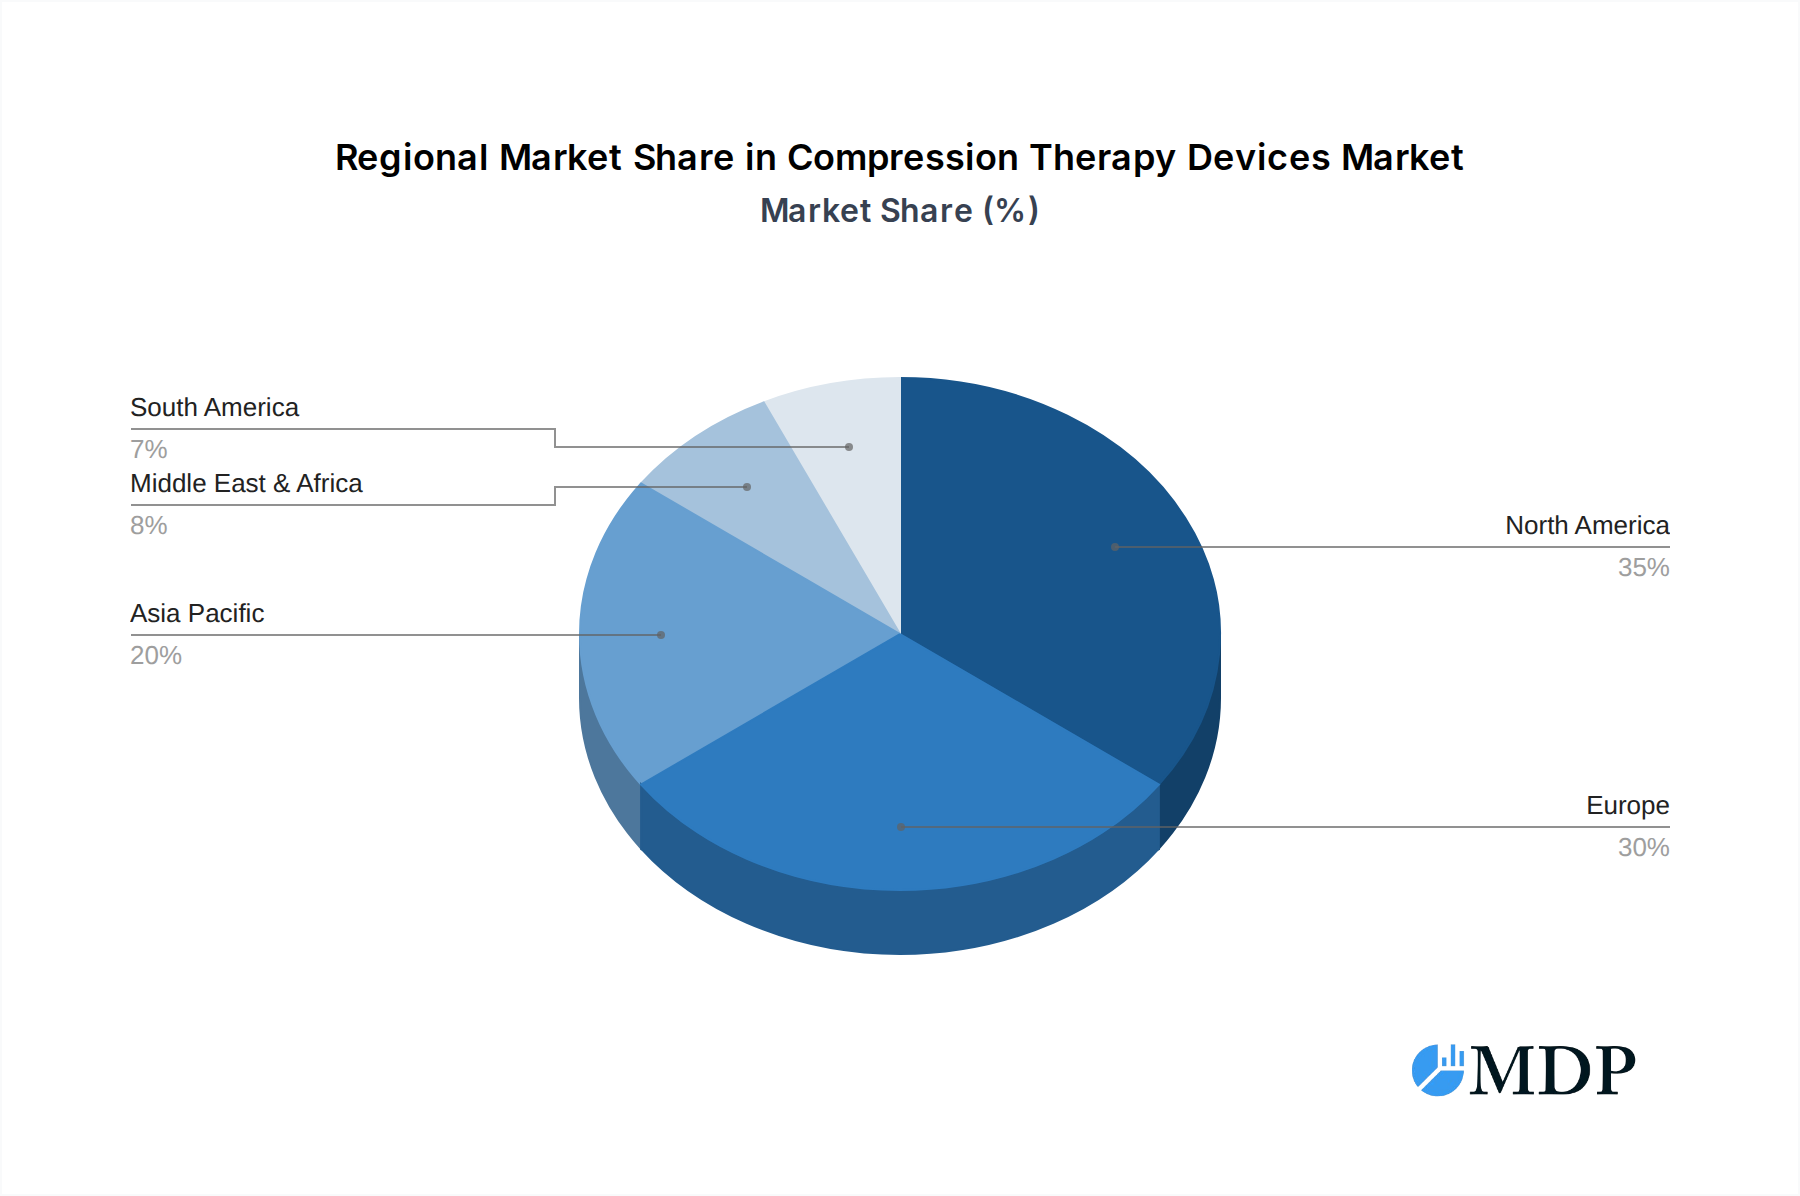
Compression Therapy Devices Market Size (In Billion)
The market is segmented into static and dynamic compression therapy, with static compression therapy currently holding a larger market share due to its widespread use in managing venous insufficiency and post-operative recovery. However, dynamic compression therapy is witnessing a substantial growth trajectory, driven by its efficacy in treating more complex cases of lymphedema and its adoption in athletic recovery and sports medicine. Hospitals and clinics are the dominant end-use segments, owing to the higher concentration of patients requiring compression therapy post-surgery or for chronic conditions. Ambulatory surgical centers are also emerging as a significant segment with the increasing trend of outpatient procedures. Geographically, North America and Europe currently lead the market, attributed to advanced healthcare infrastructure, high patient awareness, and favorable reimbursement policies. However, the Asia Pacific region is expected to exhibit the fastest growth, propelled by a large and growing population, increasing disposable incomes, and a burgeoning healthcare sector. Restraints such as high device costs and limited awareness in certain developing regions may temper growth, but the overall outlook remains positive due to the clear clinical benefits and evolving product landscape.
Compression Therapy Devices Company Market Share
Compression Therapy Devices Market Dynamics & Concentration
The compression therapy devices market is characterized by a moderate to high level of concentration, with established players like Medtronic, 3M, Smith & Nephew, Sigvaris, and Hartmann Group holding significant market shares. The competitive landscape is further shaped by companies such as Medi, BSN medical, ArjoHuntleigh, Juzo, and Gottfried Medical, each contributing unique technological innovations and market reach. Innovation is a key driver, fueled by advancements in materials science, miniaturization of dynamic compression technology, and increasing demand for personalized treatment solutions. Regulatory frameworks, particularly those set by the FDA and EMA, play a crucial role in market entry and product development, ensuring patient safety and device efficacy. Product substitutes, while limited in direct therapeutic equivalence, include alternative treatments for venous insufficiency and lymphedema, such as pharmacological interventions and manual lymphatic drainage. End-user trends indicate a growing preference for non-invasive, patient-friendly devices that can be used at home, alongside a sustained demand for hospital-grade equipment. Mergers and acquisitions (M&A) activities are a notable aspect of market dynamics, with approximately 5-10 significant M&A deals estimated annually over the historical period, aimed at consolidating market presence, expanding product portfolios, and acquiring innovative technologies. For instance, a major acquisition in 2023 by a leading player bolstered their dynamic compression offerings, capturing an additional 3-5% market share.
Compression Therapy Devices Industry Trends & Analysis
The compression therapy devices market is experiencing robust growth, driven by an increasing prevalence of chronic venous diseases, lymphedema, and deep vein thrombosis (DVT), conditions that necessitate effective compression management. The global market size for compression therapy devices is projected to reach approximately $12 billion by 2025, with a compound annual growth rate (CAGR) of around 6.5% anticipated between 2025 and 2033. This expansion is primarily fueled by the aging global population, a demographic that is more susceptible to circulatory issues, and a rising awareness among healthcare professionals and patients regarding the benefits of compression therapy in preventing complications and improving quality of life. Technological disruptions are continuously reshaping the industry. Innovations in material science have led to the development of more comfortable, breathable, and durable compression garments. The integration of smart technologies, such as sensors and connectivity features in dynamic compression devices, is enabling real-time monitoring of treatment adherence and efficacy, paving the way for personalized treatment plans. Consumer preferences are leaning towards user-friendly, aesthetically pleasing, and discreet compression solutions, particularly for intermittent use and home-based therapies. The competitive dynamics are intense, with companies investing heavily in research and development to differentiate their offerings and capture market share. Market penetration is steadily increasing across developed economies, while emerging markets present significant untapped potential due to improving healthcare infrastructure and rising disposable incomes. The global market penetration is estimated to be around 30-35% by 2025, with significant regional variations. Furthermore, the growing adoption of telemedicine and remote patient monitoring further supports the demand for advanced compression devices that facilitate remote care.
Leading Markets & Segments in Compression Therapy Devices
The hospitals segment is a dominant force within the compression therapy devices market, driven by the critical need for these devices in managing acute conditions like DVT prophylaxis post-surgery, managing venous ulcers, and treating post-operative edema. The hospital application segment is estimated to account for approximately 40-45% of the total market revenue by 2025. Key drivers for this dominance include the presence of advanced healthcare infrastructure, a high volume of surgical procedures, and the established protocols for using compression therapy in critical care settings. Within hospitals, the static compression therapy type, encompassing compression stockings and bandages, remains a staple due to its cost-effectiveness and proven efficacy in long-term management and prevention. The static compression therapy segment is projected to hold around 60-65% of the overall market by volume. However, the dynamic compression therapy segment, which includes intermittent pneumatic compression (IPC) devices, is experiencing rapid growth, particularly in hospital settings for DVT prevention and post-operative rehabilitation.
Geographically, North America is a leading market, projected to contribute over 30% of the global revenue in 2025. This leadership is attributed to a high prevalence of target diseases, advanced healthcare spending, and the early adoption of innovative medical technologies. The United States, in particular, is a significant contributor, owing to a large aging population and a robust reimbursement landscape for medical devices. The increasing number of elective surgeries, coupled with a strong emphasis on patient recovery and preventative care, further solidifies North America's position.
The clinics segment is also a crucial contributor, estimated to represent 25-30% of the market by 2025, offering specialized care for chronic conditions and rehabilitation services. Ambulatory surgical centers (ASCs) represent a growing segment, valued at approximately 15-20% of the market, benefiting from the increasing trend of outpatient procedures where DVT prophylaxis is essential. The "Others" segment, encompassing home healthcare and specialized rehabilitation centers, is also expanding, driven by a shift towards home-based care and the need for continuous management of chronic conditions.
Compression Therapy Devices Product Developments
Product innovations in compression therapy devices are centered on enhancing patient comfort, improving therapeutic outcomes, and integrating smart functionalities. Recent developments include advanced fabric technologies offering graduated compression with superior breathability and moisture-wicking properties. The emergence of personalized compression garments, tailored to individual patient measurements and specific medical needs, is a key trend. Furthermore, the integration of Bluetooth connectivity in dynamic compression devices allows for seamless data tracking and remote patient monitoring, empowering both patients and healthcare providers with actionable insights. These advancements aim to improve patient adherence, reduce the incidence of complications, and streamline treatment management, offering a competitive edge to manufacturers.
Key Drivers of Compression Therapy Devices Growth
Several key drivers are propelling the growth of the compression therapy devices market. Technologically, the continuous innovation in materials science, leading to more comfortable and effective garments, and the miniaturization and smart integration of dynamic compression systems are pivotal. Economically, rising healthcare expenditures globally, coupled with increasing disposable incomes in emerging economies, are making advanced compression therapies more accessible. Regulatory bodies are also playing a role by providing clear guidelines and approval pathways for new devices, fostering innovation and market entry. The escalating prevalence of chronic conditions such as venous insufficiency and lymphedema, fueled by an aging population and sedentary lifestyles, presents a substantial unmet need, directly translating into increased demand for these devices.
Challenges in the Compression Therapy Devices Market
Despite robust growth, the compression therapy devices market faces several challenges. Stringent regulatory hurdles for product approval in different regions can lead to prolonged development cycles and increased costs. Supply chain disruptions, particularly in sourcing specialized materials and manufacturing components, can impact production timelines and pricing. Competitive pressures from both established players and new entrants drive down profit margins, necessitating continuous innovation and cost optimization. Furthermore, challenges in patient adherence to long-term compression therapy regimes, often due to discomfort, inconvenience, or lack of awareness, remain a significant restraint, limiting the full realization of therapeutic benefits and market potential, estimated to impact market growth by approximately 2-3% annually.
Emerging Opportunities in Compression Therapy Devices
Emerging opportunities in the compression therapy devices market are significant and multifaceted. The expanding healthcare infrastructure in developing economies presents a vast untapped market for both static and dynamic compression solutions. Technological breakthroughs in wearable technology and AI are paving the way for predictive analytics in DVT prevention and personalized treatment recommendations. Strategic partnerships between device manufacturers, healthcare providers, and research institutions are fostering collaborative innovation and accelerating the development of next-generation therapies. The increasing focus on preventative healthcare and home-based treatment models further amplifies the demand for user-friendly, effective, and digitally integrated compression devices. The exploration of new applications, such as sports recovery and industrial use, also offers promising avenues for market expansion.
Leading Players in the Compression Therapy Devices Sector
- Medtronic
- 3M
- Smith & Nephew
- Sigvaris
- Hartmann Group
- Medi
- BSN medical
- ArjoHuntleigh
- Juzo
- Gottfried Medical
Key Milestones in Compression Therapy Devices Industry
- 2019: Launch of advanced fabric technology by a major player, enhancing breathability and patient comfort.
- 2020: Increased adoption of static compression stockings for DVT prophylaxis in hospitals due to rising surgical volumes.
- 2021: Regulatory approval for a novel smart compression garment integrating biosensors for remote monitoring.
- 2022: Significant M&A activity with a large medical device company acquiring a key player in dynamic compression therapy, strengthening its portfolio.
- 2023: Expansion of indications for certain compression devices by regulatory bodies, broadening their therapeutic applications.
- 2024: Introduction of AI-powered diagnostic tools integrated with compression therapy devices to personalize treatment plans.
Strategic Outlook for Compression Therapy Devices Market
The strategic outlook for the compression therapy devices market is highly positive, driven by an ever-increasing demand for effective solutions for chronic circulatory conditions and a robust pipeline of technological advancements. Growth accelerators include the expanding applications of compression therapy beyond traditional medical uses into areas like sports recovery, and the continued integration of digital health technologies for enhanced patient engagement and remote management. Key opportunities lie in capitalizing on the growing geriatric population, expanding into emerging markets with tailored product offerings, and fostering strategic alliances to drive innovation and market penetration. The focus will increasingly be on developing smart, personalized, and user-centric compression solutions that deliver superior clinical outcomes and improved patient experiences, ensuring sustained market growth over the forecast period and beyond.
Compression Therapy Devices Segmentation
-
1. Application
- 1.1. Hospitals
- 1.2. Clinics
- 1.3. Ambulatory Surgical Centers
- 1.4. Others
-
2. Types
- 2.1. Static Compression Therapy
- 2.2. Dynamic Compression Therapy
Compression Therapy Devices Segmentation By Geography
-
1. North America
- 1.1. United States
- 1.2. Canada
- 1.3. Mexico
-
2. South America
- 2.1. Brazil
- 2.2. Argentina
- 2.3. Rest of South America
-
3. Europe
- 3.1. United Kingdom
- 3.2. Germany
- 3.3. France
- 3.4. Italy
- 3.5. Spain
- 3.6. Russia
- 3.7. Benelux
- 3.8. Nordics
- 3.9. Rest of Europe
-
4. Middle East & Africa
- 4.1. Turkey
- 4.2. Israel
- 4.3. GCC
- 4.4. North Africa
- 4.5. South Africa
- 4.6. Rest of Middle East & Africa
-
5. Asia Pacific
- 5.1. China
- 5.2. India
- 5.3. Japan
- 5.4. South Korea
- 5.5. ASEAN
- 5.6. Oceania
- 5.7. Rest of Asia Pacific
Compression Therapy Devices Regional Market Share
Geographic Coverage of Compression Therapy Devices
Compression Therapy Devices REPORT HIGHLIGHTS
| Aspects | Details |
|---|---|
| Study Period | 2020-2034 |
| Base Year | 2025 |
| Estimated Year | 2026 |
| Forecast Period | 2026-2034 |
| Historical Period | 2020-2025 |
| Growth Rate | CAGR of 3.2% from 2020-2034 |
| Segmentation |
|
Table of Contents
- 1. Introduction
- 1.1. Research Scope
- 1.2. Market Segmentation
- 1.3. Research Methodology
- 1.4. Definitions and Assumptions
- 2. Executive Summary
- 2.1. Introduction
- 3. Market Dynamics
- 3.1. Introduction
- 3.2. Market Drivers
- 3.3. Market Restrains
- 3.4. Market Trends
- 4. Market Factor Analysis
- 4.1. Porters Five Forces
- 4.2. Supply/Value Chain
- 4.3. PESTEL analysis
- 4.4. Market Entropy
- 4.5. Patent/Trademark Analysis
- 5. Global Compression Therapy Devices Analysis, Insights and Forecast, 2020-2032
- 5.1. Market Analysis, Insights and Forecast - by Application
- 5.1.1. Hospitals
- 5.1.2. Clinics
- 5.1.3. Ambulatory Surgical Centers
- 5.1.4. Others
- 5.2. Market Analysis, Insights and Forecast - by Types
- 5.2.1. Static Compression Therapy
- 5.2.2. Dynamic Compression Therapy
- 5.3. Market Analysis, Insights and Forecast - by Region
- 5.3.1. North America
- 5.3.2. South America
- 5.3.3. Europe
- 5.3.4. Middle East & Africa
- 5.3.5. Asia Pacific
- 5.1. Market Analysis, Insights and Forecast - by Application
- 6. North America Compression Therapy Devices Analysis, Insights and Forecast, 2020-2032
- 6.1. Market Analysis, Insights and Forecast - by Application
- 6.1.1. Hospitals
- 6.1.2. Clinics
- 6.1.3. Ambulatory Surgical Centers
- 6.1.4. Others
- 6.2. Market Analysis, Insights and Forecast - by Types
- 6.2.1. Static Compression Therapy
- 6.2.2. Dynamic Compression Therapy
- 6.1. Market Analysis, Insights and Forecast - by Application
- 7. South America Compression Therapy Devices Analysis, Insights and Forecast, 2020-2032
- 7.1. Market Analysis, Insights and Forecast - by Application
- 7.1.1. Hospitals
- 7.1.2. Clinics
- 7.1.3. Ambulatory Surgical Centers
- 7.1.4. Others
- 7.2. Market Analysis, Insights and Forecast - by Types
- 7.2.1. Static Compression Therapy
- 7.2.2. Dynamic Compression Therapy
- 7.1. Market Analysis, Insights and Forecast - by Application
- 8. Europe Compression Therapy Devices Analysis, Insights and Forecast, 2020-2032
- 8.1. Market Analysis, Insights and Forecast - by Application
- 8.1.1. Hospitals
- 8.1.2. Clinics
- 8.1.3. Ambulatory Surgical Centers
- 8.1.4. Others
- 8.2. Market Analysis, Insights and Forecast - by Types
- 8.2.1. Static Compression Therapy
- 8.2.2. Dynamic Compression Therapy
- 8.1. Market Analysis, Insights and Forecast - by Application
- 9. Middle East & Africa Compression Therapy Devices Analysis, Insights and Forecast, 2020-2032
- 9.1. Market Analysis, Insights and Forecast - by Application
- 9.1.1. Hospitals
- 9.1.2. Clinics
- 9.1.3. Ambulatory Surgical Centers
- 9.1.4. Others
- 9.2. Market Analysis, Insights and Forecast - by Types
- 9.2.1. Static Compression Therapy
- 9.2.2. Dynamic Compression Therapy
- 9.1. Market Analysis, Insights and Forecast - by Application
- 10. Asia Pacific Compression Therapy Devices Analysis, Insights and Forecast, 2020-2032
- 10.1. Market Analysis, Insights and Forecast - by Application
- 10.1.1. Hospitals
- 10.1.2. Clinics
- 10.1.3. Ambulatory Surgical Centers
- 10.1.4. Others
- 10.2. Market Analysis, Insights and Forecast - by Types
- 10.2.1. Static Compression Therapy
- 10.2.2. Dynamic Compression Therapy
- 10.1. Market Analysis, Insights and Forecast - by Application
- 11. Competitive Analysis
- 11.1. Global Market Share Analysis 2025
- 11.2. Company Profiles
- 11.2.1 Medtronic
- 11.2.1.1. Overview
- 11.2.1.2. Products
- 11.2.1.3. SWOT Analysis
- 11.2.1.4. Recent Developments
- 11.2.1.5. Financials (Based on Availability)
- 11.2.2 3M
- 11.2.2.1. Overview
- 11.2.2.2. Products
- 11.2.2.3. SWOT Analysis
- 11.2.2.4. Recent Developments
- 11.2.2.5. Financials (Based on Availability)
- 11.2.3 Smith & Nephew
- 11.2.3.1. Overview
- 11.2.3.2. Products
- 11.2.3.3. SWOT Analysis
- 11.2.3.4. Recent Developments
- 11.2.3.5. Financials (Based on Availability)
- 11.2.4 Sigvaris
- 11.2.4.1. Overview
- 11.2.4.2. Products
- 11.2.4.3. SWOT Analysis
- 11.2.4.4. Recent Developments
- 11.2.4.5. Financials (Based on Availability)
- 11.2.5 Hartmann Group
- 11.2.5.1. Overview
- 11.2.5.2. Products
- 11.2.5.3. SWOT Analysis
- 11.2.5.4. Recent Developments
- 11.2.5.5. Financials (Based on Availability)
- 11.2.6 Medi
- 11.2.6.1. Overview
- 11.2.6.2. Products
- 11.2.6.3. SWOT Analysis
- 11.2.6.4. Recent Developments
- 11.2.6.5. Financials (Based on Availability)
- 11.2.7 BSN medical
- 11.2.7.1. Overview
- 11.2.7.2. Products
- 11.2.7.3. SWOT Analysis
- 11.2.7.4. Recent Developments
- 11.2.7.5. Financials (Based on Availability)
- 11.2.8 ArjoHuntleigh
- 11.2.8.1. Overview
- 11.2.8.2. Products
- 11.2.8.3. SWOT Analysis
- 11.2.8.4. Recent Developments
- 11.2.8.5. Financials (Based on Availability)
- 11.2.9 Juzo
- 11.2.9.1. Overview
- 11.2.9.2. Products
- 11.2.9.3. SWOT Analysis
- 11.2.9.4. Recent Developments
- 11.2.9.5. Financials (Based on Availability)
- 11.2.10 Gottfried Medical
- 11.2.10.1. Overview
- 11.2.10.2. Products
- 11.2.10.3. SWOT Analysis
- 11.2.10.4. Recent Developments
- 11.2.10.5. Financials (Based on Availability)
- 11.2.1 Medtronic
List of Figures
- Figure 1: Global Compression Therapy Devices Revenue Breakdown (undefined, %) by Region 2025 & 2033
- Figure 2: Global Compression Therapy Devices Volume Breakdown (K, %) by Region 2025 & 2033
- Figure 3: North America Compression Therapy Devices Revenue (undefined), by Application 2025 & 2033
- Figure 4: North America Compression Therapy Devices Volume (K), by Application 2025 & 2033
- Figure 5: North America Compression Therapy Devices Revenue Share (%), by Application 2025 & 2033
- Figure 6: North America Compression Therapy Devices Volume Share (%), by Application 2025 & 2033
- Figure 7: North America Compression Therapy Devices Revenue (undefined), by Types 2025 & 2033
- Figure 8: North America Compression Therapy Devices Volume (K), by Types 2025 & 2033
- Figure 9: North America Compression Therapy Devices Revenue Share (%), by Types 2025 & 2033
- Figure 10: North America Compression Therapy Devices Volume Share (%), by Types 2025 & 2033
- Figure 11: North America Compression Therapy Devices Revenue (undefined), by Country 2025 & 2033
- Figure 12: North America Compression Therapy Devices Volume (K), by Country 2025 & 2033
- Figure 13: North America Compression Therapy Devices Revenue Share (%), by Country 2025 & 2033
- Figure 14: North America Compression Therapy Devices Volume Share (%), by Country 2025 & 2033
- Figure 15: South America Compression Therapy Devices Revenue (undefined), by Application 2025 & 2033
- Figure 16: South America Compression Therapy Devices Volume (K), by Application 2025 & 2033
- Figure 17: South America Compression Therapy Devices Revenue Share (%), by Application 2025 & 2033
- Figure 18: South America Compression Therapy Devices Volume Share (%), by Application 2025 & 2033
- Figure 19: South America Compression Therapy Devices Revenue (undefined), by Types 2025 & 2033
- Figure 20: South America Compression Therapy Devices Volume (K), by Types 2025 & 2033
- Figure 21: South America Compression Therapy Devices Revenue Share (%), by Types 2025 & 2033
- Figure 22: South America Compression Therapy Devices Volume Share (%), by Types 2025 & 2033
- Figure 23: South America Compression Therapy Devices Revenue (undefined), by Country 2025 & 2033
- Figure 24: South America Compression Therapy Devices Volume (K), by Country 2025 & 2033
- Figure 25: South America Compression Therapy Devices Revenue Share (%), by Country 2025 & 2033
- Figure 26: South America Compression Therapy Devices Volume Share (%), by Country 2025 & 2033
- Figure 27: Europe Compression Therapy Devices Revenue (undefined), by Application 2025 & 2033
- Figure 28: Europe Compression Therapy Devices Volume (K), by Application 2025 & 2033
- Figure 29: Europe Compression Therapy Devices Revenue Share (%), by Application 2025 & 2033
- Figure 30: Europe Compression Therapy Devices Volume Share (%), by Application 2025 & 2033
- Figure 31: Europe Compression Therapy Devices Revenue (undefined), by Types 2025 & 2033
- Figure 32: Europe Compression Therapy Devices Volume (K), by Types 2025 & 2033
- Figure 33: Europe Compression Therapy Devices Revenue Share (%), by Types 2025 & 2033
- Figure 34: Europe Compression Therapy Devices Volume Share (%), by Types 2025 & 2033
- Figure 35: Europe Compression Therapy Devices Revenue (undefined), by Country 2025 & 2033
- Figure 36: Europe Compression Therapy Devices Volume (K), by Country 2025 & 2033
- Figure 37: Europe Compression Therapy Devices Revenue Share (%), by Country 2025 & 2033
- Figure 38: Europe Compression Therapy Devices Volume Share (%), by Country 2025 & 2033
- Figure 39: Middle East & Africa Compression Therapy Devices Revenue (undefined), by Application 2025 & 2033
- Figure 40: Middle East & Africa Compression Therapy Devices Volume (K), by Application 2025 & 2033
- Figure 41: Middle East & Africa Compression Therapy Devices Revenue Share (%), by Application 2025 & 2033
- Figure 42: Middle East & Africa Compression Therapy Devices Volume Share (%), by Application 2025 & 2033
- Figure 43: Middle East & Africa Compression Therapy Devices Revenue (undefined), by Types 2025 & 2033
- Figure 44: Middle East & Africa Compression Therapy Devices Volume (K), by Types 2025 & 2033
- Figure 45: Middle East & Africa Compression Therapy Devices Revenue Share (%), by Types 2025 & 2033
- Figure 46: Middle East & Africa Compression Therapy Devices Volume Share (%), by Types 2025 & 2033
- Figure 47: Middle East & Africa Compression Therapy Devices Revenue (undefined), by Country 2025 & 2033
- Figure 48: Middle East & Africa Compression Therapy Devices Volume (K), by Country 2025 & 2033
- Figure 49: Middle East & Africa Compression Therapy Devices Revenue Share (%), by Country 2025 & 2033
- Figure 50: Middle East & Africa Compression Therapy Devices Volume Share (%), by Country 2025 & 2033
- Figure 51: Asia Pacific Compression Therapy Devices Revenue (undefined), by Application 2025 & 2033
- Figure 52: Asia Pacific Compression Therapy Devices Volume (K), by Application 2025 & 2033
- Figure 53: Asia Pacific Compression Therapy Devices Revenue Share (%), by Application 2025 & 2033
- Figure 54: Asia Pacific Compression Therapy Devices Volume Share (%), by Application 2025 & 2033
- Figure 55: Asia Pacific Compression Therapy Devices Revenue (undefined), by Types 2025 & 2033
- Figure 56: Asia Pacific Compression Therapy Devices Volume (K), by Types 2025 & 2033
- Figure 57: Asia Pacific Compression Therapy Devices Revenue Share (%), by Types 2025 & 2033
- Figure 58: Asia Pacific Compression Therapy Devices Volume Share (%), by Types 2025 & 2033
- Figure 59: Asia Pacific Compression Therapy Devices Revenue (undefined), by Country 2025 & 2033
- Figure 60: Asia Pacific Compression Therapy Devices Volume (K), by Country 2025 & 2033
- Figure 61: Asia Pacific Compression Therapy Devices Revenue Share (%), by Country 2025 & 2033
- Figure 62: Asia Pacific Compression Therapy Devices Volume Share (%), by Country 2025 & 2033
List of Tables
- Table 1: Global Compression Therapy Devices Revenue undefined Forecast, by Application 2020 & 2033
- Table 2: Global Compression Therapy Devices Volume K Forecast, by Application 2020 & 2033
- Table 3: Global Compression Therapy Devices Revenue undefined Forecast, by Types 2020 & 2033
- Table 4: Global Compression Therapy Devices Volume K Forecast, by Types 2020 & 2033
- Table 5: Global Compression Therapy Devices Revenue undefined Forecast, by Region 2020 & 2033
- Table 6: Global Compression Therapy Devices Volume K Forecast, by Region 2020 & 2033
- Table 7: Global Compression Therapy Devices Revenue undefined Forecast, by Application 2020 & 2033
- Table 8: Global Compression Therapy Devices Volume K Forecast, by Application 2020 & 2033
- Table 9: Global Compression Therapy Devices Revenue undefined Forecast, by Types 2020 & 2033
- Table 10: Global Compression Therapy Devices Volume K Forecast, by Types 2020 & 2033
- Table 11: Global Compression Therapy Devices Revenue undefined Forecast, by Country 2020 & 2033
- Table 12: Global Compression Therapy Devices Volume K Forecast, by Country 2020 & 2033
- Table 13: United States Compression Therapy Devices Revenue (undefined) Forecast, by Application 2020 & 2033
- Table 14: United States Compression Therapy Devices Volume (K) Forecast, by Application 2020 & 2033
- Table 15: Canada Compression Therapy Devices Revenue (undefined) Forecast, by Application 2020 & 2033
- Table 16: Canada Compression Therapy Devices Volume (K) Forecast, by Application 2020 & 2033
- Table 17: Mexico Compression Therapy Devices Revenue (undefined) Forecast, by Application 2020 & 2033
- Table 18: Mexico Compression Therapy Devices Volume (K) Forecast, by Application 2020 & 2033
- Table 19: Global Compression Therapy Devices Revenue undefined Forecast, by Application 2020 & 2033
- Table 20: Global Compression Therapy Devices Volume K Forecast, by Application 2020 & 2033
- Table 21: Global Compression Therapy Devices Revenue undefined Forecast, by Types 2020 & 2033
- Table 22: Global Compression Therapy Devices Volume K Forecast, by Types 2020 & 2033
- Table 23: Global Compression Therapy Devices Revenue undefined Forecast, by Country 2020 & 2033
- Table 24: Global Compression Therapy Devices Volume K Forecast, by Country 2020 & 2033
- Table 25: Brazil Compression Therapy Devices Revenue (undefined) Forecast, by Application 2020 & 2033
- Table 26: Brazil Compression Therapy Devices Volume (K) Forecast, by Application 2020 & 2033
- Table 27: Argentina Compression Therapy Devices Revenue (undefined) Forecast, by Application 2020 & 2033
- Table 28: Argentina Compression Therapy Devices Volume (K) Forecast, by Application 2020 & 2033
- Table 29: Rest of South America Compression Therapy Devices Revenue (undefined) Forecast, by Application 2020 & 2033
- Table 30: Rest of South America Compression Therapy Devices Volume (K) Forecast, by Application 2020 & 2033
- Table 31: Global Compression Therapy Devices Revenue undefined Forecast, by Application 2020 & 2033
- Table 32: Global Compression Therapy Devices Volume K Forecast, by Application 2020 & 2033
- Table 33: Global Compression Therapy Devices Revenue undefined Forecast, by Types 2020 & 2033
- Table 34: Global Compression Therapy Devices Volume K Forecast, by Types 2020 & 2033
- Table 35: Global Compression Therapy Devices Revenue undefined Forecast, by Country 2020 & 2033
- Table 36: Global Compression Therapy Devices Volume K Forecast, by Country 2020 & 2033
- Table 37: United Kingdom Compression Therapy Devices Revenue (undefined) Forecast, by Application 2020 & 2033
- Table 38: United Kingdom Compression Therapy Devices Volume (K) Forecast, by Application 2020 & 2033
- Table 39: Germany Compression Therapy Devices Revenue (undefined) Forecast, by Application 2020 & 2033
- Table 40: Germany Compression Therapy Devices Volume (K) Forecast, by Application 2020 & 2033
- Table 41: France Compression Therapy Devices Revenue (undefined) Forecast, by Application 2020 & 2033
- Table 42: France Compression Therapy Devices Volume (K) Forecast, by Application 2020 & 2033
- Table 43: Italy Compression Therapy Devices Revenue (undefined) Forecast, by Application 2020 & 2033
- Table 44: Italy Compression Therapy Devices Volume (K) Forecast, by Application 2020 & 2033
- Table 45: Spain Compression Therapy Devices Revenue (undefined) Forecast, by Application 2020 & 2033
- Table 46: Spain Compression Therapy Devices Volume (K) Forecast, by Application 2020 & 2033
- Table 47: Russia Compression Therapy Devices Revenue (undefined) Forecast, by Application 2020 & 2033
- Table 48: Russia Compression Therapy Devices Volume (K) Forecast, by Application 2020 & 2033
- Table 49: Benelux Compression Therapy Devices Revenue (undefined) Forecast, by Application 2020 & 2033
- Table 50: Benelux Compression Therapy Devices Volume (K) Forecast, by Application 2020 & 2033
- Table 51: Nordics Compression Therapy Devices Revenue (undefined) Forecast, by Application 2020 & 2033
- Table 52: Nordics Compression Therapy Devices Volume (K) Forecast, by Application 2020 & 2033
- Table 53: Rest of Europe Compression Therapy Devices Revenue (undefined) Forecast, by Application 2020 & 2033
- Table 54: Rest of Europe Compression Therapy Devices Volume (K) Forecast, by Application 2020 & 2033
- Table 55: Global Compression Therapy Devices Revenue undefined Forecast, by Application 2020 & 2033
- Table 56: Global Compression Therapy Devices Volume K Forecast, by Application 2020 & 2033
- Table 57: Global Compression Therapy Devices Revenue undefined Forecast, by Types 2020 & 2033
- Table 58: Global Compression Therapy Devices Volume K Forecast, by Types 2020 & 2033
- Table 59: Global Compression Therapy Devices Revenue undefined Forecast, by Country 2020 & 2033
- Table 60: Global Compression Therapy Devices Volume K Forecast, by Country 2020 & 2033
- Table 61: Turkey Compression Therapy Devices Revenue (undefined) Forecast, by Application 2020 & 2033
- Table 62: Turkey Compression Therapy Devices Volume (K) Forecast, by Application 2020 & 2033
- Table 63: Israel Compression Therapy Devices Revenue (undefined) Forecast, by Application 2020 & 2033
- Table 64: Israel Compression Therapy Devices Volume (K) Forecast, by Application 2020 & 2033
- Table 65: GCC Compression Therapy Devices Revenue (undefined) Forecast, by Application 2020 & 2033
- Table 66: GCC Compression Therapy Devices Volume (K) Forecast, by Application 2020 & 2033
- Table 67: North Africa Compression Therapy Devices Revenue (undefined) Forecast, by Application 2020 & 2033
- Table 68: North Africa Compression Therapy Devices Volume (K) Forecast, by Application 2020 & 2033
- Table 69: South Africa Compression Therapy Devices Revenue (undefined) Forecast, by Application 2020 & 2033
- Table 70: South Africa Compression Therapy Devices Volume (K) Forecast, by Application 2020 & 2033
- Table 71: Rest of Middle East & Africa Compression Therapy Devices Revenue (undefined) Forecast, by Application 2020 & 2033
- Table 72: Rest of Middle East & Africa Compression Therapy Devices Volume (K) Forecast, by Application 2020 & 2033
- Table 73: Global Compression Therapy Devices Revenue undefined Forecast, by Application 2020 & 2033
- Table 74: Global Compression Therapy Devices Volume K Forecast, by Application 2020 & 2033
- Table 75: Global Compression Therapy Devices Revenue undefined Forecast, by Types 2020 & 2033
- Table 76: Global Compression Therapy Devices Volume K Forecast, by Types 2020 & 2033
- Table 77: Global Compression Therapy Devices Revenue undefined Forecast, by Country 2020 & 2033
- Table 78: Global Compression Therapy Devices Volume K Forecast, by Country 2020 & 2033
- Table 79: China Compression Therapy Devices Revenue (undefined) Forecast, by Application 2020 & 2033
- Table 80: China Compression Therapy Devices Volume (K) Forecast, by Application 2020 & 2033
- Table 81: India Compression Therapy Devices Revenue (undefined) Forecast, by Application 2020 & 2033
- Table 82: India Compression Therapy Devices Volume (K) Forecast, by Application 2020 & 2033
- Table 83: Japan Compression Therapy Devices Revenue (undefined) Forecast, by Application 2020 & 2033
- Table 84: Japan Compression Therapy Devices Volume (K) Forecast, by Application 2020 & 2033
- Table 85: South Korea Compression Therapy Devices Revenue (undefined) Forecast, by Application 2020 & 2033
- Table 86: South Korea Compression Therapy Devices Volume (K) Forecast, by Application 2020 & 2033
- Table 87: ASEAN Compression Therapy Devices Revenue (undefined) Forecast, by Application 2020 & 2033
- Table 88: ASEAN Compression Therapy Devices Volume (K) Forecast, by Application 2020 & 2033
- Table 89: Oceania Compression Therapy Devices Revenue (undefined) Forecast, by Application 2020 & 2033
- Table 90: Oceania Compression Therapy Devices Volume (K) Forecast, by Application 2020 & 2033
- Table 91: Rest of Asia Pacific Compression Therapy Devices Revenue (undefined) Forecast, by Application 2020 & 2033
- Table 92: Rest of Asia Pacific Compression Therapy Devices Volume (K) Forecast, by Application 2020 & 2033
Frequently Asked Questions
1. What is the projected Compound Annual Growth Rate (CAGR) of the Compression Therapy Devices?
The projected CAGR is approximately 3.2%.
2. Which companies are prominent players in the Compression Therapy Devices?
Key companies in the market include Medtronic, 3M, Smith & Nephew, Sigvaris, Hartmann Group, Medi, BSN medical, ArjoHuntleigh, Juzo, Gottfried Medical.
3. What are the main segments of the Compression Therapy Devices?
The market segments include Application, Types.
4. Can you provide details about the market size?
The market size is estimated to be USD XXX N/A as of 2022.
5. What are some drivers contributing to market growth?
N/A
6. What are the notable trends driving market growth?
N/A
7. Are there any restraints impacting market growth?
N/A
8. Can you provide examples of recent developments in the market?
N/A
9. What pricing options are available for accessing the report?
Pricing options include single-user, multi-user, and enterprise licenses priced at USD 3350.00, USD 5025.00, and USD 6700.00 respectively.
10. Is the market size provided in terms of value or volume?
The market size is provided in terms of value, measured in N/A and volume, measured in K.
11. Are there any specific market keywords associated with the report?
Yes, the market keyword associated with the report is "Compression Therapy Devices," which aids in identifying and referencing the specific market segment covered.
12. How do I determine which pricing option suits my needs best?
The pricing options vary based on user requirements and access needs. Individual users may opt for single-user licenses, while businesses requiring broader access may choose multi-user or enterprise licenses for cost-effective access to the report.
13. Are there any additional resources or data provided in the Compression Therapy Devices report?
While the report offers comprehensive insights, it's advisable to review the specific contents or supplementary materials provided to ascertain if additional resources or data are available.
14. How can I stay updated on further developments or reports in the Compression Therapy Devices?
To stay informed about further developments, trends, and reports in the Compression Therapy Devices, consider subscribing to industry newsletters, following relevant companies and organizations, or regularly checking reputable industry news sources and publications.
Methodology
Step 1 - Identification of Relevant Samples Size from Population Database


Step 2 - Approaches for Defining Global Market Size (Value, Volume* & Price*)

Note*: In applicable scenarios
Step 3 - Data Sources
Primary Research
- Web Analytics
- Survey Reports
- Research Institute
- Latest Research Reports
- Opinion Leaders
Secondary Research
- Annual Reports
- White Paper
- Latest Press Release
- Industry Association
- Paid Database
- Investor Presentations

Step 4 - Data Triangulation
Involves using different sources of information in order to increase the validity of a study
These sources are likely to be stakeholders in a program - participants, other researchers, program staff, other community members, and so on.
Then we put all data in single framework & apply various statistical tools to find out the dynamic on the market.
During the analysis stage, feedback from the stakeholder groups would be compared to determine areas of agreement as well as areas of divergence