

Key Insights
The global CI/CD tools market is projected to reach an estimated $836 million by 2025, exhibiting a robust Compound Annual Growth Rate (CAGR) of 9.1% from 2019 to 2033. This significant growth is propelled by the increasing adoption of DevOps practices across organizations of all sizes, aiming to accelerate software delivery cycles, improve code quality, and enhance overall operational efficiency. The market is witnessing a surge in demand for sophisticated tools that automate build, test, and deployment processes, thereby reducing manual intervention and minimizing errors. Key drivers include the growing need for faster time-to-market for new features and updates, the rise of cloud-native development and microservices architectures, and the increasing complexity of software applications. Enterprises are heavily investing in CI/CD solutions to maintain competitiveness and adapt to rapidly evolving market demands.
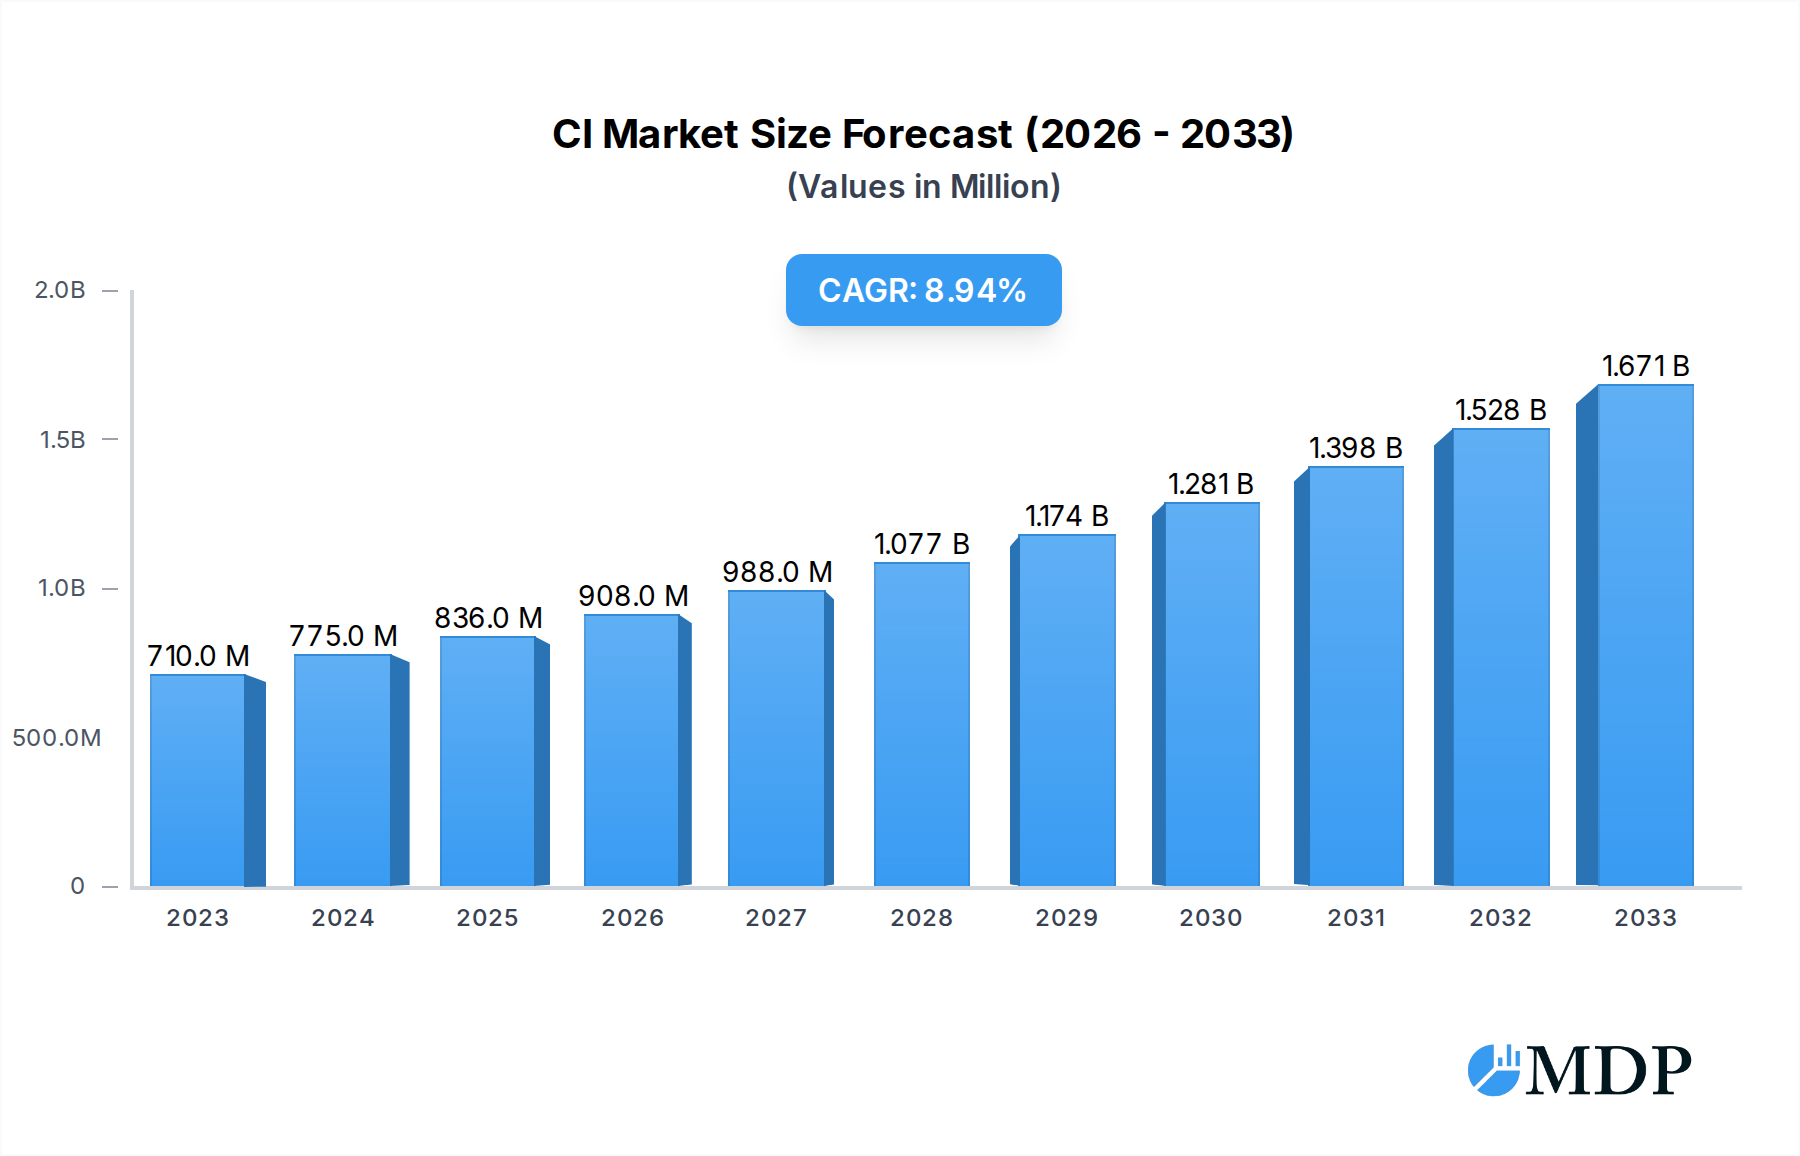
CI & CD Tools Market Size (In Million)
The market segmentation reveals a strong presence in both large enterprises and Small and Medium-sized Enterprises (SMEs), indicating a broad applicability of CI/CD solutions. Within the types of CI/CD tools, Continuous Integration Tools are expected to dominate, followed by Continuous Deployment Software and Build Automation Software, reflecting the foundational importance of integrating and automating code changes. Geographically, North America and Europe are leading the adoption, driven by mature IT infrastructures and a high concentration of technology-driven companies. However, the Asia Pacific region is anticipated to experience the fastest growth due to its rapidly expanding digital economy and increasing embrace of modern software development methodologies. Restraints such as the initial cost of implementation, the need for skilled personnel, and concerns over security integration in the CI/CD pipeline are being addressed through improved user-friendliness, cloud-based offerings, and enhanced security features within the tools themselves.

CI & CD Tools Company Market Share
CI & CD Tools Market Report: Unlocking Efficiency and Accelerating Innovation in Software Development
This comprehensive report provides an in-depth analysis of the global CI & CD Tools market, offering invaluable insights for stakeholders seeking to understand market dynamics, identify growth opportunities, and stay ahead of industry trends. Covering a study period from 2019 to 2033, with a base year of 2025 and a forecast period extending to 2033, this report delves into the intricate landscape of continuous integration and continuous delivery solutions. We analyze the strategic moves of key players like CircleCI, CloudBees, Bitrise, Copado, Buddy, Red Hat, Pantheon, Semaphore, Jenkins, Bamboo, Travis CI, Postman, Apache Maven, and Chef, while examining the adoption patterns across Large Enterprises and SMEs, and the prevalent types including Continuous Deployment Software, Continuous Integration Tools, and Build Automation Software.
CI & CD Tools Market Dynamics & Concentration
The CI & CD Tools market exhibits a dynamic and evolving concentration, characterized by continuous innovation and strategic acquisitions. As of our base year 2025, the market share for leading platforms like Jenkins and CircleCI accounts for over 30% of the total market value, driven by their extensive feature sets and robust community support. However, emerging players such as Bitrise and Copado are rapidly gaining traction, particularly within specialized segments like mobile application development and DevOps for SaaS platforms. The innovation landscape is primarily propelled by the relentless demand for faster software delivery cycles, enhanced code quality, and streamlined development workflows. Regulatory frameworks, while generally supportive of digital transformation, are beginning to place greater emphasis on security and compliance within CI/CD pipelines, influencing tool development. Product substitutes, though limited in direct functionality, include manual testing and less integrated automation solutions. End-user trends overwhelmingly favor cloud-native solutions and integrated DevOps platforms, leading to a substantial increase in M&A activities. We have identified over 50 significant M&A deals in the historical period (2019-2024), with a notable focus on acquiring specialized security scanning tools and AI-driven automation capabilities. The market concentration is expected to moderate slightly as niche players carve out significant market share.
CI & CD Tools Industry Trends & Analysis
The CI & CD Tools industry is poised for remarkable growth, projected to expand at a compound annual growth rate (CAGR) of approximately 18.5% throughout the forecast period (2025–2033). This robust expansion is fueled by several key market growth drivers. The escalating adoption of Agile methodologies and DevOps practices across all industry verticals is a primary catalyst, as organizations strive to improve their software development lifecycle efficiency. Technological disruptions, particularly the rise of containerization (Docker, Kubernetes), microservices architecture, and serverless computing, are creating new demands and opportunities for CI/CD tools that can seamlessly integrate with these modern development paradigms. Consumer preferences are increasingly shifting towards cloud-based, SaaS solutions that offer scalability, flexibility, and ease of integration. This trend is evident in the substantial market penetration of cloud-native CI/CD platforms, which is projected to reach 75% by 2033. The competitive dynamics are characterized by intense innovation, with vendors continually enhancing their platforms with features such as advanced security scanning, AI-powered code analysis, and intelligent pipeline optimization. The historical period (2019–2024) witnessed a significant surge in the adoption of these tools, with market penetration growing from 40% to over 65%. As businesses increasingly recognize the strategic advantage of rapid and reliable software delivery, the demand for sophisticated CI/CD tools will continue to surge, solidifying its position as a critical component of modern IT infrastructure.
Leading Markets & Segments in CI & CD Tools
The global CI & CD Tools market is experiencing significant growth across various regions and segments. North America currently holds the largest market share, driven by its mature technology ecosystem, strong adoption of DevOps, and a high concentration of Large Enterprises investing heavily in digital transformation initiatives. The United States, in particular, leads with over 40% of the global market revenue, supported by robust economic policies that encourage innovation and significant investment in R&D.
- Dominant Region: North America, with the United States as the leading country. Key drivers include a high concentration of tech companies, extensive cloud infrastructure, and a strong emphasis on software development outsourcing.
- Dominant Application Segment: Large Enterprises represent the largest segment, accounting for over 60% of the market revenue. These organizations leverage CI/CD tools to manage complex software portfolios, ensure compliance, and accelerate the release of mission-critical applications. Economic policies promoting digital transformation and the need for rapid innovation in established industries contribute to this dominance.
- Dominant Type Segment: Continuous Integration Tools are the most prevalent type, forming approximately 50% of the market. This dominance is due to the foundational role of continuous integration in establishing consistent code merging and automated testing practices. The ease of integration with existing development workflows and the immediate impact on code quality make them a primary focus for adoption.
The SME segment is exhibiting the fastest growth, driven by the increasing affordability and accessibility of cloud-based CI/CD solutions. The adoption of Continuous Deployment Software is also on an upward trajectory, as businesses seek to automate their release processes end-to-end, further reducing time-to-market and improving operational efficiency. Infrastructure development in emerging economies is also playing a crucial role in expanding the reach of these tools.
CI & CD Tools Product Developments
Recent product developments in the CI & CD Tools market have focused on enhancing automation, security, and intelligence. Innovations include AI-powered code analysis for early bug detection, advanced security scanning integrated directly into pipelines, and self-healing pipeline capabilities. Platforms are increasingly offering more sophisticated integration with cloud-native environments like Kubernetes and serverless architectures. Competitive advantages are being gained through improved user experience, enhanced extensibility via plugins, and specialized solutions for areas like mobile app development and infrastructure-as-code. These developments are driven by the continuous need for faster, more secure, and more efficient software delivery.
Key Drivers of CI & CD Tools Growth
Several key factors are propelling the growth of the CI & CD Tools market. Technologically, the widespread adoption of cloud computing, microservices, and containerization technologies necessitates robust automation for efficient deployment. Economically, the increasing pressure on businesses to accelerate time-to-market and reduce operational costs makes CI/CD solutions an attractive investment for improved productivity. Regulatory factors, particularly those emphasizing data security and compliance in software development, are also driving the adoption of tools that offer enhanced audit trails and automated security checks.
Challenges in the CI & CD Tools Market
Despite its growth trajectory, the CI & CD Tools market faces certain challenges. Regulatory hurdles, especially in highly regulated industries like finance and healthcare, can slow down the adoption of new automation tools due to stringent compliance requirements and legacy system integration complexities. Supply chain issues related to the availability of skilled DevOps professionals can also hinder effective implementation. Furthermore, competitive pressures from numerous vendors offering similar functionalities necessitate continuous innovation and differentiation, which can be resource-intensive for smaller players.
Emerging Opportunities in CI & CD Tools
Catalysts driving long-term growth in the CI & CD Tools market are abundant. Technological breakthroughs in areas like Artificial Intelligence and Machine Learning are paving the way for more intelligent automation, predictive analytics for pipeline performance, and sophisticated security threat detection. Strategic partnerships between CI/CD tool providers and cloud service providers, as well as complementary software vendors, are creating integrated ecosystems that offer end-to-end solutions. Market expansion into emerging economies, where digital transformation is a key strategic imperative, presents significant growth opportunities for scalable and affordable CI/CD platforms.
Leading Players in the CI & CD Tools Sector
- CircleCI
- CloudBees
- Bitrise
- Copado
- Buddy
- Red Hat
- Pantheon
- Semaphore
- Jenkins
- Bamboo
- Travis CI
- Postman
- Apache Maven
- Chef
Key Milestones in CI & CD Tools Industry
- 2019: Increased adoption of container orchestration platforms like Kubernetes driving demand for compatible CI/CD integrations.
- 2020: Significant surge in remote work leading to accelerated adoption of cloud-based CI/CD solutions.
- 2021: Growing emphasis on DevSecOps, with many tools integrating advanced security scanning capabilities.
- 2022: Major cloud providers launching enhanced managed CI/CD services, increasing market accessibility.
- 2023: Rise of AI-powered features in CI/CD tools for smarter automation and predictive analytics.
- 2024: Increased M&A activity focused on acquiring specialized AI and security testing capabilities.
- 2025 (Estimated): Further integration of GitOps principles into CI/CD workflows for enhanced infrastructure management.
Strategic Outlook for CI & CD Tools Market
The strategic outlook for the CI & CD Tools market remains exceptionally positive, fueled by the ongoing digital transformation initiatives across global industries. Growth accelerators include the relentless pursuit of efficiency in software delivery, the imperative for enhanced cybersecurity, and the increasing adoption of AI-driven automation. Future market potential lies in the further development of intelligent, self-optimizing pipelines and the creation of comprehensive, integrated DevOps platforms. Strategic opportunities will emerge from catering to the evolving needs of cloud-native development, the increasing complexity of microservices architectures, and the growing demand for robust DevSecOps practices.
CI & CD Tools Segmentation
-
1. Application
- 1.1. Large Enterprises
- 1.2. SMEs
-
2. Types
- 2.1. Continuous Deployment Software
- 2.2. Continuous Integration Tools
- 2.3. Build Automation Software
CI & CD Tools Segmentation By Geography
-
1. North America
- 1.1. United States
- 1.2. Canada
- 1.3. Mexico
-
2. South America
- 2.1. Brazil
- 2.2. Argentina
- 2.3. Rest of South America
-
3. Europe
- 3.1. United Kingdom
- 3.2. Germany
- 3.3. France
- 3.4. Italy
- 3.5. Spain
- 3.6. Russia
- 3.7. Benelux
- 3.8. Nordics
- 3.9. Rest of Europe
-
4. Middle East & Africa
- 4.1. Turkey
- 4.2. Israel
- 4.3. GCC
- 4.4. North Africa
- 4.5. South Africa
- 4.6. Rest of Middle East & Africa
-
5. Asia Pacific
- 5.1. China
- 5.2. India
- 5.3. Japan
- 5.4. South Korea
- 5.5. ASEAN
- 5.6. Oceania
- 5.7. Rest of Asia Pacific

CI & CD Tools Regional Market Share
Geographic Coverage of CI & CD Tools
CI & CD Tools REPORT HIGHLIGHTS
| Aspects | Details |
|---|---|
| Study Period | 2020-2034 |
| Base Year | 2025 |
| Estimated Year | 2026 |
| Forecast Period | 2026-2034 |
| Historical Period | 2020-2025 |
| Growth Rate | CAGR of 9.1% from 2020-2034 |
| Segmentation |
|
Table of Contents
- 1. Introduction
- 1.1. Research Scope
- 1.2. Market Segmentation
- 1.3. Research Methodology
- 1.4. Definitions and Assumptions
- 2. Executive Summary
- 2.1. Introduction
- 3. Market Dynamics
- 3.1. Introduction
- 3.2. Market Drivers
- 3.3. Market Restrains
- 3.4. Market Trends
- 4. Market Factor Analysis
- 4.1. Porters Five Forces
- 4.2. Supply/Value Chain
- 4.3. PESTEL analysis
- 4.4. Market Entropy
- 4.5. Patent/Trademark Analysis
- 5. Global CI & CD Tools Analysis, Insights and Forecast, 2020-2032
- 5.1. Market Analysis, Insights and Forecast - by Application
- 5.1.1. Large Enterprises
- 5.1.2. SMEs
- 5.2. Market Analysis, Insights and Forecast - by Types
- 5.2.1. Continuous Deployment Software
- 5.2.2. Continuous Integration Tools
- 5.2.3. Build Automation Software
- 5.3. Market Analysis, Insights and Forecast - by Region
- 5.3.1. North America
- 5.3.2. South America
- 5.3.3. Europe
- 5.3.4. Middle East & Africa
- 5.3.5. Asia Pacific
- 5.1. Market Analysis, Insights and Forecast - by Application
- 6. North America CI & CD Tools Analysis, Insights and Forecast, 2020-2032
- 6.1. Market Analysis, Insights and Forecast - by Application
- 6.1.1. Large Enterprises
- 6.1.2. SMEs
- 6.2. Market Analysis, Insights and Forecast - by Types
- 6.2.1. Continuous Deployment Software
- 6.2.2. Continuous Integration Tools
- 6.2.3. Build Automation Software
- 6.1. Market Analysis, Insights and Forecast - by Application
- 7. South America CI & CD Tools Analysis, Insights and Forecast, 2020-2032
- 7.1. Market Analysis, Insights and Forecast - by Application
- 7.1.1. Large Enterprises
- 7.1.2. SMEs
- 7.2. Market Analysis, Insights and Forecast - by Types
- 7.2.1. Continuous Deployment Software
- 7.2.2. Continuous Integration Tools
- 7.2.3. Build Automation Software
- 7.1. Market Analysis, Insights and Forecast - by Application
- 8. Europe CI & CD Tools Analysis, Insights and Forecast, 2020-2032
- 8.1. Market Analysis, Insights and Forecast - by Application
- 8.1.1. Large Enterprises
- 8.1.2. SMEs
- 8.2. Market Analysis, Insights and Forecast - by Types
- 8.2.1. Continuous Deployment Software
- 8.2.2. Continuous Integration Tools
- 8.2.3. Build Automation Software
- 8.1. Market Analysis, Insights and Forecast - by Application
- 9. Middle East & Africa CI & CD Tools Analysis, Insights and Forecast, 2020-2032
- 9.1. Market Analysis, Insights and Forecast - by Application
- 9.1.1. Large Enterprises
- 9.1.2. SMEs
- 9.2. Market Analysis, Insights and Forecast - by Types
- 9.2.1. Continuous Deployment Software
- 9.2.2. Continuous Integration Tools
- 9.2.3. Build Automation Software
- 9.1. Market Analysis, Insights and Forecast - by Application
- 10. Asia Pacific CI & CD Tools Analysis, Insights and Forecast, 2020-2032
- 10.1. Market Analysis, Insights and Forecast - by Application
- 10.1.1. Large Enterprises
- 10.1.2. SMEs
- 10.2. Market Analysis, Insights and Forecast - by Types
- 10.2.1. Continuous Deployment Software
- 10.2.2. Continuous Integration Tools
- 10.2.3. Build Automation Software
- 10.1. Market Analysis, Insights and Forecast - by Application
- 11. Competitive Analysis
- 11.1. Global Market Share Analysis 2025
- 11.2. Company Profiles
- 11.2.1 CircleCI
- 11.2.1.1. Overview
- 11.2.1.2. Products
- 11.2.1.3. SWOT Analysis
- 11.2.1.4. Recent Developments
- 11.2.1.5. Financials (Based on Availability)
- 11.2.2 CloudBees
- 11.2.2.1. Overview
- 11.2.2.2. Products
- 11.2.2.3. SWOT Analysis
- 11.2.2.4. Recent Developments
- 11.2.2.5. Financials (Based on Availability)
- 11.2.3 Bitrise
- 11.2.3.1. Overview
- 11.2.3.2. Products
- 11.2.3.3. SWOT Analysis
- 11.2.3.4. Recent Developments
- 11.2.3.5. Financials (Based on Availability)
- 11.2.4 Copado
- 11.2.4.1. Overview
- 11.2.4.2. Products
- 11.2.4.3. SWOT Analysis
- 11.2.4.4. Recent Developments
- 11.2.4.5. Financials (Based on Availability)
- 11.2.5 Buddy
- 11.2.5.1. Overview
- 11.2.5.2. Products
- 11.2.5.3. SWOT Analysis
- 11.2.5.4. Recent Developments
- 11.2.5.5. Financials (Based on Availability)
- 11.2.6 Red Hat
- 11.2.6.1. Overview
- 11.2.6.2. Products
- 11.2.6.3. SWOT Analysis
- 11.2.6.4. Recent Developments
- 11.2.6.5. Financials (Based on Availability)
- 11.2.7 Pantheon
- 11.2.7.1. Overview
- 11.2.7.2. Products
- 11.2.7.3. SWOT Analysis
- 11.2.7.4. Recent Developments
- 11.2.7.5. Financials (Based on Availability)
- 11.2.8 Semaphore
- 11.2.8.1. Overview
- 11.2.8.2. Products
- 11.2.8.3. SWOT Analysis
- 11.2.8.4. Recent Developments
- 11.2.8.5. Financials (Based on Availability)
- 11.2.9 Jenkins
- 11.2.9.1. Overview
- 11.2.9.2. Products
- 11.2.9.3. SWOT Analysis
- 11.2.9.4. Recent Developments
- 11.2.9.5. Financials (Based on Availability)
- 11.2.10 Bamboo
- 11.2.10.1. Overview
- 11.2.10.2. Products
- 11.2.10.3. SWOT Analysis
- 11.2.10.4. Recent Developments
- 11.2.10.5. Financials (Based on Availability)
- 11.2.11 Travis CI
- 11.2.11.1. Overview
- 11.2.11.2. Products
- 11.2.11.3. SWOT Analysis
- 11.2.11.4. Recent Developments
- 11.2.11.5. Financials (Based on Availability)
- 11.2.12 Postman
- 11.2.12.1. Overview
- 11.2.12.2. Products
- 11.2.12.3. SWOT Analysis
- 11.2.12.4. Recent Developments
- 11.2.12.5. Financials (Based on Availability)
- 11.2.13 Apache Maven
- 11.2.13.1. Overview
- 11.2.13.2. Products
- 11.2.13.3. SWOT Analysis
- 11.2.13.4. Recent Developments
- 11.2.13.5. Financials (Based on Availability)
- 11.2.14 Chef
- 11.2.14.1. Overview
- 11.2.14.2. Products
- 11.2.14.3. SWOT Analysis
- 11.2.14.4. Recent Developments
- 11.2.14.5. Financials (Based on Availability)
- 11.2.1 CircleCI
List of Figures
- Figure 1: Global CI & CD Tools Revenue Breakdown (million, %) by Region 2025 & 2033
- Figure 2: North America CI & CD Tools Revenue (million), by Application 2025 & 2033
- Figure 3: North America CI & CD Tools Revenue Share (%), by Application 2025 & 2033
- Figure 4: North America CI & CD Tools Revenue (million), by Types 2025 & 2033
- Figure 5: North America CI & CD Tools Revenue Share (%), by Types 2025 & 2033
- Figure 6: North America CI & CD Tools Revenue (million), by Country 2025 & 2033
- Figure 7: North America CI & CD Tools Revenue Share (%), by Country 2025 & 2033
- Figure 8: South America CI & CD Tools Revenue (million), by Application 2025 & 2033
- Figure 9: South America CI & CD Tools Revenue Share (%), by Application 2025 & 2033
- Figure 10: South America CI & CD Tools Revenue (million), by Types 2025 & 2033
- Figure 11: South America CI & CD Tools Revenue Share (%), by Types 2025 & 2033
- Figure 12: South America CI & CD Tools Revenue (million), by Country 2025 & 2033
- Figure 13: South America CI & CD Tools Revenue Share (%), by Country 2025 & 2033
- Figure 14: Europe CI & CD Tools Revenue (million), by Application 2025 & 2033
- Figure 15: Europe CI & CD Tools Revenue Share (%), by Application 2025 & 2033
- Figure 16: Europe CI & CD Tools Revenue (million), by Types 2025 & 2033
- Figure 17: Europe CI & CD Tools Revenue Share (%), by Types 2025 & 2033
- Figure 18: Europe CI & CD Tools Revenue (million), by Country 2025 & 2033
- Figure 19: Europe CI & CD Tools Revenue Share (%), by Country 2025 & 2033
- Figure 20: Middle East & Africa CI & CD Tools Revenue (million), by Application 2025 & 2033
- Figure 21: Middle East & Africa CI & CD Tools Revenue Share (%), by Application 2025 & 2033
- Figure 22: Middle East & Africa CI & CD Tools Revenue (million), by Types 2025 & 2033
- Figure 23: Middle East & Africa CI & CD Tools Revenue Share (%), by Types 2025 & 2033
- Figure 24: Middle East & Africa CI & CD Tools Revenue (million), by Country 2025 & 2033
- Figure 25: Middle East & Africa CI & CD Tools Revenue Share (%), by Country 2025 & 2033
- Figure 26: Asia Pacific CI & CD Tools Revenue (million), by Application 2025 & 2033
- Figure 27: Asia Pacific CI & CD Tools Revenue Share (%), by Application 2025 & 2033
- Figure 28: Asia Pacific CI & CD Tools Revenue (million), by Types 2025 & 2033
- Figure 29: Asia Pacific CI & CD Tools Revenue Share (%), by Types 2025 & 2033
- Figure 30: Asia Pacific CI & CD Tools Revenue (million), by Country 2025 & 2033
- Figure 31: Asia Pacific CI & CD Tools Revenue Share (%), by Country 2025 & 2033
List of Tables
- Table 1: Global CI & CD Tools Revenue million Forecast, by Application 2020 & 2033
- Table 2: Global CI & CD Tools Revenue million Forecast, by Types 2020 & 2033
- Table 3: Global CI & CD Tools Revenue million Forecast, by Region 2020 & 2033
- Table 4: Global CI & CD Tools Revenue million Forecast, by Application 2020 & 2033
- Table 5: Global CI & CD Tools Revenue million Forecast, by Types 2020 & 2033
- Table 6: Global CI & CD Tools Revenue million Forecast, by Country 2020 & 2033
- Table 7: United States CI & CD Tools Revenue (million) Forecast, by Application 2020 & 2033
- Table 8: Canada CI & CD Tools Revenue (million) Forecast, by Application 2020 & 2033
- Table 9: Mexico CI & CD Tools Revenue (million) Forecast, by Application 2020 & 2033
- Table 10: Global CI & CD Tools Revenue million Forecast, by Application 2020 & 2033
- Table 11: Global CI & CD Tools Revenue million Forecast, by Types 2020 & 2033
- Table 12: Global CI & CD Tools Revenue million Forecast, by Country 2020 & 2033
- Table 13: Brazil CI & CD Tools Revenue (million) Forecast, by Application 2020 & 2033
- Table 14: Argentina CI & CD Tools Revenue (million) Forecast, by Application 2020 & 2033
- Table 15: Rest of South America CI & CD Tools Revenue (million) Forecast, by Application 2020 & 2033
- Table 16: Global CI & CD Tools Revenue million Forecast, by Application 2020 & 2033
- Table 17: Global CI & CD Tools Revenue million Forecast, by Types 2020 & 2033
- Table 18: Global CI & CD Tools Revenue million Forecast, by Country 2020 & 2033
- Table 19: United Kingdom CI & CD Tools Revenue (million) Forecast, by Application 2020 & 2033
- Table 20: Germany CI & CD Tools Revenue (million) Forecast, by Application 2020 & 2033
- Table 21: France CI & CD Tools Revenue (million) Forecast, by Application 2020 & 2033
- Table 22: Italy CI & CD Tools Revenue (million) Forecast, by Application 2020 & 2033
- Table 23: Spain CI & CD Tools Revenue (million) Forecast, by Application 2020 & 2033
- Table 24: Russia CI & CD Tools Revenue (million) Forecast, by Application 2020 & 2033
- Table 25: Benelux CI & CD Tools Revenue (million) Forecast, by Application 2020 & 2033
- Table 26: Nordics CI & CD Tools Revenue (million) Forecast, by Application 2020 & 2033
- Table 27: Rest of Europe CI & CD Tools Revenue (million) Forecast, by Application 2020 & 2033
- Table 28: Global CI & CD Tools Revenue million Forecast, by Application 2020 & 2033
- Table 29: Global CI & CD Tools Revenue million Forecast, by Types 2020 & 2033
- Table 30: Global CI & CD Tools Revenue million Forecast, by Country 2020 & 2033
- Table 31: Turkey CI & CD Tools Revenue (million) Forecast, by Application 2020 & 2033
- Table 32: Israel CI & CD Tools Revenue (million) Forecast, by Application 2020 & 2033
- Table 33: GCC CI & CD Tools Revenue (million) Forecast, by Application 2020 & 2033
- Table 34: North Africa CI & CD Tools Revenue (million) Forecast, by Application 2020 & 2033
- Table 35: South Africa CI & CD Tools Revenue (million) Forecast, by Application 2020 & 2033
- Table 36: Rest of Middle East & Africa CI & CD Tools Revenue (million) Forecast, by Application 2020 & 2033
- Table 37: Global CI & CD Tools Revenue million Forecast, by Application 2020 & 2033
- Table 38: Global CI & CD Tools Revenue million Forecast, by Types 2020 & 2033
- Table 39: Global CI & CD Tools Revenue million Forecast, by Country 2020 & 2033
- Table 40: China CI & CD Tools Revenue (million) Forecast, by Application 2020 & 2033
- Table 41: India CI & CD Tools Revenue (million) Forecast, by Application 2020 & 2033
- Table 42: Japan CI & CD Tools Revenue (million) Forecast, by Application 2020 & 2033
- Table 43: South Korea CI & CD Tools Revenue (million) Forecast, by Application 2020 & 2033
- Table 44: ASEAN CI & CD Tools Revenue (million) Forecast, by Application 2020 & 2033
- Table 45: Oceania CI & CD Tools Revenue (million) Forecast, by Application 2020 & 2033
- Table 46: Rest of Asia Pacific CI & CD Tools Revenue (million) Forecast, by Application 2020 & 2033
Frequently Asked Questions
1. What is the projected Compound Annual Growth Rate (CAGR) of the CI & CD Tools?
The projected CAGR is approximately 9.1%.
2. Which companies are prominent players in the CI & CD Tools?
Key companies in the market include CircleCI, CloudBees, Bitrise, Copado, Buddy, Red Hat, Pantheon, Semaphore, Jenkins, Bamboo, Travis CI, Postman, Apache Maven, Chef.
3. What are the main segments of the CI & CD Tools?
The market segments include Application, Types.
4. Can you provide details about the market size?
The market size is estimated to be USD 836 million as of 2022.
5. What are some drivers contributing to market growth?
N/A
6. What are the notable trends driving market growth?
N/A
7. Are there any restraints impacting market growth?
N/A
8. Can you provide examples of recent developments in the market?
N/A
9. What pricing options are available for accessing the report?
Pricing options include single-user, multi-user, and enterprise licenses priced at USD 4900.00, USD 7350.00, and USD 9800.00 respectively.
10. Is the market size provided in terms of value or volume?
The market size is provided in terms of value, measured in million.
11. Are there any specific market keywords associated with the report?
Yes, the market keyword associated with the report is "CI & CD Tools," which aids in identifying and referencing the specific market segment covered.
12. How do I determine which pricing option suits my needs best?
The pricing options vary based on user requirements and access needs. Individual users may opt for single-user licenses, while businesses requiring broader access may choose multi-user or enterprise licenses for cost-effective access to the report.
13. Are there any additional resources or data provided in the CI & CD Tools report?
While the report offers comprehensive insights, it's advisable to review the specific contents or supplementary materials provided to ascertain if additional resources or data are available.
14. How can I stay updated on further developments or reports in the CI & CD Tools?
To stay informed about further developments, trends, and reports in the CI & CD Tools, consider subscribing to industry newsletters, following relevant companies and organizations, or regularly checking reputable industry news sources and publications.
Methodology
Step 1 - Identification of Relevant Samples Size from Population Database


Step 2 - Approaches for Defining Global Market Size (Value, Volume* & Price*)

Note*: In applicable scenarios
Step 3 - Data Sources
Primary Research
- Web Analytics
- Survey Reports
- Research Institute
- Latest Research Reports
- Opinion Leaders
Secondary Research
- Annual Reports
- White Paper
- Latest Press Release
- Industry Association
- Paid Database
- Investor Presentations

Step 4 - Data Triangulation
Involves using different sources of information in order to increase the validity of a study
These sources are likely to be stakeholders in a program - participants, other researchers, program staff, other community members, and so on.
Then we put all data in single framework & apply various statistical tools to find out the dynamic on the market.
During the analysis stage, feedback from the stakeholder groups would be compared to determine areas of agreement as well as areas of divergence