

Key Insights
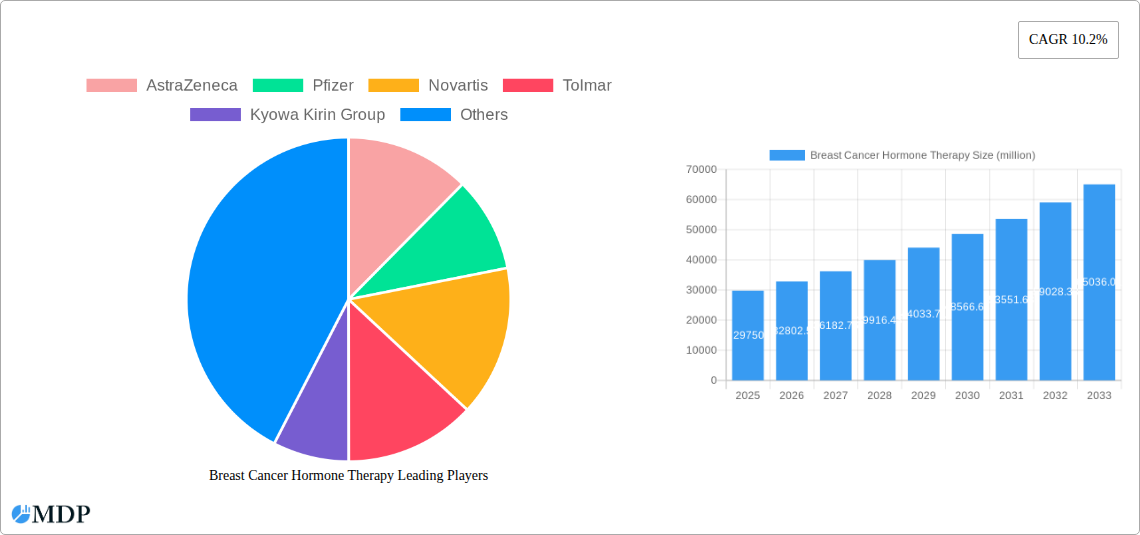
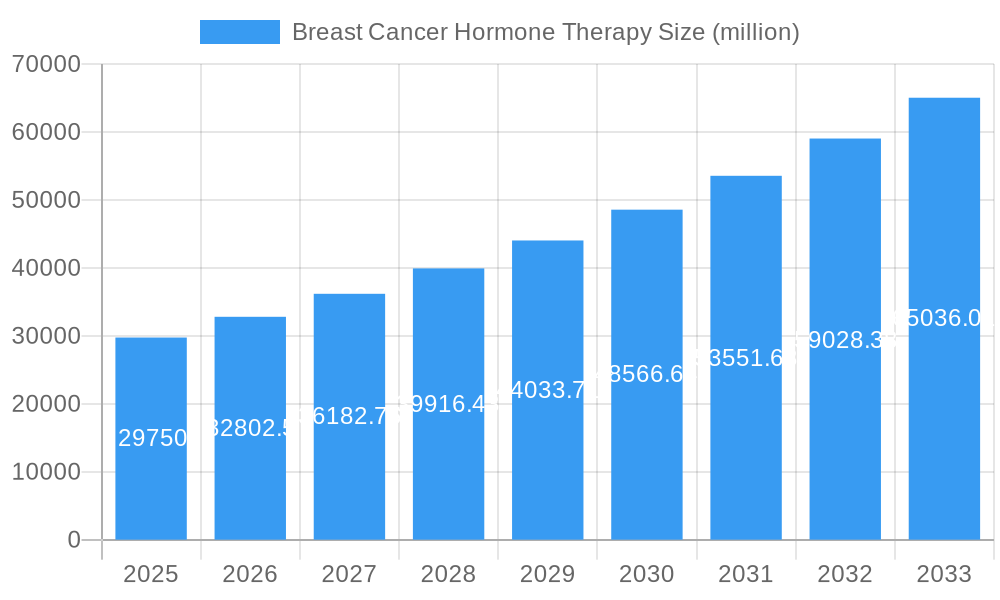
The global breast cancer hormone therapy market, valued at $29,750 million in 2025, is projected to experience robust growth, driven by a rising incidence of hormone-receptor-positive breast cancer, an expanding elderly population (a key demographic for hormone therapy), and continuous advancements in treatment approaches. The market's Compound Annual Growth Rate (CAGR) of 10.2% from 2025 to 2033 indicates significant potential for expansion. Key drivers include the increasing awareness of early detection and screening, leading to earlier diagnosis and treatment, coupled with the development of more targeted and effective hormonal therapies with improved side effect profiles. Furthermore, the growing adoption of personalized medicine, enabling tailored treatment regimens based on individual patient characteristics, contributes to market growth. However, the market faces certain restraints, including the potential for side effects associated with hormonal therapies, such as osteoporosis and cardiovascular issues, and the emergence of resistance to hormonal treatments over time.
Breast Cancer Hormone Therapy Market Size (In Billion)
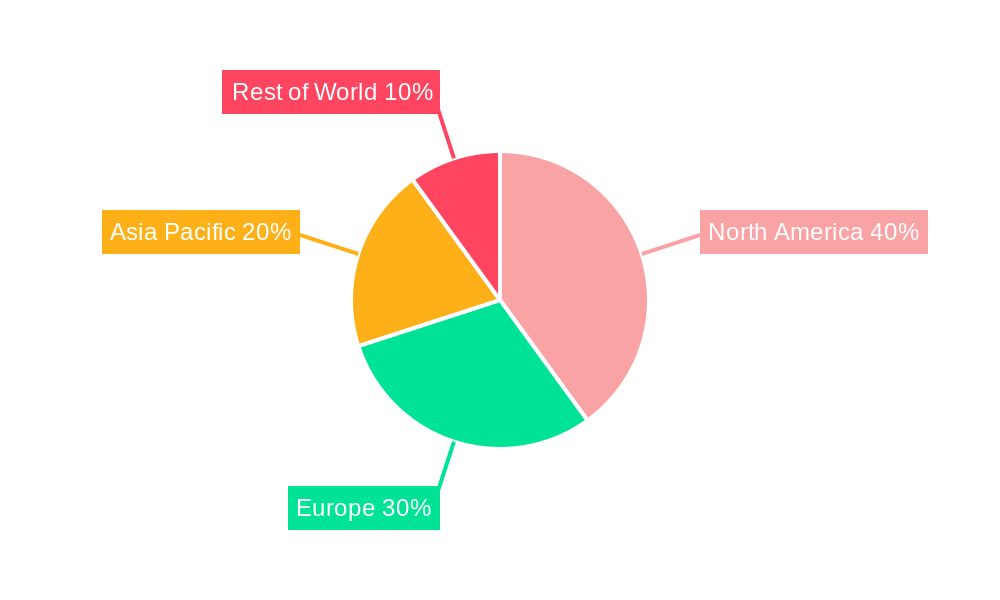
The competitive landscape is characterized by the presence of major pharmaceutical companies such as AstraZeneca, Pfizer, Novartis, and others actively involved in research and development, as well as the introduction of biosimilars and generics. This competitive environment fosters innovation, driving the development of new therapies and contributing to more accessible and affordable treatment options. Regional variations in market growth are expected, with developed markets like North America and Europe likely to contribute significantly, followed by a rising contribution from emerging economies in Asia and Latin America, driven by factors such as increasing healthcare expenditure and improved access to advanced medical treatments. The forecast period (2025-2033) promises sustained growth, fueled by ongoing technological advancements, increasing prevalence of breast cancer, and expanding access to healthcare in various regions globally.
Breast Cancer Hormone Therapy Company Market Share
Breast Cancer Hormone Therapy Market Report: 2019-2033
This comprehensive report provides a detailed analysis of the global breast cancer hormone therapy market, offering invaluable insights for stakeholders across the pharmaceutical and healthcare industries. The report covers the period from 2019 to 2033, with a focus on the 2025-2033 forecast period. We project a market valued at $XX million in 2025, demonstrating significant growth potential. This in-depth analysis incorporates data from the historical period (2019-2024) and considers the influence of key players like AstraZeneca, Pfizer, Novartis, and others. Download now to gain a competitive edge.
Breast Cancer Hormone Therapy Market Dynamics & Concentration
The global breast cancer hormone therapy market exhibits a moderately concentrated landscape, with a few major players holding significant market share. AstraZeneca, Pfizer, and Novartis collectively account for approximately XX% of the market in 2025. However, the presence of numerous smaller players, including Tolmar, Kyowa Kirin Group, Dr. Reddy's Laboratories, Natco Pharma, Teva, Mylan, Wockhardt, and Cipla, indicates a competitive environment.
- Market Concentration: The Herfindahl-Hirschman Index (HHI) is estimated at XX in 2025, suggesting a moderately concentrated market.
- Innovation Drivers: Ongoing research into novel hormone therapies, targeted drug delivery systems, and personalized medicine is fueling market growth. A significant number of patents are expiring, which leads to the launch of biosimilars.
- Regulatory Frameworks: Stringent regulatory approvals and post-market surveillance influence product launches and market entry.
- Product Substitutes: The availability of alternative treatment modalities (e.g., chemotherapy, targeted therapies) creates competitive pressure.
- End-User Trends: Increasing awareness of hormone therapy's benefits and risks, along with evolving treatment guidelines, shape market demand.
- M&A Activities: The past five years have witnessed XX M&A deals, primarily focused on expanding product portfolios and market access.
Breast Cancer Hormone Therapy Industry Trends & Analysis
The breast cancer hormone therapy market is experiencing robust growth, driven by several factors. The increasing prevalence of breast cancer globally, coupled with rising awareness and improved diagnosis rates, contributes significantly to market expansion. Technological advancements, such as the development of novel hormone therapies with enhanced efficacy and reduced side effects, are further stimulating growth. The market is projected to exhibit a CAGR of XX% during the forecast period (2025-2033), with market penetration expected to reach XX% by 2033. Competitive dynamics are influenced by pricing strategies, patent expirations, and the launch of biosimilars. Consumer preferences are shifting towards therapies with improved tolerability and personalized treatment approaches. Significant investments in research and development by leading pharmaceutical companies are shaping industry trends, pushing the boundaries of innovation in this field.
Leading Markets & Segments in Breast Cancer Hormone Therapy
North America currently dominates the global breast cancer hormone therapy market, accounting for approximately XX% of the market revenue in 2025. This dominance is primarily attributed to:
- High Prevalence of Breast Cancer: North America has a high incidence rate of breast cancer, creating a large target patient population.
- Robust Healthcare Infrastructure: The region boasts advanced healthcare infrastructure, facilitating effective diagnosis and treatment.
- High Healthcare Spending: Significant healthcare expenditure allows for widespread access to hormone therapies.
- Favorable Regulatory Environment: Regulatory frameworks support the timely approval and launch of innovative therapies.
Europe holds the second largest market share, followed by Asia-Pacific. Growth in emerging markets is expected to be driven by increasing healthcare awareness, rising disposable incomes, and expanding healthcare infrastructure.
Breast Cancer Hormone Therapy Product Developments
Recent product innovations focus on improving efficacy, reducing side effects, and tailoring treatments to individual patient needs. This includes the development of novel hormone receptor modulators, targeted delivery systems, and combination therapies. These advancements aim to enhance treatment outcomes and improve patients’ quality of life. The market is witnessing a surge in biosimilars, offering cost-effective alternatives to expensive branded therapies. These products are gaining traction, increasing market competition and affordability.
Key Drivers of Breast Cancer Hormone Therapy Growth
Several key factors are driving the growth of the breast cancer hormone therapy market. The escalating incidence of breast cancer globally is a primary driver. Technological advancements, such as the development of new hormone therapies and targeted drug delivery systems, are boosting market expansion. Favorable regulatory landscapes in several regions are expediting product approvals and market access. Furthermore, increasing healthcare spending and improved healthcare infrastructure, especially in developing economies, are contributing to market growth.
Challenges in the Breast Cancer Hormone Therapy Market
The market faces several challenges, including stringent regulatory hurdles for new product approvals, which can delay market entry and increase development costs. Supply chain disruptions can impact the availability and affordability of therapies. Furthermore, intense competition among established players and the emergence of biosimilars create pricing pressures, affecting profitability.
Emerging Opportunities in Breast Cancer Hormone Therapy
The long-term outlook for the breast cancer hormone therapy market is positive. Technological breakthroughs, such as the development of personalized medicine approaches and innovative drug delivery systems, present significant growth opportunities. Strategic partnerships and collaborations between pharmaceutical companies and research institutions are fostering innovation. Expansion into untapped markets in developing countries offers substantial growth potential.
Leading Players in the Breast Cancer Hormone Therapy Sector
- AstraZeneca
- Pfizer
- Novartis
- Tolmar
- Kyowa Kirin Group
- Dr. Reddy's Laboratories
- Natco Pharma
- Teva
- Mylan
- Wockhardt
- Cipla
Key Milestones in Breast Cancer Hormone Therapy Industry
- 2020: FDA approval of [New Drug Name] by [Company Name].
- 2021: Launch of [Biosimilar Name] by [Company Name].
- 2022: Publication of landmark clinical trial results demonstrating the efficacy of [New Therapy].
- 2023: Acquisition of [Company A] by [Company B].
- 2024: Approval of a new targeted therapy for hormone-receptor-positive breast cancer. (Further milestones can be added as data becomes available)
Strategic Outlook for Breast Cancer Hormone Therapy Market
The breast cancer hormone therapy market is poised for continued growth, driven by ongoing innovation in targeted therapies, personalized medicine, and improved drug delivery systems. Strategic partnerships, acquisitions, and market expansion initiatives will shape future market dynamics. Companies focusing on research and development of next-generation therapies, combined with effective marketing and distribution strategies, are well-positioned to capture significant market share in the coming years.
Breast Cancer Hormone Therapy Segmentation
-
1. Application
- 1.1. Hospital
- 1.2. Clinic
- 1.3. Others
-
2. Types
- 2.1. Aromatase Inhibitor
- 2.2. Selective Estrogen Receptor Modulator
- 2.3. Others
Breast Cancer Hormone Therapy Segmentation By Geography
-
1. North America
- 1.1. United States
- 1.2. Canada
- 1.3. Mexico
-
2. South America
- 2.1. Brazil
- 2.2. Argentina
- 2.3. Rest of South America
-
3. Europe
- 3.1. United Kingdom
- 3.2. Germany
- 3.3. France
- 3.4. Italy
- 3.5. Spain
- 3.6. Russia
- 3.7. Benelux
- 3.8. Nordics
- 3.9. Rest of Europe
-
4. Middle East & Africa
- 4.1. Turkey
- 4.2. Israel
- 4.3. GCC
- 4.4. North Africa
- 4.5. South Africa
- 4.6. Rest of Middle East & Africa
-
5. Asia Pacific
- 5.1. China
- 5.2. India
- 5.3. Japan
- 5.4. South Korea
- 5.5. ASEAN
- 5.6. Oceania
- 5.7. Rest of Asia Pacific
Breast Cancer Hormone Therapy Regional Market Share
Geographic Coverage of Breast Cancer Hormone Therapy
Breast Cancer Hormone Therapy REPORT HIGHLIGHTS
| Aspects | Details |
|---|---|
| Study Period | 2020-2034 |
| Base Year | 2025 |
| Estimated Year | 2026 |
| Forecast Period | 2026-2034 |
| Historical Period | 2020-2025 |
| Growth Rate | CAGR of 9.91% from 2020-2034 |
| Segmentation |
|
Table of Contents
- 1. Introduction
- 1.1. Research Scope
- 1.2. Market Segmentation
- 1.3. Research Methodology
- 1.4. Definitions and Assumptions
- 2. Executive Summary
- 2.1. Introduction
- 3. Market Dynamics
- 3.1. Introduction
- 3.2. Market Drivers
- 3.3. Market Restrains
- 3.4. Market Trends
- 4. Market Factor Analysis
- 4.1. Porters Five Forces
- 4.2. Supply/Value Chain
- 4.3. PESTEL analysis
- 4.4. Market Entropy
- 4.5. Patent/Trademark Analysis
- 5. Global Breast Cancer Hormone Therapy Analysis, Insights and Forecast, 2020-2032
- 5.1. Market Analysis, Insights and Forecast - by Application
- 5.1.1. Hospital
- 5.1.2. Clinic
- 5.1.3. Others
- 5.2. Market Analysis, Insights and Forecast - by Types
- 5.2.1. Aromatase Inhibitor
- 5.2.2. Selective Estrogen Receptor Modulator
- 5.2.3. Others
- 5.3. Market Analysis, Insights and Forecast - by Region
- 5.3.1. North America
- 5.3.2. South America
- 5.3.3. Europe
- 5.3.4. Middle East & Africa
- 5.3.5. Asia Pacific
- 5.1. Market Analysis, Insights and Forecast - by Application
- 6. North America Breast Cancer Hormone Therapy Analysis, Insights and Forecast, 2020-2032
- 6.1. Market Analysis, Insights and Forecast - by Application
- 6.1.1. Hospital
- 6.1.2. Clinic
- 6.1.3. Others
- 6.2. Market Analysis, Insights and Forecast - by Types
- 6.2.1. Aromatase Inhibitor
- 6.2.2. Selective Estrogen Receptor Modulator
- 6.2.3. Others
- 6.1. Market Analysis, Insights and Forecast - by Application
- 7. South America Breast Cancer Hormone Therapy Analysis, Insights and Forecast, 2020-2032
- 7.1. Market Analysis, Insights and Forecast - by Application
- 7.1.1. Hospital
- 7.1.2. Clinic
- 7.1.3. Others
- 7.2. Market Analysis, Insights and Forecast - by Types
- 7.2.1. Aromatase Inhibitor
- 7.2.2. Selective Estrogen Receptor Modulator
- 7.2.3. Others
- 7.1. Market Analysis, Insights and Forecast - by Application
- 8. Europe Breast Cancer Hormone Therapy Analysis, Insights and Forecast, 2020-2032
- 8.1. Market Analysis, Insights and Forecast - by Application
- 8.1.1. Hospital
- 8.1.2. Clinic
- 8.1.3. Others
- 8.2. Market Analysis, Insights and Forecast - by Types
- 8.2.1. Aromatase Inhibitor
- 8.2.2. Selective Estrogen Receptor Modulator
- 8.2.3. Others
- 8.1. Market Analysis, Insights and Forecast - by Application
- 9. Middle East & Africa Breast Cancer Hormone Therapy Analysis, Insights and Forecast, 2020-2032
- 9.1. Market Analysis, Insights and Forecast - by Application
- 9.1.1. Hospital
- 9.1.2. Clinic
- 9.1.3. Others
- 9.2. Market Analysis, Insights and Forecast - by Types
- 9.2.1. Aromatase Inhibitor
- 9.2.2. Selective Estrogen Receptor Modulator
- 9.2.3. Others
- 9.1. Market Analysis, Insights and Forecast - by Application
- 10. Asia Pacific Breast Cancer Hormone Therapy Analysis, Insights and Forecast, 2020-2032
- 10.1. Market Analysis, Insights and Forecast - by Application
- 10.1.1. Hospital
- 10.1.2. Clinic
- 10.1.3. Others
- 10.2. Market Analysis, Insights and Forecast - by Types
- 10.2.1. Aromatase Inhibitor
- 10.2.2. Selective Estrogen Receptor Modulator
- 10.2.3. Others
- 10.1. Market Analysis, Insights and Forecast - by Application
- 11. Competitive Analysis
- 11.1. Global Market Share Analysis 2025
- 11.2. Company Profiles
- 11.2.1 AstraZeneca
- 11.2.1.1. Overview
- 11.2.1.2. Products
- 11.2.1.3. SWOT Analysis
- 11.2.1.4. Recent Developments
- 11.2.1.5. Financials (Based on Availability)
- 11.2.2 Pfizer
- 11.2.2.1. Overview
- 11.2.2.2. Products
- 11.2.2.3. SWOT Analysis
- 11.2.2.4. Recent Developments
- 11.2.2.5. Financials (Based on Availability)
- 11.2.3 Novartis
- 11.2.3.1. Overview
- 11.2.3.2. Products
- 11.2.3.3. SWOT Analysis
- 11.2.3.4. Recent Developments
- 11.2.3.5. Financials (Based on Availability)
- 11.2.4 Tolmar
- 11.2.4.1. Overview
- 11.2.4.2. Products
- 11.2.4.3. SWOT Analysis
- 11.2.4.4. Recent Developments
- 11.2.4.5. Financials (Based on Availability)
- 11.2.5 Kyowa Kirin Group
- 11.2.5.1. Overview
- 11.2.5.2. Products
- 11.2.5.3. SWOT Analysis
- 11.2.5.4. Recent Developments
- 11.2.5.5. Financials (Based on Availability)
- 11.2.6 Dr. Reddy's Laboratories
- 11.2.6.1. Overview
- 11.2.6.2. Products
- 11.2.6.3. SWOT Analysis
- 11.2.6.4. Recent Developments
- 11.2.6.5. Financials (Based on Availability)
- 11.2.7 Natco Pharma
- 11.2.7.1. Overview
- 11.2.7.2. Products
- 11.2.7.3. SWOT Analysis
- 11.2.7.4. Recent Developments
- 11.2.7.5. Financials (Based on Availability)
- 11.2.8 Teva
- 11.2.8.1. Overview
- 11.2.8.2. Products
- 11.2.8.3. SWOT Analysis
- 11.2.8.4. Recent Developments
- 11.2.8.5. Financials (Based on Availability)
- 11.2.9 Mylan
- 11.2.9.1. Overview
- 11.2.9.2. Products
- 11.2.9.3. SWOT Analysis
- 11.2.9.4. Recent Developments
- 11.2.9.5. Financials (Based on Availability)
- 11.2.10 Wockhardt
- 11.2.10.1. Overview
- 11.2.10.2. Products
- 11.2.10.3. SWOT Analysis
- 11.2.10.4. Recent Developments
- 11.2.10.5. Financials (Based on Availability)
- 11.2.11 Cipla
- 11.2.11.1. Overview
- 11.2.11.2. Products
- 11.2.11.3. SWOT Analysis
- 11.2.11.4. Recent Developments
- 11.2.11.5. Financials (Based on Availability)
- 11.2.1 AstraZeneca
List of Figures
- Figure 1: Global Breast Cancer Hormone Therapy Revenue Breakdown (undefined, %) by Region 2025 & 2033
- Figure 2: North America Breast Cancer Hormone Therapy Revenue (undefined), by Application 2025 & 2033
- Figure 3: North America Breast Cancer Hormone Therapy Revenue Share (%), by Application 2025 & 2033
- Figure 4: North America Breast Cancer Hormone Therapy Revenue (undefined), by Types 2025 & 2033
- Figure 5: North America Breast Cancer Hormone Therapy Revenue Share (%), by Types 2025 & 2033
- Figure 6: North America Breast Cancer Hormone Therapy Revenue (undefined), by Country 2025 & 2033
- Figure 7: North America Breast Cancer Hormone Therapy Revenue Share (%), by Country 2025 & 2033
- Figure 8: South America Breast Cancer Hormone Therapy Revenue (undefined), by Application 2025 & 2033
- Figure 9: South America Breast Cancer Hormone Therapy Revenue Share (%), by Application 2025 & 2033
- Figure 10: South America Breast Cancer Hormone Therapy Revenue (undefined), by Types 2025 & 2033
- Figure 11: South America Breast Cancer Hormone Therapy Revenue Share (%), by Types 2025 & 2033
- Figure 12: South America Breast Cancer Hormone Therapy Revenue (undefined), by Country 2025 & 2033
- Figure 13: South America Breast Cancer Hormone Therapy Revenue Share (%), by Country 2025 & 2033
- Figure 14: Europe Breast Cancer Hormone Therapy Revenue (undefined), by Application 2025 & 2033
- Figure 15: Europe Breast Cancer Hormone Therapy Revenue Share (%), by Application 2025 & 2033
- Figure 16: Europe Breast Cancer Hormone Therapy Revenue (undefined), by Types 2025 & 2033
- Figure 17: Europe Breast Cancer Hormone Therapy Revenue Share (%), by Types 2025 & 2033
- Figure 18: Europe Breast Cancer Hormone Therapy Revenue (undefined), by Country 2025 & 2033
- Figure 19: Europe Breast Cancer Hormone Therapy Revenue Share (%), by Country 2025 & 2033
- Figure 20: Middle East & Africa Breast Cancer Hormone Therapy Revenue (undefined), by Application 2025 & 2033
- Figure 21: Middle East & Africa Breast Cancer Hormone Therapy Revenue Share (%), by Application 2025 & 2033
- Figure 22: Middle East & Africa Breast Cancer Hormone Therapy Revenue (undefined), by Types 2025 & 2033
- Figure 23: Middle East & Africa Breast Cancer Hormone Therapy Revenue Share (%), by Types 2025 & 2033
- Figure 24: Middle East & Africa Breast Cancer Hormone Therapy Revenue (undefined), by Country 2025 & 2033
- Figure 25: Middle East & Africa Breast Cancer Hormone Therapy Revenue Share (%), by Country 2025 & 2033
- Figure 26: Asia Pacific Breast Cancer Hormone Therapy Revenue (undefined), by Application 2025 & 2033
- Figure 27: Asia Pacific Breast Cancer Hormone Therapy Revenue Share (%), by Application 2025 & 2033
- Figure 28: Asia Pacific Breast Cancer Hormone Therapy Revenue (undefined), by Types 2025 & 2033
- Figure 29: Asia Pacific Breast Cancer Hormone Therapy Revenue Share (%), by Types 2025 & 2033
- Figure 30: Asia Pacific Breast Cancer Hormone Therapy Revenue (undefined), by Country 2025 & 2033
- Figure 31: Asia Pacific Breast Cancer Hormone Therapy Revenue Share (%), by Country 2025 & 2033
List of Tables
- Table 1: Global Breast Cancer Hormone Therapy Revenue undefined Forecast, by Application 2020 & 2033
- Table 2: Global Breast Cancer Hormone Therapy Revenue undefined Forecast, by Types 2020 & 2033
- Table 3: Global Breast Cancer Hormone Therapy Revenue undefined Forecast, by Region 2020 & 2033
- Table 4: Global Breast Cancer Hormone Therapy Revenue undefined Forecast, by Application 2020 & 2033
- Table 5: Global Breast Cancer Hormone Therapy Revenue undefined Forecast, by Types 2020 & 2033
- Table 6: Global Breast Cancer Hormone Therapy Revenue undefined Forecast, by Country 2020 & 2033
- Table 7: United States Breast Cancer Hormone Therapy Revenue (undefined) Forecast, by Application 2020 & 2033
- Table 8: Canada Breast Cancer Hormone Therapy Revenue (undefined) Forecast, by Application 2020 & 2033
- Table 9: Mexico Breast Cancer Hormone Therapy Revenue (undefined) Forecast, by Application 2020 & 2033
- Table 10: Global Breast Cancer Hormone Therapy Revenue undefined Forecast, by Application 2020 & 2033
- Table 11: Global Breast Cancer Hormone Therapy Revenue undefined Forecast, by Types 2020 & 2033
- Table 12: Global Breast Cancer Hormone Therapy Revenue undefined Forecast, by Country 2020 & 2033
- Table 13: Brazil Breast Cancer Hormone Therapy Revenue (undefined) Forecast, by Application 2020 & 2033
- Table 14: Argentina Breast Cancer Hormone Therapy Revenue (undefined) Forecast, by Application 2020 & 2033
- Table 15: Rest of South America Breast Cancer Hormone Therapy Revenue (undefined) Forecast, by Application 2020 & 2033
- Table 16: Global Breast Cancer Hormone Therapy Revenue undefined Forecast, by Application 2020 & 2033
- Table 17: Global Breast Cancer Hormone Therapy Revenue undefined Forecast, by Types 2020 & 2033
- Table 18: Global Breast Cancer Hormone Therapy Revenue undefined Forecast, by Country 2020 & 2033
- Table 19: United Kingdom Breast Cancer Hormone Therapy Revenue (undefined) Forecast, by Application 2020 & 2033
- Table 20: Germany Breast Cancer Hormone Therapy Revenue (undefined) Forecast, by Application 2020 & 2033
- Table 21: France Breast Cancer Hormone Therapy Revenue (undefined) Forecast, by Application 2020 & 2033
- Table 22: Italy Breast Cancer Hormone Therapy Revenue (undefined) Forecast, by Application 2020 & 2033
- Table 23: Spain Breast Cancer Hormone Therapy Revenue (undefined) Forecast, by Application 2020 & 2033
- Table 24: Russia Breast Cancer Hormone Therapy Revenue (undefined) Forecast, by Application 2020 & 2033
- Table 25: Benelux Breast Cancer Hormone Therapy Revenue (undefined) Forecast, by Application 2020 & 2033
- Table 26: Nordics Breast Cancer Hormone Therapy Revenue (undefined) Forecast, by Application 2020 & 2033
- Table 27: Rest of Europe Breast Cancer Hormone Therapy Revenue (undefined) Forecast, by Application 2020 & 2033
- Table 28: Global Breast Cancer Hormone Therapy Revenue undefined Forecast, by Application 2020 & 2033
- Table 29: Global Breast Cancer Hormone Therapy Revenue undefined Forecast, by Types 2020 & 2033
- Table 30: Global Breast Cancer Hormone Therapy Revenue undefined Forecast, by Country 2020 & 2033
- Table 31: Turkey Breast Cancer Hormone Therapy Revenue (undefined) Forecast, by Application 2020 & 2033
- Table 32: Israel Breast Cancer Hormone Therapy Revenue (undefined) Forecast, by Application 2020 & 2033
- Table 33: GCC Breast Cancer Hormone Therapy Revenue (undefined) Forecast, by Application 2020 & 2033
- Table 34: North Africa Breast Cancer Hormone Therapy Revenue (undefined) Forecast, by Application 2020 & 2033
- Table 35: South Africa Breast Cancer Hormone Therapy Revenue (undefined) Forecast, by Application 2020 & 2033
- Table 36: Rest of Middle East & Africa Breast Cancer Hormone Therapy Revenue (undefined) Forecast, by Application 2020 & 2033
- Table 37: Global Breast Cancer Hormone Therapy Revenue undefined Forecast, by Application 2020 & 2033
- Table 38: Global Breast Cancer Hormone Therapy Revenue undefined Forecast, by Types 2020 & 2033
- Table 39: Global Breast Cancer Hormone Therapy Revenue undefined Forecast, by Country 2020 & 2033
- Table 40: China Breast Cancer Hormone Therapy Revenue (undefined) Forecast, by Application 2020 & 2033
- Table 41: India Breast Cancer Hormone Therapy Revenue (undefined) Forecast, by Application 2020 & 2033
- Table 42: Japan Breast Cancer Hormone Therapy Revenue (undefined) Forecast, by Application 2020 & 2033
- Table 43: South Korea Breast Cancer Hormone Therapy Revenue (undefined) Forecast, by Application 2020 & 2033
- Table 44: ASEAN Breast Cancer Hormone Therapy Revenue (undefined) Forecast, by Application 2020 & 2033
- Table 45: Oceania Breast Cancer Hormone Therapy Revenue (undefined) Forecast, by Application 2020 & 2033
- Table 46: Rest of Asia Pacific Breast Cancer Hormone Therapy Revenue (undefined) Forecast, by Application 2020 & 2033
Frequently Asked Questions
1. What is the projected Compound Annual Growth Rate (CAGR) of the Breast Cancer Hormone Therapy?
The projected CAGR is approximately 9.91%.
2. Which companies are prominent players in the Breast Cancer Hormone Therapy?
Key companies in the market include AstraZeneca, Pfizer, Novartis, Tolmar, Kyowa Kirin Group, Dr. Reddy's Laboratories, Natco Pharma, Teva, Mylan, Wockhardt, Cipla.
3. What are the main segments of the Breast Cancer Hormone Therapy?
The market segments include Application, Types.
4. Can you provide details about the market size?
The market size is estimated to be USD XXX N/A as of 2022.
5. What are some drivers contributing to market growth?
N/A
6. What are the notable trends driving market growth?
N/A
7. Are there any restraints impacting market growth?
N/A
8. Can you provide examples of recent developments in the market?
N/A
9. What pricing options are available for accessing the report?
Pricing options include single-user, multi-user, and enterprise licenses priced at USD 4900.00, USD 7350.00, and USD 9800.00 respectively.
10. Is the market size provided in terms of value or volume?
The market size is provided in terms of value, measured in N/A.
11. Are there any specific market keywords associated with the report?
Yes, the market keyword associated with the report is "Breast Cancer Hormone Therapy," which aids in identifying and referencing the specific market segment covered.
12. How do I determine which pricing option suits my needs best?
The pricing options vary based on user requirements and access needs. Individual users may opt for single-user licenses, while businesses requiring broader access may choose multi-user or enterprise licenses for cost-effective access to the report.
13. Are there any additional resources or data provided in the Breast Cancer Hormone Therapy report?
While the report offers comprehensive insights, it's advisable to review the specific contents or supplementary materials provided to ascertain if additional resources or data are available.
14. How can I stay updated on further developments or reports in the Breast Cancer Hormone Therapy?
To stay informed about further developments, trends, and reports in the Breast Cancer Hormone Therapy, consider subscribing to industry newsletters, following relevant companies and organizations, or regularly checking reputable industry news sources and publications.
Methodology
Step 1 - Identification of Relevant Samples Size from Population Database


Step 2 - Approaches for Defining Global Market Size (Value, Volume* & Price*)

Note*: In applicable scenarios
Step 3 - Data Sources
Primary Research
- Web Analytics
- Survey Reports
- Research Institute
- Latest Research Reports
- Opinion Leaders
Secondary Research
- Annual Reports
- White Paper
- Latest Press Release
- Industry Association
- Paid Database
- Investor Presentations

Step 4 - Data Triangulation
Involves using different sources of information in order to increase the validity of a study
These sources are likely to be stakeholders in a program - participants, other researchers, program staff, other community members, and so on.
Then we put all data in single framework & apply various statistical tools to find out the dynamic on the market.
During the analysis stage, feedback from the stakeholder groups would be compared to determine areas of agreement as well as areas of divergence