

Key Insights
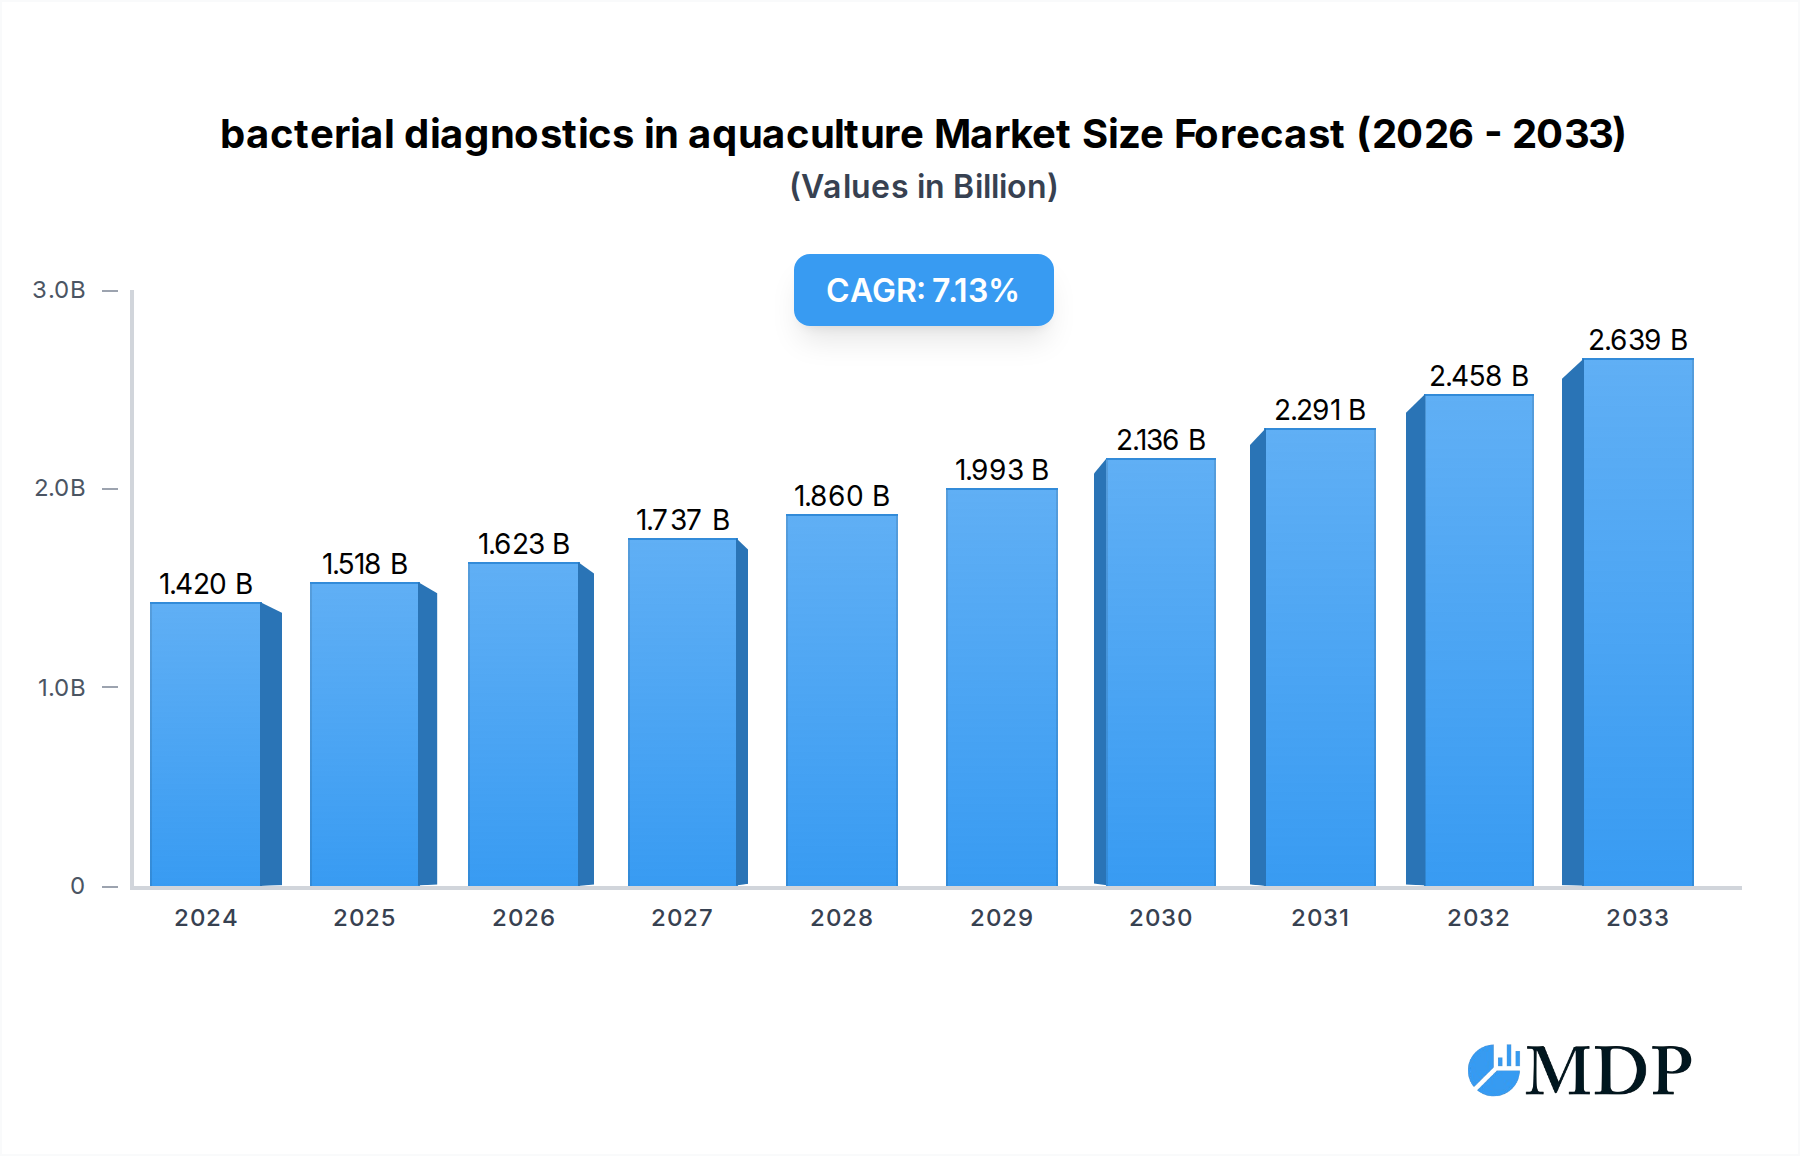
The global market for bacterial diagnostics in aquaculture is poised for significant expansion, reaching an estimated $1.42 billion in 2024 and projected to grow at a robust CAGR of 6.8% through 2033. This growth is fueled by an increasing global demand for seafood, necessitating enhanced disease prevention and management strategies to ensure sustainable aquaculture production. The rising prevalence of bacterial infections in farmed aquatic species, coupled with growing awareness among aquaculture farmers about the economic losses incurred due to these diseases, are primary drivers. Furthermore, advancements in diagnostic technologies, offering faster, more accurate, and cost-effective detection of pathogens, are playing a crucial role in market expansion. The market encompasses diverse applications, including general and specialized aquaculture, highlighting the broad utility of these diagnostic solutions across various farming systems.

bacterial diagnostics in aquaculture Market Size (In Billion)
Key market segments are driven by innovative diagnostic techniques such as Molecular Diagnostics, Immunofluorescent Antibody Tests, and Polymerase Chain Reaction, which offer superior sensitivity and specificity compared to traditional methods. The "Others" category likely includes emerging technologies and less common diagnostic approaches. While the market shows strong growth potential, certain restraints exist, such as the initial high cost of advanced diagnostic equipment, limited technical expertise in some developing regions, and the need for standardized diagnostic protocols. However, these challenges are being addressed through technological innovation and increasing government support for aquaculture health management. Leading companies in the sector, including Thermo Fisher Scientific and LexaGene, are actively investing in research and development to introduce novel solutions, further stimulating market dynamics.
bacterial diagnostics in aquaculture Company Market Share
bacterial diagnostics in aquaculture: Comprehensive Market Analysis and Growth Forecast (2019-2033)
This in-depth report provides a comprehensive analysis of the global bacterial diagnostics in aquaculture market. Delving into market dynamics, technological advancements, leading players, and future opportunities, this report is an essential resource for stakeholders seeking to understand and capitalize on the evolving landscape of fish and shellfish disease detection. With a study period spanning from 2019 to 2033, and a base year of 2025, this report offers critical insights for strategic planning and investment decisions. The market is projected to reach trillions in value, driven by increasing demand for sustainable seafood and stringent disease control measures.
bacterial diagnostics in aquaculture Market Dynamics & Concentration
The global bacterial diagnostics in aquaculture market exhibits a moderate to high concentration, with key players like Thermo Fisher Scientific, LexaGene, and Aquatic Diagnostics holding significant market share. Innovation serves as a primary driver, with continuous development of faster, more accurate, and cost-effective diagnostic tools. Regulatory frameworks, such as those enforced by the World Organisation for Animal Health (OIE), are increasingly stringent, mandating robust diagnostic protocols to prevent disease outbreaks and ensure seafood safety. Product substitutes, while limited in the short term, could emerge from advancements in non-invasive sampling techniques or novel therapeutic approaches that reduce the reliance on early detection. End-user trends reveal a growing demand for on-farm, rapid diagnostic solutions to minimize economic losses. Mergers and acquisitions (M&A) activity, while not currently at its peak, is expected to increase as larger companies seek to acquire innovative technologies and expand their market reach. The estimated number of M&A deals in the forecast period is projected to be in the tens, with significant financial investments in the billions.
bacterial diagnostics in aquaculture Industry Trends & Analysis
The bacterial diagnostics in aquaculture industry is poised for substantial growth, with an anticipated Compound Annual Growth Rate (CAGR) of approximately xx% over the forecast period of 2025–2033. This robust growth is primarily fueled by the escalating global demand for seafood, driven by population expansion and changing dietary preferences. The increasing awareness of the economic impact of bacterial diseases on aquaculture operations, which can lead to mortality rates of up to xx% and significant revenue losses in the billions, is compelling producers to invest heavily in advanced diagnostic solutions. Technological disruptions are at the forefront of this trend, with the adoption of molecular diagnostics, including Polymerase Chain Reaction (PCR) and next-generation sequencing, revolutionizing the speed and accuracy of pathogen identification. These technologies allow for early detection of even low pathogen loads, enabling timely intervention and preventing widespread outbreaks that could decimate entire stocks, leading to losses in the billions. Consumer preferences are also shifting towards sustainably sourced and disease-free seafood, further pushing the demand for reliable diagnostic methods. Competitive dynamics are intensifying, with established players and emerging innovators vying for market dominance through product differentiation, strategic partnerships, and aggressive marketing strategies. Market penetration is expected to rise significantly, particularly in developing regions where aquaculture production is rapidly expanding. The integration of these diagnostic tools into farm management systems is becoming a standard practice, contributing to a more resilient and profitable aquaculture sector, with market value expected to reach trillions by 2033.
Leading Markets & Segments in bacterial diagnostics in aquaculture
The Molecular Diagnostics segment is projected to dominate the bacterial diagnostics in aquaculture market, accounting for a significant market share, estimated to be in the billions by 2025. This dominance is driven by its unparalleled accuracy, sensitivity, and ability to detect a wide range of pathogens simultaneously. Within applications, General Aquaculture holds a leading position due to the sheer volume of production and the widespread prevalence of bacterial diseases affecting species like tilapia, salmon, and shrimp. The economic policies promoting aquaculture development and food security in major producing nations, such as China and Vietnam, further bolster this segment.
Key Drivers of Dominance in Molecular Diagnostics:
- Technological Advancements: Continuous innovation in PCR, real-time PCR, and whole-genome sequencing offers faster turnaround times and higher specificity.
- Sensitivity and Specificity: Ability to detect minute quantities of DNA/RNA, allowing for early disease detection before visible symptoms appear.
- Multiplexing Capabilities: Simultaneous detection of multiple pathogens, reducing testing costs and time.
Key Drivers of Dominance in General Aquaculture:
- Global Demand for Staple Species: High consumption rates of fish and shellfish worldwide necessitate large-scale production.
- Economic Importance: Aquaculture contributes billions to global economies, making disease prevention a critical economic imperative.
- Disease Prevalence: Common bacterial pathogens like Vibrio species, Aeromonas species, and Streptococcus species frequently impact general aquaculture species, creating a persistent need for diagnostics.
The Polymerase Chain Reaction (PCR) type, a cornerstone of molecular diagnostics, will experience exponential growth, with its market value projected in the billions. Its ability to amplify even trace amounts of microbial DNA makes it indispensable for detecting common aquaculture pathogens. Special Aquaculture segments, while smaller, represent niche markets with high growth potential, particularly for high-value species where disease outbreaks can incur catastrophic financial losses in the billions. The regulatory frameworks governing these segments often demand more specialized and sensitive diagnostic solutions.
bacterial diagnostics in aquaculture Product Developments
Recent product developments in bacterial diagnostics for aquaculture are primarily focused on enhancing speed, accuracy, and ease of use. Innovations in Polymerase Chain Reaction (PCR) technology have led to the introduction of rapid, on-site testing kits that can deliver results within hours, significantly reducing the time to diagnosis compared to traditional methods. Molecular diagnostic platforms are becoming more sophisticated, offering multiplex testing capabilities to identify multiple bacterial pathogens simultaneously from a single sample, thereby optimizing resource allocation and minimizing costs for aquaculture operations. Companies are also developing user-friendly immunofluorescent antibody tests (IFAT) and other rapid assay formats that can be deployed by farm personnel without extensive laboratory training, thereby democratizing access to critical diagnostic information. These advancements are crucial in preventing the spread of devastating bacterial infections that can result in economic losses in the billions.
Key Drivers of bacterial diagnostics in aquaculture Growth
The growth of the bacterial diagnostics in aquaculture market is propelled by several key factors. Firstly, the increasing global demand for seafood, driven by a growing population and shifting dietary patterns, necessitates more efficient and productive aquaculture practices. Secondly, the mounting economic losses incurred by disease outbreaks, often reaching billions of dollars, are compelling producers to invest in preventative measures, including robust diagnostic tools. Thirdly, advancements in molecular diagnostic technologies, such as PCR and next-generation sequencing, are offering more accurate and rapid detection of pathogens. Lastly, stringent government regulations and international trade requirements for seafood safety and disease control are driving the adoption of advanced diagnostic solutions.
Challenges in the bacterial diagnostics in aquaculture Market
Despite its promising growth, the bacterial diagnostics in aquaculture market faces several challenges. High initial investment costs for sophisticated diagnostic equipment and reagents can be a significant barrier, particularly for small-scale farmers in developing regions. The availability of skilled personnel to operate advanced diagnostic tools and interpret results accurately is also a concern. Furthermore, the diversity of aquaculture species and the potential for novel or emerging bacterial strains can complicate diagnostic efforts. Supply chain disruptions, particularly for specialized reagents and equipment, can lead to delays in testing and outbreak response. Intense competition among diagnostic providers can also lead to price pressures, impacting profitability.
Emerging Opportunities in bacterial diagnostics in aquaculture
Emerging opportunities in the bacterial diagnostics in aquaculture market lie in the development of point-of-care, portable diagnostic devices that enable rapid, on-farm testing. The integration of artificial intelligence (AI) and machine learning with diagnostic data holds immense potential for predictive analytics, allowing for early identification of disease risk and proactive intervention. Strategic partnerships between diagnostic companies, aquaculture producers, and research institutions can foster collaborative innovation and accelerate the development and adoption of novel solutions. Furthermore, the expanding aquaculture sector in emerging economies presents a significant untapped market for affordable and accessible bacterial diagnostic tools, with the potential for substantial revenue generation in the billions.
Leading Players in the bacterial diagnostics in aquaculture Sector
- Thermo Fisher Scientific
- LexaGene
- Myron L
- Aquatic Diagnostics
- Mologic
- Biogenuix
- Aura Biotech
Key Milestones in bacterial diagnostics in aquaculture Industry
- 2019: Increased regulatory focus on antimicrobial resistance (AMR) in aquaculture spurs investment in diagnostic research.
- 2020: Introduction of more portable and user-friendly PCR-based diagnostic kits for on-farm use.
- 2021: Growing adoption of next-generation sequencing for comprehensive pathogen profiling in aquaculture.
- 2022: Strategic partnerships formed to develop integrated disease management solutions for aquaculture.
- 2023: Enhanced development of rapid antibody tests for specific bacterial pathogens.
- 2024: Significant investments in AI-driven diagnostic platforms for predictive disease modeling in aquaculture.
Strategic Outlook for bacterial diagnostics in aquaculture Market
The strategic outlook for the bacterial diagnostics in aquaculture market is exceptionally positive, driven by an unwavering demand for sustainable seafood and the imperative to mitigate economic losses from disease. Key growth accelerators include the continued innovation in molecular diagnostics, leading to faster, more accurate, and cost-effective solutions. The increasing adoption of digital technologies, such as cloud-based data management and AI-powered analytics, will empower aquaculture operations with predictive disease insights. Strategic collaborations between technology providers and end-users will be crucial for tailoring solutions to specific needs and enhancing market penetration. The focus on developing rapid, on-site testing capabilities will further solidify market growth, enabling proactive disease management and safeguarding billions in aquaculture investments.
bacterial diagnostics in aquaculture Segmentation
-
1. Application
- 1.1. General Aquaculture
- 1.2. Special Aquaculture
-
2. Types
- 2.1. Molecular Diagnostics
- 2.2. Immunofluorescent Antibody Test
- 2.3. Polymerase Chain Reaction
- 2.4. Others
bacterial diagnostics in aquaculture Segmentation By Geography
-
1. North America
- 1.1. United States
- 1.2. Canada
- 1.3. Mexico
-
2. South America
- 2.1. Brazil
- 2.2. Argentina
- 2.3. Rest of South America
-
3. Europe
- 3.1. United Kingdom
- 3.2. Germany
- 3.3. France
- 3.4. Italy
- 3.5. Spain
- 3.6. Russia
- 3.7. Benelux
- 3.8. Nordics
- 3.9. Rest of Europe
-
4. Middle East & Africa
- 4.1. Turkey
- 4.2. Israel
- 4.3. GCC
- 4.4. North Africa
- 4.5. South Africa
- 4.6. Rest of Middle East & Africa
-
5. Asia Pacific
- 5.1. China
- 5.2. India
- 5.3. Japan
- 5.4. South Korea
- 5.5. ASEAN
- 5.6. Oceania
- 5.7. Rest of Asia Pacific
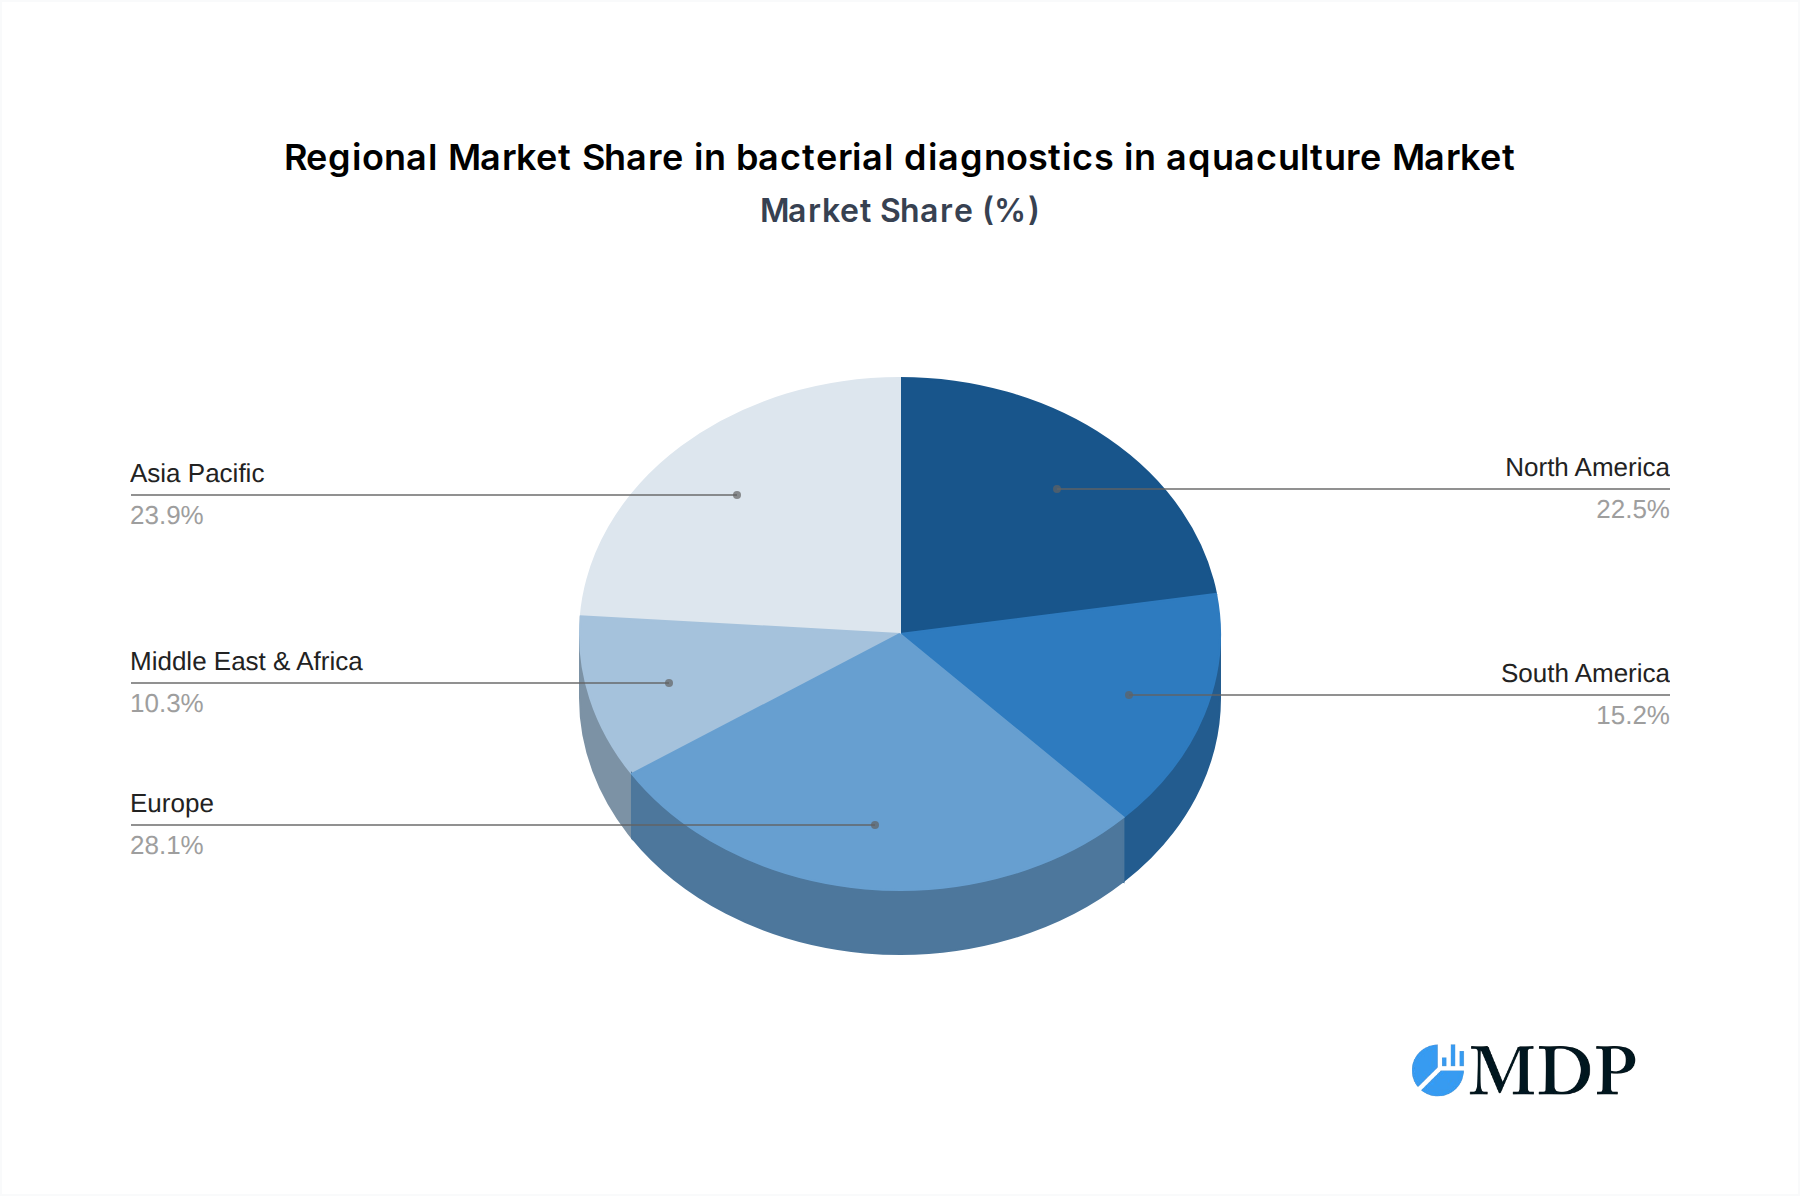
bacterial diagnostics in aquaculture Regional Market Share
Geographic Coverage of bacterial diagnostics in aquaculture
bacterial diagnostics in aquaculture REPORT HIGHLIGHTS
| Aspects | Details |
|---|---|
| Study Period | 2020-2034 |
| Base Year | 2025 |
| Estimated Year | 2026 |
| Forecast Period | 2026-2034 |
| Historical Period | 2020-2025 |
| Growth Rate | CAGR of 6.8% from 2020-2034 |
| Segmentation |
|
Table of Contents
- 1. Introduction
- 1.1. Research Scope
- 1.2. Market Segmentation
- 1.3. Research Methodology
- 1.4. Definitions and Assumptions
- 2. Executive Summary
- 2.1. Introduction
- 3. Market Dynamics
- 3.1. Introduction
- 3.2. Market Drivers
- 3.3. Market Restrains
- 3.4. Market Trends
- 4. Market Factor Analysis
- 4.1. Porters Five Forces
- 4.2. Supply/Value Chain
- 4.3. PESTEL analysis
- 4.4. Market Entropy
- 4.5. Patent/Trademark Analysis
- 5. Global bacterial diagnostics in aquaculture Analysis, Insights and Forecast, 2020-2032
- 5.1. Market Analysis, Insights and Forecast - by Application
- 5.1.1. General Aquaculture
- 5.1.2. Special Aquaculture
- 5.2. Market Analysis, Insights and Forecast - by Types
- 5.2.1. Molecular Diagnostics
- 5.2.2. Immunofluorescent Antibody Test
- 5.2.3. Polymerase Chain Reaction
- 5.2.4. Others
- 5.3. Market Analysis, Insights and Forecast - by Region
- 5.3.1. North America
- 5.3.2. South America
- 5.3.3. Europe
- 5.3.4. Middle East & Africa
- 5.3.5. Asia Pacific
- 5.1. Market Analysis, Insights and Forecast - by Application
- 6. North America bacterial diagnostics in aquaculture Analysis, Insights and Forecast, 2020-2032
- 6.1. Market Analysis, Insights and Forecast - by Application
- 6.1.1. General Aquaculture
- 6.1.2. Special Aquaculture
- 6.2. Market Analysis, Insights and Forecast - by Types
- 6.2.1. Molecular Diagnostics
- 6.2.2. Immunofluorescent Antibody Test
- 6.2.3. Polymerase Chain Reaction
- 6.2.4. Others
- 6.1. Market Analysis, Insights and Forecast - by Application
- 7. South America bacterial diagnostics in aquaculture Analysis, Insights and Forecast, 2020-2032
- 7.1. Market Analysis, Insights and Forecast - by Application
- 7.1.1. General Aquaculture
- 7.1.2. Special Aquaculture
- 7.2. Market Analysis, Insights and Forecast - by Types
- 7.2.1. Molecular Diagnostics
- 7.2.2. Immunofluorescent Antibody Test
- 7.2.3. Polymerase Chain Reaction
- 7.2.4. Others
- 7.1. Market Analysis, Insights and Forecast - by Application
- 8. Europe bacterial diagnostics in aquaculture Analysis, Insights and Forecast, 2020-2032
- 8.1. Market Analysis, Insights and Forecast - by Application
- 8.1.1. General Aquaculture
- 8.1.2. Special Aquaculture
- 8.2. Market Analysis, Insights and Forecast - by Types
- 8.2.1. Molecular Diagnostics
- 8.2.2. Immunofluorescent Antibody Test
- 8.2.3. Polymerase Chain Reaction
- 8.2.4. Others
- 8.1. Market Analysis, Insights and Forecast - by Application
- 9. Middle East & Africa bacterial diagnostics in aquaculture Analysis, Insights and Forecast, 2020-2032
- 9.1. Market Analysis, Insights and Forecast - by Application
- 9.1.1. General Aquaculture
- 9.1.2. Special Aquaculture
- 9.2. Market Analysis, Insights and Forecast - by Types
- 9.2.1. Molecular Diagnostics
- 9.2.2. Immunofluorescent Antibody Test
- 9.2.3. Polymerase Chain Reaction
- 9.2.4. Others
- 9.1. Market Analysis, Insights and Forecast - by Application
- 10. Asia Pacific bacterial diagnostics in aquaculture Analysis, Insights and Forecast, 2020-2032
- 10.1. Market Analysis, Insights and Forecast - by Application
- 10.1.1. General Aquaculture
- 10.1.2. Special Aquaculture
- 10.2. Market Analysis, Insights and Forecast - by Types
- 10.2.1. Molecular Diagnostics
- 10.2.2. Immunofluorescent Antibody Test
- 10.2.3. Polymerase Chain Reaction
- 10.2.4. Others
- 10.1. Market Analysis, Insights and Forecast - by Application
- 11. Competitive Analysis
- 11.1. Global Market Share Analysis 2025
- 11.2. Company Profiles
- 11.2.1 Thermo Fisher Scientific
- 11.2.1.1. Overview
- 11.2.1.2. Products
- 11.2.1.3. SWOT Analysis
- 11.2.1.4. Recent Developments
- 11.2.1.5. Financials (Based on Availability)
- 11.2.2 LexaGene
- 11.2.2.1. Overview
- 11.2.2.2. Products
- 11.2.2.3. SWOT Analysis
- 11.2.2.4. Recent Developments
- 11.2.2.5. Financials (Based on Availability)
- 11.2.3 Myron L
- 11.2.3.1. Overview
- 11.2.3.2. Products
- 11.2.3.3. SWOT Analysis
- 11.2.3.4. Recent Developments
- 11.2.3.5. Financials (Based on Availability)
- 11.2.4 Aquatic Diagnostics
- 11.2.4.1. Overview
- 11.2.4.2. Products
- 11.2.4.3. SWOT Analysis
- 11.2.4.4. Recent Developments
- 11.2.4.5. Financials (Based on Availability)
- 11.2.5 Mologic
- 11.2.5.1. Overview
- 11.2.5.2. Products
- 11.2.5.3. SWOT Analysis
- 11.2.5.4. Recent Developments
- 11.2.5.5. Financials (Based on Availability)
- 11.2.6 Biogenuix
- 11.2.6.1. Overview
- 11.2.6.2. Products
- 11.2.6.3. SWOT Analysis
- 11.2.6.4. Recent Developments
- 11.2.6.5. Financials (Based on Availability)
- 11.2.7 Aura Biotech
- 11.2.7.1. Overview
- 11.2.7.2. Products
- 11.2.7.3. SWOT Analysis
- 11.2.7.4. Recent Developments
- 11.2.7.5. Financials (Based on Availability)
- 11.2.1 Thermo Fisher Scientific
List of Figures
- Figure 1: Global bacterial diagnostics in aquaculture Revenue Breakdown (billion, %) by Region 2025 & 2033
- Figure 2: North America bacterial diagnostics in aquaculture Revenue (billion), by Application 2025 & 2033
- Figure 3: North America bacterial diagnostics in aquaculture Revenue Share (%), by Application 2025 & 2033
- Figure 4: North America bacterial diagnostics in aquaculture Revenue (billion), by Types 2025 & 2033
- Figure 5: North America bacterial diagnostics in aquaculture Revenue Share (%), by Types 2025 & 2033
- Figure 6: North America bacterial diagnostics in aquaculture Revenue (billion), by Country 2025 & 2033
- Figure 7: North America bacterial diagnostics in aquaculture Revenue Share (%), by Country 2025 & 2033
- Figure 8: South America bacterial diagnostics in aquaculture Revenue (billion), by Application 2025 & 2033
- Figure 9: South America bacterial diagnostics in aquaculture Revenue Share (%), by Application 2025 & 2033
- Figure 10: South America bacterial diagnostics in aquaculture Revenue (billion), by Types 2025 & 2033
- Figure 11: South America bacterial diagnostics in aquaculture Revenue Share (%), by Types 2025 & 2033
- Figure 12: South America bacterial diagnostics in aquaculture Revenue (billion), by Country 2025 & 2033
- Figure 13: South America bacterial diagnostics in aquaculture Revenue Share (%), by Country 2025 & 2033
- Figure 14: Europe bacterial diagnostics in aquaculture Revenue (billion), by Application 2025 & 2033
- Figure 15: Europe bacterial diagnostics in aquaculture Revenue Share (%), by Application 2025 & 2033
- Figure 16: Europe bacterial diagnostics in aquaculture Revenue (billion), by Types 2025 & 2033
- Figure 17: Europe bacterial diagnostics in aquaculture Revenue Share (%), by Types 2025 & 2033
- Figure 18: Europe bacterial diagnostics in aquaculture Revenue (billion), by Country 2025 & 2033
- Figure 19: Europe bacterial diagnostics in aquaculture Revenue Share (%), by Country 2025 & 2033
- Figure 20: Middle East & Africa bacterial diagnostics in aquaculture Revenue (billion), by Application 2025 & 2033
- Figure 21: Middle East & Africa bacterial diagnostics in aquaculture Revenue Share (%), by Application 2025 & 2033
- Figure 22: Middle East & Africa bacterial diagnostics in aquaculture Revenue (billion), by Types 2025 & 2033
- Figure 23: Middle East & Africa bacterial diagnostics in aquaculture Revenue Share (%), by Types 2025 & 2033
- Figure 24: Middle East & Africa bacterial diagnostics in aquaculture Revenue (billion), by Country 2025 & 2033
- Figure 25: Middle East & Africa bacterial diagnostics in aquaculture Revenue Share (%), by Country 2025 & 2033
- Figure 26: Asia Pacific bacterial diagnostics in aquaculture Revenue (billion), by Application 2025 & 2033
- Figure 27: Asia Pacific bacterial diagnostics in aquaculture Revenue Share (%), by Application 2025 & 2033
- Figure 28: Asia Pacific bacterial diagnostics in aquaculture Revenue (billion), by Types 2025 & 2033
- Figure 29: Asia Pacific bacterial diagnostics in aquaculture Revenue Share (%), by Types 2025 & 2033
- Figure 30: Asia Pacific bacterial diagnostics in aquaculture Revenue (billion), by Country 2025 & 2033
- Figure 31: Asia Pacific bacterial diagnostics in aquaculture Revenue Share (%), by Country 2025 & 2033
List of Tables
- Table 1: Global bacterial diagnostics in aquaculture Revenue billion Forecast, by Application 2020 & 2033
- Table 2: Global bacterial diagnostics in aquaculture Revenue billion Forecast, by Types 2020 & 2033
- Table 3: Global bacterial diagnostics in aquaculture Revenue billion Forecast, by Region 2020 & 2033
- Table 4: Global bacterial diagnostics in aquaculture Revenue billion Forecast, by Application 2020 & 2033
- Table 5: Global bacterial diagnostics in aquaculture Revenue billion Forecast, by Types 2020 & 2033
- Table 6: Global bacterial diagnostics in aquaculture Revenue billion Forecast, by Country 2020 & 2033
- Table 7: United States bacterial diagnostics in aquaculture Revenue (billion) Forecast, by Application 2020 & 2033
- Table 8: Canada bacterial diagnostics in aquaculture Revenue (billion) Forecast, by Application 2020 & 2033
- Table 9: Mexico bacterial diagnostics in aquaculture Revenue (billion) Forecast, by Application 2020 & 2033
- Table 10: Global bacterial diagnostics in aquaculture Revenue billion Forecast, by Application 2020 & 2033
- Table 11: Global bacterial diagnostics in aquaculture Revenue billion Forecast, by Types 2020 & 2033
- Table 12: Global bacterial diagnostics in aquaculture Revenue billion Forecast, by Country 2020 & 2033
- Table 13: Brazil bacterial diagnostics in aquaculture Revenue (billion) Forecast, by Application 2020 & 2033
- Table 14: Argentina bacterial diagnostics in aquaculture Revenue (billion) Forecast, by Application 2020 & 2033
- Table 15: Rest of South America bacterial diagnostics in aquaculture Revenue (billion) Forecast, by Application 2020 & 2033
- Table 16: Global bacterial diagnostics in aquaculture Revenue billion Forecast, by Application 2020 & 2033
- Table 17: Global bacterial diagnostics in aquaculture Revenue billion Forecast, by Types 2020 & 2033
- Table 18: Global bacterial diagnostics in aquaculture Revenue billion Forecast, by Country 2020 & 2033
- Table 19: United Kingdom bacterial diagnostics in aquaculture Revenue (billion) Forecast, by Application 2020 & 2033
- Table 20: Germany bacterial diagnostics in aquaculture Revenue (billion) Forecast, by Application 2020 & 2033
- Table 21: France bacterial diagnostics in aquaculture Revenue (billion) Forecast, by Application 2020 & 2033
- Table 22: Italy bacterial diagnostics in aquaculture Revenue (billion) Forecast, by Application 2020 & 2033
- Table 23: Spain bacterial diagnostics in aquaculture Revenue (billion) Forecast, by Application 2020 & 2033
- Table 24: Russia bacterial diagnostics in aquaculture Revenue (billion) Forecast, by Application 2020 & 2033
- Table 25: Benelux bacterial diagnostics in aquaculture Revenue (billion) Forecast, by Application 2020 & 2033
- Table 26: Nordics bacterial diagnostics in aquaculture Revenue (billion) Forecast, by Application 2020 & 2033
- Table 27: Rest of Europe bacterial diagnostics in aquaculture Revenue (billion) Forecast, by Application 2020 & 2033
- Table 28: Global bacterial diagnostics in aquaculture Revenue billion Forecast, by Application 2020 & 2033
- Table 29: Global bacterial diagnostics in aquaculture Revenue billion Forecast, by Types 2020 & 2033
- Table 30: Global bacterial diagnostics in aquaculture Revenue billion Forecast, by Country 2020 & 2033
- Table 31: Turkey bacterial diagnostics in aquaculture Revenue (billion) Forecast, by Application 2020 & 2033
- Table 32: Israel bacterial diagnostics in aquaculture Revenue (billion) Forecast, by Application 2020 & 2033
- Table 33: GCC bacterial diagnostics in aquaculture Revenue (billion) Forecast, by Application 2020 & 2033
- Table 34: North Africa bacterial diagnostics in aquaculture Revenue (billion) Forecast, by Application 2020 & 2033
- Table 35: South Africa bacterial diagnostics in aquaculture Revenue (billion) Forecast, by Application 2020 & 2033
- Table 36: Rest of Middle East & Africa bacterial diagnostics in aquaculture Revenue (billion) Forecast, by Application 2020 & 2033
- Table 37: Global bacterial diagnostics in aquaculture Revenue billion Forecast, by Application 2020 & 2033
- Table 38: Global bacterial diagnostics in aquaculture Revenue billion Forecast, by Types 2020 & 2033
- Table 39: Global bacterial diagnostics in aquaculture Revenue billion Forecast, by Country 2020 & 2033
- Table 40: China bacterial diagnostics in aquaculture Revenue (billion) Forecast, by Application 2020 & 2033
- Table 41: India bacterial diagnostics in aquaculture Revenue (billion) Forecast, by Application 2020 & 2033
- Table 42: Japan bacterial diagnostics in aquaculture Revenue (billion) Forecast, by Application 2020 & 2033
- Table 43: South Korea bacterial diagnostics in aquaculture Revenue (billion) Forecast, by Application 2020 & 2033
- Table 44: ASEAN bacterial diagnostics in aquaculture Revenue (billion) Forecast, by Application 2020 & 2033
- Table 45: Oceania bacterial diagnostics in aquaculture Revenue (billion) Forecast, by Application 2020 & 2033
- Table 46: Rest of Asia Pacific bacterial diagnostics in aquaculture Revenue (billion) Forecast, by Application 2020 & 2033
Frequently Asked Questions
1. What is the projected Compound Annual Growth Rate (CAGR) of the bacterial diagnostics in aquaculture?
The projected CAGR is approximately 6.8%.
2. Which companies are prominent players in the bacterial diagnostics in aquaculture?
Key companies in the market include Thermo Fisher Scientific, LexaGene, Myron L, Aquatic Diagnostics, Mologic, Biogenuix, Aura Biotech.
3. What are the main segments of the bacterial diagnostics in aquaculture?
The market segments include Application, Types.
4. Can you provide details about the market size?
The market size is estimated to be USD 1.42 billion as of 2022.
5. What are some drivers contributing to market growth?
N/A
6. What are the notable trends driving market growth?
N/A
7. Are there any restraints impacting market growth?
N/A
8. Can you provide examples of recent developments in the market?
N/A
9. What pricing options are available for accessing the report?
Pricing options include single-user, multi-user, and enterprise licenses priced at USD 4350.00, USD 6525.00, and USD 8700.00 respectively.
10. Is the market size provided in terms of value or volume?
The market size is provided in terms of value, measured in billion.
11. Are there any specific market keywords associated with the report?
Yes, the market keyword associated with the report is "bacterial diagnostics in aquaculture," which aids in identifying and referencing the specific market segment covered.
12. How do I determine which pricing option suits my needs best?
The pricing options vary based on user requirements and access needs. Individual users may opt for single-user licenses, while businesses requiring broader access may choose multi-user or enterprise licenses for cost-effective access to the report.
13. Are there any additional resources or data provided in the bacterial diagnostics in aquaculture report?
While the report offers comprehensive insights, it's advisable to review the specific contents or supplementary materials provided to ascertain if additional resources or data are available.
14. How can I stay updated on further developments or reports in the bacterial diagnostics in aquaculture?
To stay informed about further developments, trends, and reports in the bacterial diagnostics in aquaculture, consider subscribing to industry newsletters, following relevant companies and organizations, or regularly checking reputable industry news sources and publications.
Methodology
Step 1 - Identification of Relevant Samples Size from Population Database


Step 2 - Approaches for Defining Global Market Size (Value, Volume* & Price*)

Note*: In applicable scenarios
Step 3 - Data Sources
Primary Research
- Web Analytics
- Survey Reports
- Research Institute
- Latest Research Reports
- Opinion Leaders
Secondary Research
- Annual Reports
- White Paper
- Latest Press Release
- Industry Association
- Paid Database
- Investor Presentations

Step 4 - Data Triangulation
Involves using different sources of information in order to increase the validity of a study
These sources are likely to be stakeholders in a program - participants, other researchers, program staff, other community members, and so on.
Then we put all data in single framework & apply various statistical tools to find out the dynamic on the market.
During the analysis stage, feedback from the stakeholder groups would be compared to determine areas of agreement as well as areas of divergence