

Key Insights
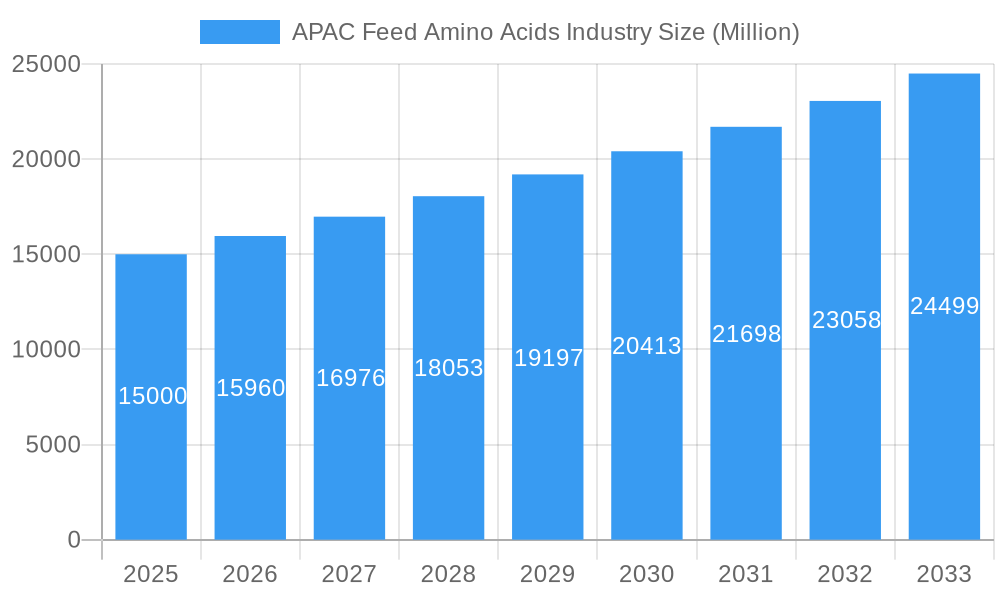
The Asia-Pacific (APAC) feed amino acids market is experiencing robust growth, driven by the region's expanding livestock and aquaculture sectors. A Compound Annual Growth Rate (CAGR) of 6.40% from 2019 to 2033 indicates a significant upward trajectory. This expansion is fueled by increasing demand for animal protein, particularly in rapidly developing economies like China, India, and Vietnam. Rising consumer incomes and changing dietary habits are contributing to this surge in demand. Within the APAC region, the aquaculture segment is a key driver, with substantial growth anticipated due to increasing seafood consumption and the need for efficient and sustainable aquaculture practices. Lysine and methionine remain the dominant amino acids, representing a significant portion of the market share, while other amino acids like threonine and tryptophan are also witnessing growth, albeit at a slower pace. Challenges include fluctuating raw material prices, stringent regulatory frameworks related to feed safety and environmental concerns. Despite these constraints, the long-term outlook for the APAC feed amino acids market remains optimistic, with continuous innovation in amino acid production and formulation expected to further drive market growth.
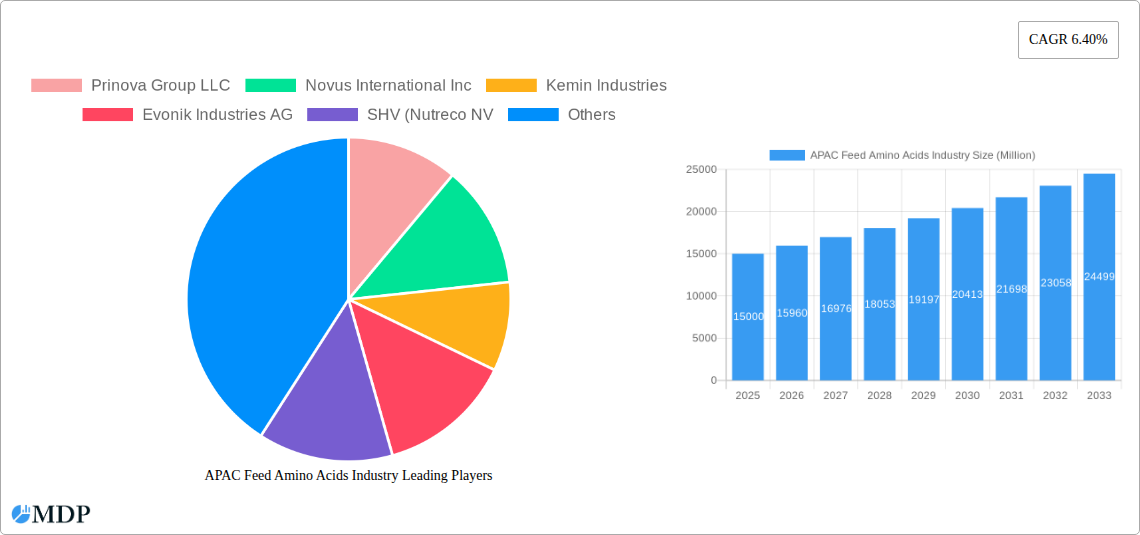
APAC Feed Amino Acids Industry Market Size (In Billion)
The competitive landscape is characterized by the presence of both multinational corporations and regional players. Major players like Novus International, Evonik Industries, and Ajinomoto Co. Inc. are leveraging their established distribution networks and technological advancements to maintain a strong market position. However, the market is witnessing increased competition from smaller players, particularly in the rapidly developing economies of the APAC region. These smaller companies are often focusing on cost-effective production and catering to specific regional demands. Strategic partnerships, mergers, and acquisitions are anticipated in the coming years, shaping the future competitive dynamics of the market. Future growth will likely depend on innovation in amino acid production technologies, development of sustainable feed solutions, and adaptation to changing regulatory environments.
APAC Feed Amino Acids Industry Company Market Share
APAC Feed Amino Acids Industry: A Comprehensive Market Report (2019-2033)
This in-depth report provides a comprehensive analysis of the Asia-Pacific (APAC) feed amino acids industry, covering market dynamics, trends, leading players, and future growth prospects. With a study period spanning 2019-2033, a base year of 2025, and a forecast period of 2025-2033, this report is an invaluable resource for industry stakeholders, investors, and strategic decision-makers. The report analyzes key segments including Lysine, Methionine, Threonine, Tryptophan, and Other Amino Acids, across major APAC countries like Australia, China, India, Indonesia, Japan, Philippines, South Korea, Thailand, and Vietnam. The market size is expected to reach xx Million by 2033, showcasing significant growth potential.
APAC Feed Amino Acids Industry Market Dynamics & Concentration
The APAC feed amino acids market is characterized by a moderately concentrated landscape, with several major players holding significant market share. The market concentration ratio (CR4) is estimated at xx% in 2025. Innovation is a key driver, with companies continuously developing new amino acid products and formulations to enhance animal nutrition and productivity. Stringent regulatory frameworks regarding feed safety and quality influence market dynamics. The presence of product substitutes, such as alternative feed ingredients, presents a challenge to the industry. However, increasing demand for high-quality animal protein and rising consumer awareness of animal welfare are driving market growth. Mergers and acquisitions (M&A) activity has been significant, with xx M&A deals recorded between 2019 and 2024.
- Key Market Dynamics: Innovation, Regulation, Substitutes, End-user trends, M&A activity
- Market Concentration: CR4 (2025): xx%
- M&A Activity (2019-2024): xx deals
APAC Feed Amino Acids Industry Industry Trends & Analysis
The APAC feed amino acids market exhibits robust growth, driven by factors such as the rising demand for animal protein, increasing livestock production, and the growing adoption of advanced animal feed formulations. Technological advancements, such as precision feeding and improved amino acid synthesis techniques, are further boosting market expansion. Changing consumer preferences towards healthier and sustainably produced animal products also influence industry trends. The competitive landscape is highly dynamic, with companies focusing on product differentiation, cost optimization, and strategic partnerships. The market is expected to exhibit a Compound Annual Growth Rate (CAGR) of xx% during the forecast period (2025-2033), with a market penetration rate of xx% in 2025.
Leading Markets & Segments in APAC Feed Amino Acids Industry
China is the dominant market in the APAC region, accounting for approximately xx% of the total market value in 2025, followed by India and other Southeast Asian countries. The swine segment holds the largest share in terms of consumption of feed amino acids, driven by high pork consumption in the region. The aquaculture segment displays rapid growth, fueled by the expanding aquaculture industry.
Key Drivers by Country:
- China: Government support for livestock farming, growing middle-class consumption, robust feed manufacturing infrastructure.
- India: Rapidly expanding livestock population, increasing poultry consumption, government initiatives to promote livestock production.
- Other Southeast Asia: High fish and shrimp consumption, supportive government policies for aquaculture development, favourable climate conditions.
Segment Dominance: Swine and Aquaculture dominate, displaying high growth potential.
APAC Feed Amino Acids Industry Product Developments
The APAC feed amino acids market witnesses continuous product innovation. Companies are focused on developing customized amino acid formulations to meet the specific nutritional needs of different animal species and production systems. Technological advancements are driving the adoption of more efficient and cost-effective amino acid production methods. The focus is on improved bioavailability, reduced environmental impact, and enhanced animal health and productivity.
Key Drivers of APAC Feed Amino Acids Industry Growth
Several factors drive the growth of the APAC feed amino acids industry. Firstly, the rising demand for animal protein, driven by increasing population and changing dietary habits, fuels market expansion. Secondly, advancements in feed technology and formulations lead to improved animal health and productivity, translating to higher demand for amino acids. Lastly, supportive government policies and investments in the agricultural sector boost the industry.
Challenges in the APAP Feed Amino Acids Industry Market
The APAC feed amino acids industry faces challenges, including fluctuating raw material prices, complex regulatory landscapes, and intense competition. Supply chain disruptions can affect the availability and cost of raw materials, impacting production and profitability. Stringent regulations related to feed safety and quality necessitate significant investments in compliance measures. Moreover, intense competition among established players and the emergence of new entrants put pressure on profit margins.
Emerging Opportunities in APAC Feed Amino Acids Industry
The APAC feed amino acids market presents significant opportunities. The growing demand for sustainable and environmentally friendly feed additives creates an opportunity for companies to develop and market products that minimize environmental impact. Technological advancements in precision feeding and personalized nutrition solutions offer further opportunities to improve animal health and productivity. Strategic partnerships and collaborations between feed manufacturers, amino acid producers, and technology providers can unlock new growth avenues.
Leading Players in the APAC Feed Amino Acids Industry Sector
Key Milestones in APAC Feed Amino Acids Industry Industry
- September 2022: Adisseo commences production at its new 180,000-ton liquid methionine plant in Nanjing, China.
- October 2022: Evonik and BASF enter a partnership granting Evonik non-exclusive licensing rights to OpteinicsTM.
- January 2023: Novus International acquires Agrivida, a biotech company focused on feed additives.
Strategic Outlook for APAC Feed Amino Acids Industry Market
The APAC feed amino acids market holds significant long-term growth potential. The increasing demand for animal protein, coupled with ongoing technological advancements and strategic partnerships, will drive market expansion. Companies that focus on product innovation, sustainability, and efficient supply chain management are well-positioned to capture market share and achieve long-term success. The market is expected to witness significant growth in the next decade, driven by the factors discussed above.
APAC Feed Amino Acids Industry Segmentation
-
1. Sub Additive
- 1.1. Lysine
- 1.2. Methionine
- 1.3. Threonine
- 1.4. Tryptophan
- 1.5. Other Amino Acids
-
2. Animal
-
2.1. Aquaculture
-
2.1.1. By Sub Animal
- 2.1.1.1. Fish
- 2.1.1.2. Shrimp
- 2.1.1.3. Other Aquaculture Species
-
2.1.1. By Sub Animal
-
2.2. Poultry
- 2.2.1. Broiler
- 2.2.2. Layer
- 2.2.3. Other Poultry Birds
-
2.3. Ruminants
- 2.3.1. Beef Cattle
- 2.3.2. Dairy Cattle
- 2.3.3. Other Ruminants
- 2.4. Swine
- 2.5. Other Animals
-
2.1. Aquaculture
APAC Feed Amino Acids Industry Segmentation By Geography
-
1. North America
- 1.1. United States
- 1.2. Canada
- 1.3. Mexico
-
2. South America
- 2.1. Brazil
- 2.2. Argentina
- 2.3. Rest of South America
-
3. Europe
- 3.1. United Kingdom
- 3.2. Germany
- 3.3. France
- 3.4. Italy
- 3.5. Spain
- 3.6. Russia
- 3.7. Benelux
- 3.8. Nordics
- 3.9. Rest of Europe
-
4. Middle East & Africa
- 4.1. Turkey
- 4.2. Israel
- 4.3. GCC
- 4.4. North Africa
- 4.5. South Africa
- 4.6. Rest of Middle East & Africa
-
5. Asia Pacific
- 5.1. China
- 5.2. India
- 5.3. Japan
- 5.4. South Korea
- 5.5. ASEAN
- 5.6. Oceania
- 5.7. Rest of Asia Pacific
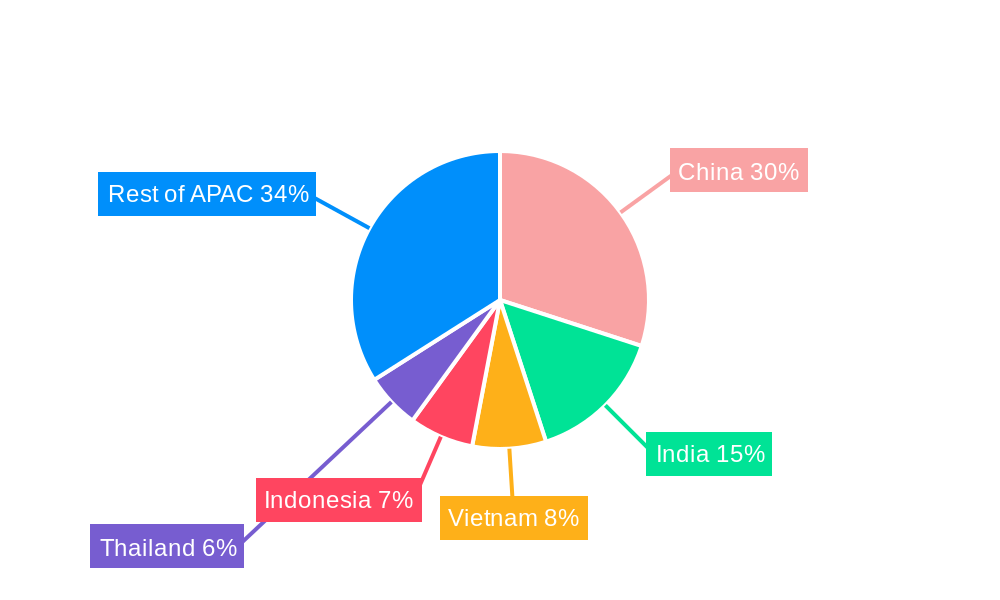
APAC Feed Amino Acids Industry Regional Market Share
Geographic Coverage of APAC Feed Amino Acids Industry
APAC Feed Amino Acids Industry REPORT HIGHLIGHTS
| Aspects | Details |
|---|---|
| Study Period | 2020-2034 |
| Base Year | 2025 |
| Estimated Year | 2026 |
| Forecast Period | 2026-2034 |
| Historical Period | 2020-2025 |
| Growth Rate | CAGR of 8.2% from 2020-2034 |
| Segmentation |
|
Table of Contents
- 1. Introduction
- 1.1. Research Scope
- 1.2. Market Segmentation
- 1.3. Research Objective
- 1.4. Definitions and Assumptions
- 2. Executive Summary
- 2.1. Market Snapshot
- 3. Market Dynamics
- 3.1. Market Drivers
- 3.2. Market Restrains
- 3.3. Market Trends
- 3.4. Market Opportunities
- 4. Market Factor Analysis
- 4.1. Porters Five Forces
- 4.1.1. Bargaining Power of Suppliers
- 4.1.2. Bargaining Power of Buyers
- 4.1.3. Threat of New Entrants
- 4.1.4. Threat of Substitutes
- 4.1.5. Competitive Rivalry
- 4.2. PESTEL analysis
- 4.3. BCG Analysis
- 4.3.1. Stars (High Growth, High Market Share)
- 4.3.2. Cash Cows (Low Growth, High Market Share)
- 4.3.3. Question Mark (High Growth, Low Market Share)
- 4.3.4. Dogs (Low Growth, Low Market Share)
- 4.4. Ansoff Matrix Analysis
- 4.5. Supply Chain Analysis
- 4.6. Regulatory Landscape
- 4.7. Current Market Potential and Opportunity Assessment (TAM–SAM–SOM Framework)
- 4.8. MDP Analyst Note
- 4.1. Porters Five Forces
- 5. Market Analysis, Insights and Forecast 2021-2033
- 5.1. Market Analysis, Insights and Forecast - by Sub Additive
- 5.1.1. Lysine
- 5.1.2. Methionine
- 5.1.3. Threonine
- 5.1.4. Tryptophan
- 5.1.5. Other Amino Acids
- 5.2. Market Analysis, Insights and Forecast - by Animal
- 5.2.1. Aquaculture
- 5.2.1.1. By Sub Animal
- 5.2.1.1.1. Fish
- 5.2.1.1.2. Shrimp
- 5.2.1.1.3. Other Aquaculture Species
- 5.2.1.1. By Sub Animal
- 5.2.2. Poultry
- 5.2.2.1. Broiler
- 5.2.2.2. Layer
- 5.2.2.3. Other Poultry Birds
- 5.2.3. Ruminants
- 5.2.3.1. Beef Cattle
- 5.2.3.2. Dairy Cattle
- 5.2.3.3. Other Ruminants
- 5.2.4. Swine
- 5.2.5. Other Animals
- 5.2.1. Aquaculture
- 5.3. Market Analysis, Insights and Forecast - by Region
- 5.3.1. North America
- 5.3.2. South America
- 5.3.3. Europe
- 5.3.4. Middle East & Africa
- 5.3.5. Asia Pacific
- 5.1. Market Analysis, Insights and Forecast - by Sub Additive
- 6. Global APAC Feed Amino Acids Industry Analysis, Insights and Forecast, 2021-2033
- 6.1. Market Analysis, Insights and Forecast - by Sub Additive
- 6.1.1. Lysine
- 6.1.2. Methionine
- 6.1.3. Threonine
- 6.1.4. Tryptophan
- 6.1.5. Other Amino Acids
- 6.2. Market Analysis, Insights and Forecast - by Animal
- 6.2.1. Aquaculture
- 6.2.1.1. By Sub Animal
- 6.2.1.1.1. Fish
- 6.2.1.1.2. Shrimp
- 6.2.1.1.3. Other Aquaculture Species
- 6.2.1.1. By Sub Animal
- 6.2.2. Poultry
- 6.2.2.1. Broiler
- 6.2.2.2. Layer
- 6.2.2.3. Other Poultry Birds
- 6.2.3. Ruminants
- 6.2.3.1. Beef Cattle
- 6.2.3.2. Dairy Cattle
- 6.2.3.3. Other Ruminants
- 6.2.4. Swine
- 6.2.5. Other Animals
- 6.2.1. Aquaculture
- 6.1. Market Analysis, Insights and Forecast - by Sub Additive
- 7. North America APAC Feed Amino Acids Industry Analysis, Insights and Forecast, 2020-2032
- 7.1. Market Analysis, Insights and Forecast - by Sub Additive
- 7.1.1. Lysine
- 7.1.2. Methionine
- 7.1.3. Threonine
- 7.1.4. Tryptophan
- 7.1.5. Other Amino Acids
- 7.2. Market Analysis, Insights and Forecast - by Animal
- 7.2.1. Aquaculture
- 7.2.1.1. By Sub Animal
- 7.2.1.1.1. Fish
- 7.2.1.1.2. Shrimp
- 7.2.1.1.3. Other Aquaculture Species
- 7.2.1.1. By Sub Animal
- 7.2.2. Poultry
- 7.2.2.1. Broiler
- 7.2.2.2. Layer
- 7.2.2.3. Other Poultry Birds
- 7.2.3. Ruminants
- 7.2.3.1. Beef Cattle
- 7.2.3.2. Dairy Cattle
- 7.2.3.3. Other Ruminants
- 7.2.4. Swine
- 7.2.5. Other Animals
- 7.2.1. Aquaculture
- 7.1. Market Analysis, Insights and Forecast - by Sub Additive
- 8. South America APAC Feed Amino Acids Industry Analysis, Insights and Forecast, 2020-2032
- 8.1. Market Analysis, Insights and Forecast - by Sub Additive
- 8.1.1. Lysine
- 8.1.2. Methionine
- 8.1.3. Threonine
- 8.1.4. Tryptophan
- 8.1.5. Other Amino Acids
- 8.2. Market Analysis, Insights and Forecast - by Animal
- 8.2.1. Aquaculture
- 8.2.1.1. By Sub Animal
- 8.2.1.1.1. Fish
- 8.2.1.1.2. Shrimp
- 8.2.1.1.3. Other Aquaculture Species
- 8.2.1.1. By Sub Animal
- 8.2.2. Poultry
- 8.2.2.1. Broiler
- 8.2.2.2. Layer
- 8.2.2.3. Other Poultry Birds
- 8.2.3. Ruminants
- 8.2.3.1. Beef Cattle
- 8.2.3.2. Dairy Cattle
- 8.2.3.3. Other Ruminants
- 8.2.4. Swine
- 8.2.5. Other Animals
- 8.2.1. Aquaculture
- 8.1. Market Analysis, Insights and Forecast - by Sub Additive
- 9. Europe APAC Feed Amino Acids Industry Analysis, Insights and Forecast, 2020-2032
- 9.1. Market Analysis, Insights and Forecast - by Sub Additive
- 9.1.1. Lysine
- 9.1.2. Methionine
- 9.1.3. Threonine
- 9.1.4. Tryptophan
- 9.1.5. Other Amino Acids
- 9.2. Market Analysis, Insights and Forecast - by Animal
- 9.2.1. Aquaculture
- 9.2.1.1. By Sub Animal
- 9.2.1.1.1. Fish
- 9.2.1.1.2. Shrimp
- 9.2.1.1.3. Other Aquaculture Species
- 9.2.1.1. By Sub Animal
- 9.2.2. Poultry
- 9.2.2.1. Broiler
- 9.2.2.2. Layer
- 9.2.2.3. Other Poultry Birds
- 9.2.3. Ruminants
- 9.2.3.1. Beef Cattle
- 9.2.3.2. Dairy Cattle
- 9.2.3.3. Other Ruminants
- 9.2.4. Swine
- 9.2.5. Other Animals
- 9.2.1. Aquaculture
- 9.1. Market Analysis, Insights and Forecast - by Sub Additive
- 10. Middle East & Africa APAC Feed Amino Acids Industry Analysis, Insights and Forecast, 2020-2032
- 10.1. Market Analysis, Insights and Forecast - by Sub Additive
- 10.1.1. Lysine
- 10.1.2. Methionine
- 10.1.3. Threonine
- 10.1.4. Tryptophan
- 10.1.5. Other Amino Acids
- 10.2. Market Analysis, Insights and Forecast - by Animal
- 10.2.1. Aquaculture
- 10.2.1.1. By Sub Animal
- 10.2.1.1.1. Fish
- 10.2.1.1.2. Shrimp
- 10.2.1.1.3. Other Aquaculture Species
- 10.2.1.1. By Sub Animal
- 10.2.2. Poultry
- 10.2.2.1. Broiler
- 10.2.2.2. Layer
- 10.2.2.3. Other Poultry Birds
- 10.2.3. Ruminants
- 10.2.3.1. Beef Cattle
- 10.2.3.2. Dairy Cattle
- 10.2.3.3. Other Ruminants
- 10.2.4. Swine
- 10.2.5. Other Animals
- 10.2.1. Aquaculture
- 10.1. Market Analysis, Insights and Forecast - by Sub Additive
- 11. Asia Pacific APAC Feed Amino Acids Industry Analysis, Insights and Forecast, 2020-2032
- 11.1. Market Analysis, Insights and Forecast - by Sub Additive
- 11.1.1. Lysine
- 11.1.2. Methionine
- 11.1.3. Threonine
- 11.1.4. Tryptophan
- 11.1.5. Other Amino Acids
- 11.2. Market Analysis, Insights and Forecast - by Animal
- 11.2.1. Aquaculture
- 11.2.1.1. By Sub Animal
- 11.2.1.1.1. Fish
- 11.2.1.1.2. Shrimp
- 11.2.1.1.3. Other Aquaculture Species
- 11.2.1.1. By Sub Animal
- 11.2.2. Poultry
- 11.2.2.1. Broiler
- 11.2.2.2. Layer
- 11.2.2.3. Other Poultry Birds
- 11.2.3. Ruminants
- 11.2.3.1. Beef Cattle
- 11.2.3.2. Dairy Cattle
- 11.2.3.3. Other Ruminants
- 11.2.4. Swine
- 11.2.5. Other Animals
- 11.2.1. Aquaculture
- 11.1. Market Analysis, Insights and Forecast - by Sub Additive
- 12. Competitive Analysis
- 12.1. Company Profiles
- 12.1.1 Prinova Group LLC
- 12.1.1.1. Company Overview
- 12.1.1.2. Products
- 12.1.1.3. Company Financials
- 12.1.1.4. SWOT Analysis
- 12.1.2 Novus International Inc
- 12.1.2.1. Company Overview
- 12.1.2.2. Products
- 12.1.2.3. Company Financials
- 12.1.2.4. SWOT Analysis
- 12.1.3 Kemin Industries
- 12.1.3.1. Company Overview
- 12.1.3.2. Products
- 12.1.3.3. Company Financials
- 12.1.3.4. SWOT Analysis
- 12.1.4 Evonik Industries AG
- 12.1.4.1. Company Overview
- 12.1.4.2. Products
- 12.1.4.3. Company Financials
- 12.1.4.4. SWOT Analysis
- 12.1.5 SHV (Nutreco NV
- 12.1.5.1. Company Overview
- 12.1.5.2. Products
- 12.1.5.3. Company Financials
- 12.1.5.4. SWOT Analysis
- 12.1.6 Ajinomoto Co Inc
- 12.1.6.1. Company Overview
- 12.1.6.2. Products
- 12.1.6.3. Company Financials
- 12.1.6.4. SWOT Analysis
- 12.1.7 Archer Daniel Midland Co
- 12.1.7.1. Company Overview
- 12.1.7.2. Products
- 12.1.7.3. Company Financials
- 12.1.7.4. SWOT Analysis
- 12.1.8 Lonza Group Ltd
- 12.1.8.1. Company Overview
- 12.1.8.2. Products
- 12.1.8.3. Company Financials
- 12.1.8.4. SWOT Analysis
- 12.1.9 Alltech Inc
- 12.1.9.1. Company Overview
- 12.1.9.2. Products
- 12.1.9.3. Company Financials
- 12.1.9.4. SWOT Analysis
- 12.1.10 Adisseo
- 12.1.10.1. Company Overview
- 12.1.10.2. Products
- 12.1.10.3. Company Financials
- 12.1.10.4. SWOT Analysis
- 12.1.1 Prinova Group LLC
- 12.2. Market Entropy
- 12.2.1 Company's Key Areas Served
- 12.2.2 Recent Developments
- 12.3. Company Market Share Analysis 2025
- 12.3.1 Top 5 Companies Market Share Analysis
- 12.3.2 Top 3 Companies Market Share Analysis
- 12.4. List of Potential Customers
- 13. Research Methodology
List of Figures
- Figure 1: Global APAC Feed Amino Acids Industry Revenue Breakdown (million, %) by Region 2025 & 2033
- Figure 2: North America APAC Feed Amino Acids Industry Revenue (million), by Sub Additive 2025 & 2033
- Figure 3: North America APAC Feed Amino Acids Industry Revenue Share (%), by Sub Additive 2025 & 2033
- Figure 4: North America APAC Feed Amino Acids Industry Revenue (million), by Animal 2025 & 2033
- Figure 5: North America APAC Feed Amino Acids Industry Revenue Share (%), by Animal 2025 & 2033
- Figure 6: North America APAC Feed Amino Acids Industry Revenue (million), by Country 2025 & 2033
- Figure 7: North America APAC Feed Amino Acids Industry Revenue Share (%), by Country 2025 & 2033
- Figure 8: South America APAC Feed Amino Acids Industry Revenue (million), by Sub Additive 2025 & 2033
- Figure 9: South America APAC Feed Amino Acids Industry Revenue Share (%), by Sub Additive 2025 & 2033
- Figure 10: South America APAC Feed Amino Acids Industry Revenue (million), by Animal 2025 & 2033
- Figure 11: South America APAC Feed Amino Acids Industry Revenue Share (%), by Animal 2025 & 2033
- Figure 12: South America APAC Feed Amino Acids Industry Revenue (million), by Country 2025 & 2033
- Figure 13: South America APAC Feed Amino Acids Industry Revenue Share (%), by Country 2025 & 2033
- Figure 14: Europe APAC Feed Amino Acids Industry Revenue (million), by Sub Additive 2025 & 2033
- Figure 15: Europe APAC Feed Amino Acids Industry Revenue Share (%), by Sub Additive 2025 & 2033
- Figure 16: Europe APAC Feed Amino Acids Industry Revenue (million), by Animal 2025 & 2033
- Figure 17: Europe APAC Feed Amino Acids Industry Revenue Share (%), by Animal 2025 & 2033
- Figure 18: Europe APAC Feed Amino Acids Industry Revenue (million), by Country 2025 & 2033
- Figure 19: Europe APAC Feed Amino Acids Industry Revenue Share (%), by Country 2025 & 2033
- Figure 20: Middle East & Africa APAC Feed Amino Acids Industry Revenue (million), by Sub Additive 2025 & 2033
- Figure 21: Middle East & Africa APAC Feed Amino Acids Industry Revenue Share (%), by Sub Additive 2025 & 2033
- Figure 22: Middle East & Africa APAC Feed Amino Acids Industry Revenue (million), by Animal 2025 & 2033
- Figure 23: Middle East & Africa APAC Feed Amino Acids Industry Revenue Share (%), by Animal 2025 & 2033
- Figure 24: Middle East & Africa APAC Feed Amino Acids Industry Revenue (million), by Country 2025 & 2033
- Figure 25: Middle East & Africa APAC Feed Amino Acids Industry Revenue Share (%), by Country 2025 & 2033
- Figure 26: Asia Pacific APAC Feed Amino Acids Industry Revenue (million), by Sub Additive 2025 & 2033
- Figure 27: Asia Pacific APAC Feed Amino Acids Industry Revenue Share (%), by Sub Additive 2025 & 2033
- Figure 28: Asia Pacific APAC Feed Amino Acids Industry Revenue (million), by Animal 2025 & 2033
- Figure 29: Asia Pacific APAC Feed Amino Acids Industry Revenue Share (%), by Animal 2025 & 2033
- Figure 30: Asia Pacific APAC Feed Amino Acids Industry Revenue (million), by Country 2025 & 2033
- Figure 31: Asia Pacific APAC Feed Amino Acids Industry Revenue Share (%), by Country 2025 & 2033
List of Tables
- Table 1: Global APAC Feed Amino Acids Industry Revenue million Forecast, by Sub Additive 2020 & 2033
- Table 2: Global APAC Feed Amino Acids Industry Revenue million Forecast, by Animal 2020 & 2033
- Table 3: Global APAC Feed Amino Acids Industry Revenue million Forecast, by Region 2020 & 2033
- Table 4: Global APAC Feed Amino Acids Industry Revenue million Forecast, by Sub Additive 2020 & 2033
- Table 5: Global APAC Feed Amino Acids Industry Revenue million Forecast, by Animal 2020 & 2033
- Table 6: Global APAC Feed Amino Acids Industry Revenue million Forecast, by Country 2020 & 2033
- Table 7: United States APAC Feed Amino Acids Industry Revenue (million) Forecast, by Application 2020 & 2033
- Table 8: Canada APAC Feed Amino Acids Industry Revenue (million) Forecast, by Application 2020 & 2033
- Table 9: Mexico APAC Feed Amino Acids Industry Revenue (million) Forecast, by Application 2020 & 2033
- Table 10: Global APAC Feed Amino Acids Industry Revenue million Forecast, by Sub Additive 2020 & 2033
- Table 11: Global APAC Feed Amino Acids Industry Revenue million Forecast, by Animal 2020 & 2033
- Table 12: Global APAC Feed Amino Acids Industry Revenue million Forecast, by Country 2020 & 2033
- Table 13: Brazil APAC Feed Amino Acids Industry Revenue (million) Forecast, by Application 2020 & 2033
- Table 14: Argentina APAC Feed Amino Acids Industry Revenue (million) Forecast, by Application 2020 & 2033
- Table 15: Rest of South America APAC Feed Amino Acids Industry Revenue (million) Forecast, by Application 2020 & 2033
- Table 16: Global APAC Feed Amino Acids Industry Revenue million Forecast, by Sub Additive 2020 & 2033
- Table 17: Global APAC Feed Amino Acids Industry Revenue million Forecast, by Animal 2020 & 2033
- Table 18: Global APAC Feed Amino Acids Industry Revenue million Forecast, by Country 2020 & 2033
- Table 19: United Kingdom APAC Feed Amino Acids Industry Revenue (million) Forecast, by Application 2020 & 2033
- Table 20: Germany APAC Feed Amino Acids Industry Revenue (million) Forecast, by Application 2020 & 2033
- Table 21: France APAC Feed Amino Acids Industry Revenue (million) Forecast, by Application 2020 & 2033
- Table 22: Italy APAC Feed Amino Acids Industry Revenue (million) Forecast, by Application 2020 & 2033
- Table 23: Spain APAC Feed Amino Acids Industry Revenue (million) Forecast, by Application 2020 & 2033
- Table 24: Russia APAC Feed Amino Acids Industry Revenue (million) Forecast, by Application 2020 & 2033
- Table 25: Benelux APAC Feed Amino Acids Industry Revenue (million) Forecast, by Application 2020 & 2033
- Table 26: Nordics APAC Feed Amino Acids Industry Revenue (million) Forecast, by Application 2020 & 2033
- Table 27: Rest of Europe APAC Feed Amino Acids Industry Revenue (million) Forecast, by Application 2020 & 2033
- Table 28: Global APAC Feed Amino Acids Industry Revenue million Forecast, by Sub Additive 2020 & 2033
- Table 29: Global APAC Feed Amino Acids Industry Revenue million Forecast, by Animal 2020 & 2033
- Table 30: Global APAC Feed Amino Acids Industry Revenue million Forecast, by Country 2020 & 2033
- Table 31: Turkey APAC Feed Amino Acids Industry Revenue (million) Forecast, by Application 2020 & 2033
- Table 32: Israel APAC Feed Amino Acids Industry Revenue (million) Forecast, by Application 2020 & 2033
- Table 33: GCC APAC Feed Amino Acids Industry Revenue (million) Forecast, by Application 2020 & 2033
- Table 34: North Africa APAC Feed Amino Acids Industry Revenue (million) Forecast, by Application 2020 & 2033
- Table 35: South Africa APAC Feed Amino Acids Industry Revenue (million) Forecast, by Application 2020 & 2033
- Table 36: Rest of Middle East & Africa APAC Feed Amino Acids Industry Revenue (million) Forecast, by Application 2020 & 2033
- Table 37: Global APAC Feed Amino Acids Industry Revenue million Forecast, by Sub Additive 2020 & 2033
- Table 38: Global APAC Feed Amino Acids Industry Revenue million Forecast, by Animal 2020 & 2033
- Table 39: Global APAC Feed Amino Acids Industry Revenue million Forecast, by Country 2020 & 2033
- Table 40: China APAC Feed Amino Acids Industry Revenue (million) Forecast, by Application 2020 & 2033
- Table 41: India APAC Feed Amino Acids Industry Revenue (million) Forecast, by Application 2020 & 2033
- Table 42: Japan APAC Feed Amino Acids Industry Revenue (million) Forecast, by Application 2020 & 2033
- Table 43: South Korea APAC Feed Amino Acids Industry Revenue (million) Forecast, by Application 2020 & 2033
- Table 44: ASEAN APAC Feed Amino Acids Industry Revenue (million) Forecast, by Application 2020 & 2033
- Table 45: Oceania APAC Feed Amino Acids Industry Revenue (million) Forecast, by Application 2020 & 2033
- Table 46: Rest of Asia Pacific APAC Feed Amino Acids Industry Revenue (million) Forecast, by Application 2020 & 2033
Frequently Asked Questions
1. What is the projected Compound Annual Growth Rate (CAGR) of the APAC Feed Amino Acids Industry?
The projected CAGR is approximately 8.2%.
2. Which companies are prominent players in the APAC Feed Amino Acids Industry?
Key companies in the market include Prinova Group LLC, Novus International Inc, Kemin Industries, Evonik Industries AG, SHV (Nutreco NV, Ajinomoto Co Inc, Archer Daniel Midland Co, Lonza Group Ltd, Alltech Inc, Adisseo.
3. What are the main segments of the APAC Feed Amino Acids Industry?
The market segments include Sub Additive, Animal.
4. Can you provide details about the market size?
The market size is estimated to be USD 13783.2 million as of 2022.
5. What are some drivers contributing to market growth?
Growing Livestock Population; Area Under Forage Production is Increasing; Increasing Demand for Animal Products.
6. What are the notable trends driving market growth?
OTHER KEY INDUSTRY TRENDS COVERED IN THE REPORT.
7. Are there any restraints impacting market growth?
Competition Amongst Industries and High Input Prices; Growing Shift Toward Vegan-Based Diet.
8. Can you provide examples of recent developments in the market?
January 2023: Novus International acquired the Biotech company Agrivida to develop new feed additives.October 2022: The partnership between Evonik and BASF allowed Evonik certain non-exclusive licensing rights to OpteinicsTM, a digital solution to improve comprehension and reduce the environmental impact of the animal protein and feed industries.September 2022: The new 180,000-ton liquid methionine plant of Adisseo in Nanjing, China, started production. The facility is one of the largest global liquid methionine production capacities that boosted the penetration of liquid methionine manufactured by the company in the global market.
9. What pricing options are available for accessing the report?
Pricing options include single-user, multi-user, and enterprise licenses priced at USD 3800, USD 4500, and USD 5800 respectively.
10. Is the market size provided in terms of value or volume?
The market size is provided in terms of value, measured in million.
11. Are there any specific market keywords associated with the report?
Yes, the market keyword associated with the report is "APAC Feed Amino Acids Industry," which aids in identifying and referencing the specific market segment covered.
12. How do I determine which pricing option suits my needs best?
The pricing options vary based on user requirements and access needs. Individual users may opt for single-user licenses, while businesses requiring broader access may choose multi-user or enterprise licenses for cost-effective access to the report.
13. Are there any additional resources or data provided in the APAC Feed Amino Acids Industry report?
While the report offers comprehensive insights, it's advisable to review the specific contents or supplementary materials provided to ascertain if additional resources or data are available.
14. How can I stay updated on further developments or reports in the APAC Feed Amino Acids Industry?
To stay informed about further developments, trends, and reports in the APAC Feed Amino Acids Industry, consider subscribing to industry newsletters, following relevant companies and organizations, or regularly checking reputable industry news sources and publications.
Methodology
Step 1 - Identification of Relevant Samples Size from Population Database


Step 2 - Approaches for Defining Global Market Size (Value, Volume* & Price*)

Note*: In applicable scenarios
Step 3 - Data Sources
Primary Research
- Web Analytics
- Survey Reports
- Research Institute
- Latest Research Reports
- Opinion Leaders
Secondary Research
- Annual Reports
- White Paper
- Latest Press Release
- Industry Association
- Paid Database
- Investor Presentations

Step 4 - Data Triangulation
Involves using different sources of information in order to increase the validity of a study
These sources are likely to be stakeholders in a program - participants, other researchers, program staff, other community members, and so on.
Then we put all data in single framework & apply various statistical tools to find out the dynamic on the market.
During the analysis stage, feedback from the stakeholder groups would be compared to determine areas of agreement as well as areas of divergence