

Key Insights
The 3D Time-of-Flight (ToF) technology market is experiencing robust growth, driven by increasing demand across diverse sectors. From consumer electronics like smartphones and augmented reality (AR) devices to industrial automation for robotics and precise measurements, and even medical applications like 3D imaging and gesture recognition, the versatility of ToF technology is fueling its expansion. The market's segmentation, encompassing built-in modules and independent products, further contributes to its dynamism. Major players like Microsoft, Apple (through PrimeSense acquisition), Sony (through SoftKinetic), and other established companies in the sensor and electronics industries are actively investing in research and development, fostering innovation and competition. This competitive landscape fuels continuous improvements in sensor accuracy, miniaturization, power efficiency, and cost reduction, making ToF technology increasingly accessible for wider adoption. Growth is particularly strong in the Asia-Pacific region, fueled by rapid technological advancements and increasing consumer electronics penetration.
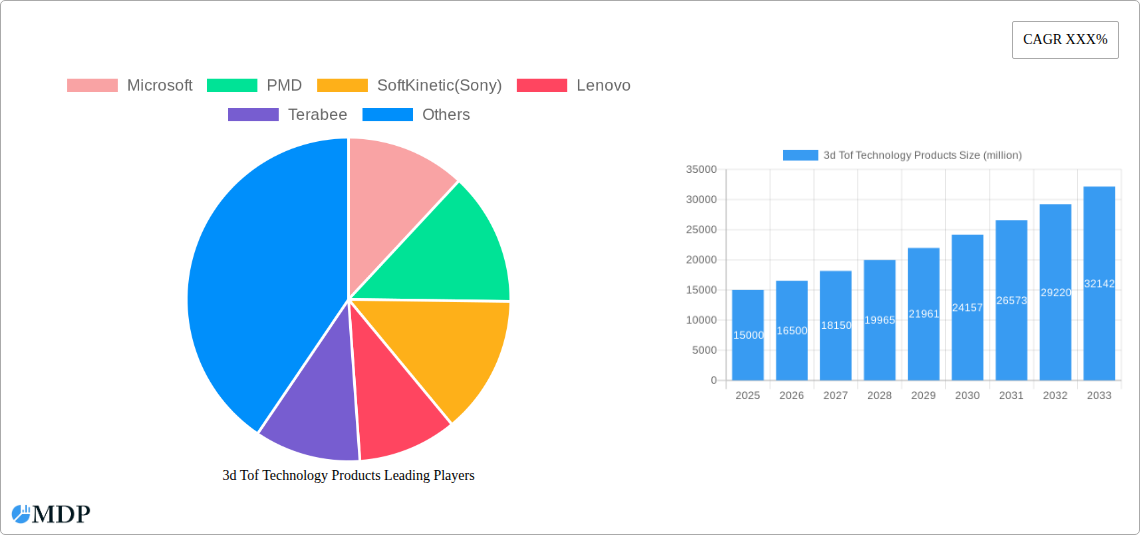
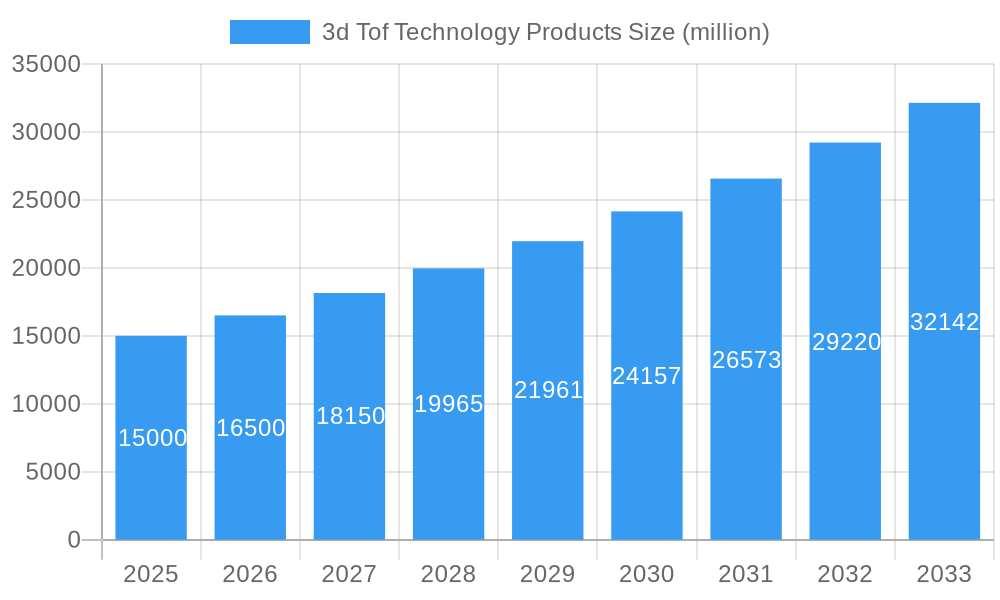
3d Tof Technology Products Market Size (In Billion)
While the market faces challenges such as the relatively higher cost compared to other sensing technologies and potential limitations in performance under challenging environmental conditions (e.g., direct sunlight), the ongoing technological advancements are effectively mitigating these constraints. The increasing integration of ToF sensors into various applications across different industries is a compelling indicator of sustained market growth. The forecast period (2025-2033) suggests a significant expansion, driven by the ongoing miniaturization trend that enables ToF integration into smaller and more power-efficient devices, coupled with increased demand for advanced 3D sensing capabilities across diverse sectors. This growth trajectory is further supported by continuous advancements in AI and machine learning, which enhance the capabilities of ToF-based applications. The market is expected to witness strong growth across all segments and regions, with Asia-Pacific and North America leading the charge.
3d Tof Technology Products Company Market Share
3D Time-of-Flight (ToF) Technology Products Market Report: 2019-2033
This comprehensive report provides an in-depth analysis of the global 3D Time-of-Flight (ToF) technology products market, offering invaluable insights for industry stakeholders, investors, and strategic decision-makers. With a study period spanning 2019-2033, a base year of 2025, and an estimated year of 2025, this report forecasts market trends until 2033, providing a clear picture of future growth potential. The market size is expected to reach xx million by 2033. This report analyzes key players including Microsoft, PMD, SoftKinetic (Sony), Lenovo, Terabee, IFM Electronic GmbH, PrimeSense (Apple), MESA (Heptagon), Melexis, Teledyne, Odos-imaging, LMI Technologies, Fastree3D, Infineon, Espros Photonics, and ADI, across key segments like consumer electronics, industrial automation, and medical applications, considering both built-in modules and independent products.
3D ToF Technology Products Market Dynamics & Concentration
The global 3D ToF technology products market exhibits a moderately consolidated structure, with several key players holding significant market share. Microsoft, Sony (through SoftKinetic acquisition), and Apple (via PrimeSense) have historically played crucial roles, shaping technological advancements and market trends. However, the market is also witnessing the emergence of new entrants and specialized players focusing on specific niche applications. Market concentration is influenced by factors such as technological innovation, intellectual property rights, and strategic partnerships.
The historical period (2019-2024) saw a xx million increase in market size, driven by increasing adoption in consumer electronics. The forecast period (2025-2033) projects continued expansion. Innovation in sensor technology, miniaturization, and improved cost-effectiveness are key drivers. Regulatory frameworks, particularly concerning data privacy and safety in certain applications, will continue to influence market dynamics. Product substitutes, such as structured light and stereo vision systems, pose competition but often lack the depth perception capabilities of ToF technologies.
- Market Share (2025): Microsoft - xx%; Sony (SoftKinetic) - xx%; Apple (PrimeSense) - xx%; Others - xx%
- M&A Activity (2019-2024): xx deals, primarily focused on consolidating technology and expanding market reach.
- End-User Trends: Increasing demand for advanced features in smartphones, automotive applications, and robotics are key market drivers.
3D ToF Technology Products Industry Trends & Analysis
The 3D ToF technology products market is experiencing robust growth, fueled by several key factors. The compound annual growth rate (CAGR) during the forecast period (2025-2033) is projected to be xx%. This growth is driven by increasing demand across various sectors, including consumer electronics, industrial automation, and healthcare. The rising adoption of smartphones with advanced 3D sensing capabilities is a significant contributor to market expansion. Furthermore, technological disruptions such as the development of more accurate and cost-effective ToF sensors and increased integration with artificial intelligence (AI) are transforming the industry landscape. Consumer preferences are shifting towards products with improved depth perception and augmented reality features. Competitive dynamics are characterized by fierce innovation and strategic acquisitions among leading players. Market penetration is also influenced by pricing strategies and the introduction of new applications.
Leading Markets & Segments in 3D ToF Technology Products
The consumer electronics segment currently dominates the 3D ToF technology products market, accounting for xx% of the total revenue in 2025. This is driven by the increasing integration of ToF sensors in smartphones for features like facial recognition, augmented reality applications, and improved photography. The industrial automation sector exhibits significant growth potential, driven by the need for precise and reliable object detection in applications such as robotics and automated quality control. The medical segment is also gaining traction with applications in advanced imaging, surgery, and diagnostics. Built-in modules represent a larger market segment compared to independent products.
- Dominant Region: North America and Asia-Pacific are the leading regions, exhibiting high adoption rates in consumer electronics and industrial automation.
- Key Drivers (Consumer Electronics): Increased smartphone penetration, demand for advanced features (AR/VR), and favorable economic conditions in major markets.
- Key Drivers (Industrial Automation): Automation in manufacturing, warehousing and logistics, and advancements in robotics.
- Key Drivers (Medical): Growing demand for minimally invasive surgery, advanced medical imaging and diagnostics.
3D ToF Technology Products Product Developments
Recent product innovations focus on improving sensor accuracy, reducing power consumption, and miniaturizing the technology for seamless integration into various devices. New applications are emerging in areas such as autonomous vehicles, gesture recognition, and 3D mapping. The competitive advantage lies in offering highly accurate, reliable, and cost-effective sensors that meet the specific requirements of different applications. Technological trends are moving towards higher resolution, longer range, and improved performance in challenging environments. Market fit is driven by successful integration into existing product lines and the creation of new applications leveraging ToF's unique capabilities.
Key Drivers of 3D ToF Technology Products Growth
The growth of the 3D ToF technology products market is propelled by several key factors. Technological advancements resulting in smaller, cheaper, and more accurate sensors are crucial. Government incentives and investments in related industries like AI and robotics contribute significantly to the market growth. Favorable economic conditions and the increasing demand for advanced features in consumer electronics further fuel market expansion. Furthermore, the development of new applications in diverse sectors creates additional growth opportunities. For example, the growing demand for autonomous vehicles fuels the need for highly accurate and reliable distance-sensing capabilities.
Challenges in the 3D ToF Technology Products Market
The 3D ToF technology market faces several challenges. High manufacturing costs and complex integration into existing systems can hinder wider adoption. The supply chain vulnerabilities and component shortages experienced in recent years are impacting production and time-to-market. Intense competition among existing and emerging players puts downward pressure on pricing and profit margins. Stringent regulatory requirements in certain industries, including data privacy and safety concerns, create additional hurdles for market expansion. These challenges, if not addressed, could affect the market's overall growth trajectory.
Emerging Opportunities in 3D ToF Technology Products
The long-term growth of the 3D ToF technology products market is poised to benefit from several emerging opportunities. Advancements in sensor technology, including increased resolution, improved accuracy, and wider operating ranges, will unlock new applications. Strategic partnerships and collaborations between technology providers and end-users will further accelerate market penetration. The expansion into new markets and applications, such as the automotive and industrial automation sectors, offers significant growth potential. The integration of AI and machine learning capabilities into ToF systems will create sophisticated solutions for various applications, generating further market expansion.
Leading Players in the 3D ToF Technology Products Sector
- Microsoft
- PMD
- SoftKinetic (Sony)
- Lenovo
- Terabee
- IFM Electronic GmbH
- PrimeSense (Apple)
- MESA (Heptagon)
- Melexis
- Teledyne
- Odos-imaging
- LMI Technologies
- Fastree3D
- Infineon
- Espros Photonics
- ADI
Key Milestones in 3D ToF Technology Products Industry
- 2010: Introduction of the first commercially viable 3D ToF sensors.
- 2012: Integration of 3D ToF technology into smartphones.
- 2015: Significant advancements in miniaturization and cost reduction.
- 2018: Increased adoption in automotive applications for driver-assistance systems.
- 2020: Growing use of ToF sensors in robotics and industrial automation.
- 2022: Development of high-resolution ToF sensors for improved depth perception.
Strategic Outlook for 3D ToF Technology Products Market
The 3D ToF technology products market holds immense future potential, driven by continuous technological innovation and expansion into new application areas. Strategic partnerships, focused research and development, and strategic acquisitions will shape the future competitive landscape. Companies focusing on product differentiation, cost reduction, and enhanced functionalities are poised for significant market success. The growing demand for advanced sensing capabilities across diverse industries ensures a sustained growth trajectory for the foreseeable future. The market is expected to witness further consolidation and increased competition, requiring companies to adopt agile and innovative strategies to maintain a competitive edge.
3d Tof Technology Products Segmentation
-
1. Application
- 1.1. Consumer Electronic
- 1.2. Industrial Automation
- 1.3. Medical
-
2. Type
- 2.1. Built-in Module
- 2.2. Independent Product
3d Tof Technology Products Segmentation By Geography
-
1. North America
- 1.1. United States
- 1.2. Canada
- 1.3. Mexico
-
2. South America
- 2.1. Brazil
- 2.2. Argentina
- 2.3. Rest of South America
-
3. Europe
- 3.1. United Kingdom
- 3.2. Germany
- 3.3. France
- 3.4. Italy
- 3.5. Spain
- 3.6. Russia
- 3.7. Benelux
- 3.8. Nordics
- 3.9. Rest of Europe
-
4. Middle East & Africa
- 4.1. Turkey
- 4.2. Israel
- 4.3. GCC
- 4.4. North Africa
- 4.5. South Africa
- 4.6. Rest of Middle East & Africa
-
5. Asia Pacific
- 5.1. China
- 5.2. India
- 5.3. Japan
- 5.4. South Korea
- 5.5. ASEAN
- 5.6. Oceania
- 5.7. Rest of Asia Pacific
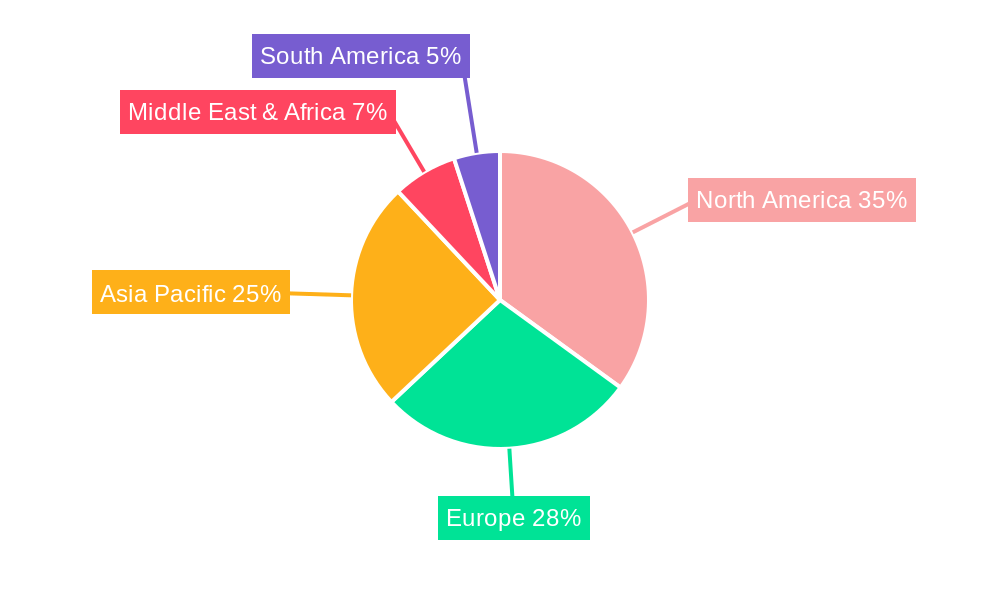
3d Tof Technology Products Regional Market Share
Geographic Coverage of 3d Tof Technology Products
3d Tof Technology Products REPORT HIGHLIGHTS
| Aspects | Details |
|---|---|
| Study Period | 2020-2034 |
| Base Year | 2025 |
| Estimated Year | 2026 |
| Forecast Period | 2026-2034 |
| Historical Period | 2020-2025 |
| Growth Rate | CAGR of XXX% from 2020-2034 |
| Segmentation |
|
Table of Contents
- 1. Introduction
- 1.1. Research Scope
- 1.2. Market Segmentation
- 1.3. Research Methodology
- 1.4. Definitions and Assumptions
- 2. Executive Summary
- 2.1. Introduction
- 3. Market Dynamics
- 3.1. Introduction
- 3.2. Market Drivers
- 3.3. Market Restrains
- 3.4. Market Trends
- 4. Market Factor Analysis
- 4.1. Porters Five Forces
- 4.2. Supply/Value Chain
- 4.3. PESTEL analysis
- 4.4. Market Entropy
- 4.5. Patent/Trademark Analysis
- 5. Global 3d Tof Technology Products Analysis, Insights and Forecast, 2020-2032
- 5.1. Market Analysis, Insights and Forecast - by Application
- 5.1.1. Consumer Electronic
- 5.1.2. Industrial Automation
- 5.1.3. Medical
- 5.2. Market Analysis, Insights and Forecast - by Type
- 5.2.1. Built-in Module
- 5.2.2. Independent Product
- 5.3. Market Analysis, Insights and Forecast - by Region
- 5.3.1. North America
- 5.3.2. South America
- 5.3.3. Europe
- 5.3.4. Middle East & Africa
- 5.3.5. Asia Pacific
- 5.1. Market Analysis, Insights and Forecast - by Application
- 6. North America 3d Tof Technology Products Analysis, Insights and Forecast, 2020-2032
- 6.1. Market Analysis, Insights and Forecast - by Application
- 6.1.1. Consumer Electronic
- 6.1.2. Industrial Automation
- 6.1.3. Medical
- 6.2. Market Analysis, Insights and Forecast - by Type
- 6.2.1. Built-in Module
- 6.2.2. Independent Product
- 6.1. Market Analysis, Insights and Forecast - by Application
- 7. South America 3d Tof Technology Products Analysis, Insights and Forecast, 2020-2032
- 7.1. Market Analysis, Insights and Forecast - by Application
- 7.1.1. Consumer Electronic
- 7.1.2. Industrial Automation
- 7.1.3. Medical
- 7.2. Market Analysis, Insights and Forecast - by Type
- 7.2.1. Built-in Module
- 7.2.2. Independent Product
- 7.1. Market Analysis, Insights and Forecast - by Application
- 8. Europe 3d Tof Technology Products Analysis, Insights and Forecast, 2020-2032
- 8.1. Market Analysis, Insights and Forecast - by Application
- 8.1.1. Consumer Electronic
- 8.1.2. Industrial Automation
- 8.1.3. Medical
- 8.2. Market Analysis, Insights and Forecast - by Type
- 8.2.1. Built-in Module
- 8.2.2. Independent Product
- 8.1. Market Analysis, Insights and Forecast - by Application
- 9. Middle East & Africa 3d Tof Technology Products Analysis, Insights and Forecast, 2020-2032
- 9.1. Market Analysis, Insights and Forecast - by Application
- 9.1.1. Consumer Electronic
- 9.1.2. Industrial Automation
- 9.1.3. Medical
- 9.2. Market Analysis, Insights and Forecast - by Type
- 9.2.1. Built-in Module
- 9.2.2. Independent Product
- 9.1. Market Analysis, Insights and Forecast - by Application
- 10. Asia Pacific 3d Tof Technology Products Analysis, Insights and Forecast, 2020-2032
- 10.1. Market Analysis, Insights and Forecast - by Application
- 10.1.1. Consumer Electronic
- 10.1.2. Industrial Automation
- 10.1.3. Medical
- 10.2. Market Analysis, Insights and Forecast - by Type
- 10.2.1. Built-in Module
- 10.2.2. Independent Product
- 10.1. Market Analysis, Insights and Forecast - by Application
- 11. Competitive Analysis
- 11.1. Global Market Share Analysis 2025
- 11.2. Company Profiles
- 11.2.1 Microsoft
- 11.2.1.1. Overview
- 11.2.1.2. Products
- 11.2.1.3. SWOT Analysis
- 11.2.1.4. Recent Developments
- 11.2.1.5. Financials (Based on Availability)
- 11.2.2 PMD
- 11.2.2.1. Overview
- 11.2.2.2. Products
- 11.2.2.3. SWOT Analysis
- 11.2.2.4. Recent Developments
- 11.2.2.5. Financials (Based on Availability)
- 11.2.3 SoftKinetic(Sony)
- 11.2.3.1. Overview
- 11.2.3.2. Products
- 11.2.3.3. SWOT Analysis
- 11.2.3.4. Recent Developments
- 11.2.3.5. Financials (Based on Availability)
- 11.2.4 Lenovo
- 11.2.4.1. Overview
- 11.2.4.2. Products
- 11.2.4.3. SWOT Analysis
- 11.2.4.4. Recent Developments
- 11.2.4.5. Financials (Based on Availability)
- 11.2.5 Terabee
- 11.2.5.1. Overview
- 11.2.5.2. Products
- 11.2.5.3. SWOT Analysis
- 11.2.5.4. Recent Developments
- 11.2.5.5. Financials (Based on Availability)
- 11.2.6 IFM Electronic GmbH
- 11.2.6.1. Overview
- 11.2.6.2. Products
- 11.2.6.3. SWOT Analysis
- 11.2.6.4. Recent Developments
- 11.2.6.5. Financials (Based on Availability)
- 11.2.7 PrimeSense (Apple)
- 11.2.7.1. Overview
- 11.2.7.2. Products
- 11.2.7.3. SWOT Analysis
- 11.2.7.4. Recent Developments
- 11.2.7.5. Financials (Based on Availability)
- 11.2.8 MESA (Heptagon)
- 11.2.8.1. Overview
- 11.2.8.2. Products
- 11.2.8.3. SWOT Analysis
- 11.2.8.4. Recent Developments
- 11.2.8.5. Financials (Based on Availability)
- 11.2.9 Melexis
- 11.2.9.1. Overview
- 11.2.9.2. Products
- 11.2.9.3. SWOT Analysis
- 11.2.9.4. Recent Developments
- 11.2.9.5. Financials (Based on Availability)
- 11.2.10 Teledyne
- 11.2.10.1. Overview
- 11.2.10.2. Products
- 11.2.10.3. SWOT Analysis
- 11.2.10.4. Recent Developments
- 11.2.10.5. Financials (Based on Availability)
- 11.2.11 Odos-imaging
- 11.2.11.1. Overview
- 11.2.11.2. Products
- 11.2.11.3. SWOT Analysis
- 11.2.11.4. Recent Developments
- 11.2.11.5. Financials (Based on Availability)
- 11.2.12 LMI Technologies
- 11.2.12.1. Overview
- 11.2.12.2. Products
- 11.2.12.3. SWOT Analysis
- 11.2.12.4. Recent Developments
- 11.2.12.5. Financials (Based on Availability)
- 11.2.13 Fastree3D
- 11.2.13.1. Overview
- 11.2.13.2. Products
- 11.2.13.3. SWOT Analysis
- 11.2.13.4. Recent Developments
- 11.2.13.5. Financials (Based on Availability)
- 11.2.14 Infineon
- 11.2.14.1. Overview
- 11.2.14.2. Products
- 11.2.14.3. SWOT Analysis
- 11.2.14.4. Recent Developments
- 11.2.14.5. Financials (Based on Availability)
- 11.2.15 Espros Photonics
- 11.2.15.1. Overview
- 11.2.15.2. Products
- 11.2.15.3. SWOT Analysis
- 11.2.15.4. Recent Developments
- 11.2.15.5. Financials (Based on Availability)
- 11.2.16 ADI
- 11.2.16.1. Overview
- 11.2.16.2. Products
- 11.2.16.3. SWOT Analysis
- 11.2.16.4. Recent Developments
- 11.2.16.5. Financials (Based on Availability)
- 11.2.1 Microsoft
List of Figures
- Figure 1: Global 3d Tof Technology Products Revenue Breakdown (million, %) by Region 2025 & 2033
- Figure 2: North America 3d Tof Technology Products Revenue (million), by Application 2025 & 2033
- Figure 3: North America 3d Tof Technology Products Revenue Share (%), by Application 2025 & 2033
- Figure 4: North America 3d Tof Technology Products Revenue (million), by Type 2025 & 2033
- Figure 5: North America 3d Tof Technology Products Revenue Share (%), by Type 2025 & 2033
- Figure 6: North America 3d Tof Technology Products Revenue (million), by Country 2025 & 2033
- Figure 7: North America 3d Tof Technology Products Revenue Share (%), by Country 2025 & 2033
- Figure 8: South America 3d Tof Technology Products Revenue (million), by Application 2025 & 2033
- Figure 9: South America 3d Tof Technology Products Revenue Share (%), by Application 2025 & 2033
- Figure 10: South America 3d Tof Technology Products Revenue (million), by Type 2025 & 2033
- Figure 11: South America 3d Tof Technology Products Revenue Share (%), by Type 2025 & 2033
- Figure 12: South America 3d Tof Technology Products Revenue (million), by Country 2025 & 2033
- Figure 13: South America 3d Tof Technology Products Revenue Share (%), by Country 2025 & 2033
- Figure 14: Europe 3d Tof Technology Products Revenue (million), by Application 2025 & 2033
- Figure 15: Europe 3d Tof Technology Products Revenue Share (%), by Application 2025 & 2033
- Figure 16: Europe 3d Tof Technology Products Revenue (million), by Type 2025 & 2033
- Figure 17: Europe 3d Tof Technology Products Revenue Share (%), by Type 2025 & 2033
- Figure 18: Europe 3d Tof Technology Products Revenue (million), by Country 2025 & 2033
- Figure 19: Europe 3d Tof Technology Products Revenue Share (%), by Country 2025 & 2033
- Figure 20: Middle East & Africa 3d Tof Technology Products Revenue (million), by Application 2025 & 2033
- Figure 21: Middle East & Africa 3d Tof Technology Products Revenue Share (%), by Application 2025 & 2033
- Figure 22: Middle East & Africa 3d Tof Technology Products Revenue (million), by Type 2025 & 2033
- Figure 23: Middle East & Africa 3d Tof Technology Products Revenue Share (%), by Type 2025 & 2033
- Figure 24: Middle East & Africa 3d Tof Technology Products Revenue (million), by Country 2025 & 2033
- Figure 25: Middle East & Africa 3d Tof Technology Products Revenue Share (%), by Country 2025 & 2033
- Figure 26: Asia Pacific 3d Tof Technology Products Revenue (million), by Application 2025 & 2033
- Figure 27: Asia Pacific 3d Tof Technology Products Revenue Share (%), by Application 2025 & 2033
- Figure 28: Asia Pacific 3d Tof Technology Products Revenue (million), by Type 2025 & 2033
- Figure 29: Asia Pacific 3d Tof Technology Products Revenue Share (%), by Type 2025 & 2033
- Figure 30: Asia Pacific 3d Tof Technology Products Revenue (million), by Country 2025 & 2033
- Figure 31: Asia Pacific 3d Tof Technology Products Revenue Share (%), by Country 2025 & 2033
List of Tables
- Table 1: Global 3d Tof Technology Products Revenue million Forecast, by Application 2020 & 2033
- Table 2: Global 3d Tof Technology Products Revenue million Forecast, by Type 2020 & 2033
- Table 3: Global 3d Tof Technology Products Revenue million Forecast, by Region 2020 & 2033
- Table 4: Global 3d Tof Technology Products Revenue million Forecast, by Application 2020 & 2033
- Table 5: Global 3d Tof Technology Products Revenue million Forecast, by Type 2020 & 2033
- Table 6: Global 3d Tof Technology Products Revenue million Forecast, by Country 2020 & 2033
- Table 7: United States 3d Tof Technology Products Revenue (million) Forecast, by Application 2020 & 2033
- Table 8: Canada 3d Tof Technology Products Revenue (million) Forecast, by Application 2020 & 2033
- Table 9: Mexico 3d Tof Technology Products Revenue (million) Forecast, by Application 2020 & 2033
- Table 10: Global 3d Tof Technology Products Revenue million Forecast, by Application 2020 & 2033
- Table 11: Global 3d Tof Technology Products Revenue million Forecast, by Type 2020 & 2033
- Table 12: Global 3d Tof Technology Products Revenue million Forecast, by Country 2020 & 2033
- Table 13: Brazil 3d Tof Technology Products Revenue (million) Forecast, by Application 2020 & 2033
- Table 14: Argentina 3d Tof Technology Products Revenue (million) Forecast, by Application 2020 & 2033
- Table 15: Rest of South America 3d Tof Technology Products Revenue (million) Forecast, by Application 2020 & 2033
- Table 16: Global 3d Tof Technology Products Revenue million Forecast, by Application 2020 & 2033
- Table 17: Global 3d Tof Technology Products Revenue million Forecast, by Type 2020 & 2033
- Table 18: Global 3d Tof Technology Products Revenue million Forecast, by Country 2020 & 2033
- Table 19: United Kingdom 3d Tof Technology Products Revenue (million) Forecast, by Application 2020 & 2033
- Table 20: Germany 3d Tof Technology Products Revenue (million) Forecast, by Application 2020 & 2033
- Table 21: France 3d Tof Technology Products Revenue (million) Forecast, by Application 2020 & 2033
- Table 22: Italy 3d Tof Technology Products Revenue (million) Forecast, by Application 2020 & 2033
- Table 23: Spain 3d Tof Technology Products Revenue (million) Forecast, by Application 2020 & 2033
- Table 24: Russia 3d Tof Technology Products Revenue (million) Forecast, by Application 2020 & 2033
- Table 25: Benelux 3d Tof Technology Products Revenue (million) Forecast, by Application 2020 & 2033
- Table 26: Nordics 3d Tof Technology Products Revenue (million) Forecast, by Application 2020 & 2033
- Table 27: Rest of Europe 3d Tof Technology Products Revenue (million) Forecast, by Application 2020 & 2033
- Table 28: Global 3d Tof Technology Products Revenue million Forecast, by Application 2020 & 2033
- Table 29: Global 3d Tof Technology Products Revenue million Forecast, by Type 2020 & 2033
- Table 30: Global 3d Tof Technology Products Revenue million Forecast, by Country 2020 & 2033
- Table 31: Turkey 3d Tof Technology Products Revenue (million) Forecast, by Application 2020 & 2033
- Table 32: Israel 3d Tof Technology Products Revenue (million) Forecast, by Application 2020 & 2033
- Table 33: GCC 3d Tof Technology Products Revenue (million) Forecast, by Application 2020 & 2033
- Table 34: North Africa 3d Tof Technology Products Revenue (million) Forecast, by Application 2020 & 2033
- Table 35: South Africa 3d Tof Technology Products Revenue (million) Forecast, by Application 2020 & 2033
- Table 36: Rest of Middle East & Africa 3d Tof Technology Products Revenue (million) Forecast, by Application 2020 & 2033
- Table 37: Global 3d Tof Technology Products Revenue million Forecast, by Application 2020 & 2033
- Table 38: Global 3d Tof Technology Products Revenue million Forecast, by Type 2020 & 2033
- Table 39: Global 3d Tof Technology Products Revenue million Forecast, by Country 2020 & 2033
- Table 40: China 3d Tof Technology Products Revenue (million) Forecast, by Application 2020 & 2033
- Table 41: India 3d Tof Technology Products Revenue (million) Forecast, by Application 2020 & 2033
- Table 42: Japan 3d Tof Technology Products Revenue (million) Forecast, by Application 2020 & 2033
- Table 43: South Korea 3d Tof Technology Products Revenue (million) Forecast, by Application 2020 & 2033
- Table 44: ASEAN 3d Tof Technology Products Revenue (million) Forecast, by Application 2020 & 2033
- Table 45: Oceania 3d Tof Technology Products Revenue (million) Forecast, by Application 2020 & 2033
- Table 46: Rest of Asia Pacific 3d Tof Technology Products Revenue (million) Forecast, by Application 2020 & 2033
Frequently Asked Questions
1. What is the projected Compound Annual Growth Rate (CAGR) of the 3d Tof Technology Products?
The projected CAGR is approximately XXX%.
2. Which companies are prominent players in the 3d Tof Technology Products?
Key companies in the market include Microsoft, PMD, SoftKinetic(Sony), Lenovo, Terabee, IFM Electronic GmbH, PrimeSense (Apple), MESA (Heptagon), Melexis, Teledyne, Odos-imaging, LMI Technologies, Fastree3D, Infineon, Espros Photonics, ADI.
3. What are the main segments of the 3d Tof Technology Products?
The market segments include Application, Type.
4. Can you provide details about the market size?
The market size is estimated to be USD XXX million as of 2022.
5. What are some drivers contributing to market growth?
N/A
6. What are the notable trends driving market growth?
N/A
7. Are there any restraints impacting market growth?
N/A
8. Can you provide examples of recent developments in the market?
N/A
9. What pricing options are available for accessing the report?
Pricing options include single-user, multi-user, and enterprise licenses priced at USD 2900.00, USD 4350.00, and USD 5800.00 respectively.
10. Is the market size provided in terms of value or volume?
The market size is provided in terms of value, measured in million.
11. Are there any specific market keywords associated with the report?
Yes, the market keyword associated with the report is "3d Tof Technology Products," which aids in identifying and referencing the specific market segment covered.
12. How do I determine which pricing option suits my needs best?
The pricing options vary based on user requirements and access needs. Individual users may opt for single-user licenses, while businesses requiring broader access may choose multi-user or enterprise licenses for cost-effective access to the report.
13. Are there any additional resources or data provided in the 3d Tof Technology Products report?
While the report offers comprehensive insights, it's advisable to review the specific contents or supplementary materials provided to ascertain if additional resources or data are available.
14. How can I stay updated on further developments or reports in the 3d Tof Technology Products?
To stay informed about further developments, trends, and reports in the 3d Tof Technology Products, consider subscribing to industry newsletters, following relevant companies and organizations, or regularly checking reputable industry news sources and publications.
Methodology
Step 1 - Identification of Relevant Samples Size from Population Database


Step 2 - Approaches for Defining Global Market Size (Value, Volume* & Price*)

Note*: In applicable scenarios
Step 3 - Data Sources
Primary Research
- Web Analytics
- Survey Reports
- Research Institute
- Latest Research Reports
- Opinion Leaders
Secondary Research
- Annual Reports
- White Paper
- Latest Press Release
- Industry Association
- Paid Database
- Investor Presentations

Step 4 - Data Triangulation
Involves using different sources of information in order to increase the validity of a study
These sources are likely to be stakeholders in a program - participants, other researchers, program staff, other community members, and so on.
Then we put all data in single framework & apply various statistical tools to find out the dynamic on the market.
During the analysis stage, feedback from the stakeholder groups would be compared to determine areas of agreement as well as areas of divergence