

Key Insights
The Wireless Slicing market is poised for explosive growth, with an estimated market size of $6.1 billion in 2025 and a remarkable Compound Annual Growth Rate (CAGR) of 34.2% projected through 2033. This surge is primarily driven by the insatiable demand for tailored network capabilities across various industries, notably the Communications Industry and Artificial Intelligence. The advent of 5G and beyond technologies has unlocked the potential for network slicing, enabling the creation of distinct virtual networks on a shared physical infrastructure. This allows for customized quality of service (QoS), security, and latency, catering to the specific needs of diverse applications, from ultra-reliable low-latency communications (URLLC) for industrial automation to enhanced mobile broadband (eMBB) for immersive experiences. The increasing adoption of AI applications, which often require dedicated network resources for real-time data processing and model training, is a significant catalyst for this market's expansion. Furthermore, the growing trend towards edge computing, where processing power is brought closer to the data source, further amplifies the need for efficient and flexible network resource allocation offered by wireless slicing.
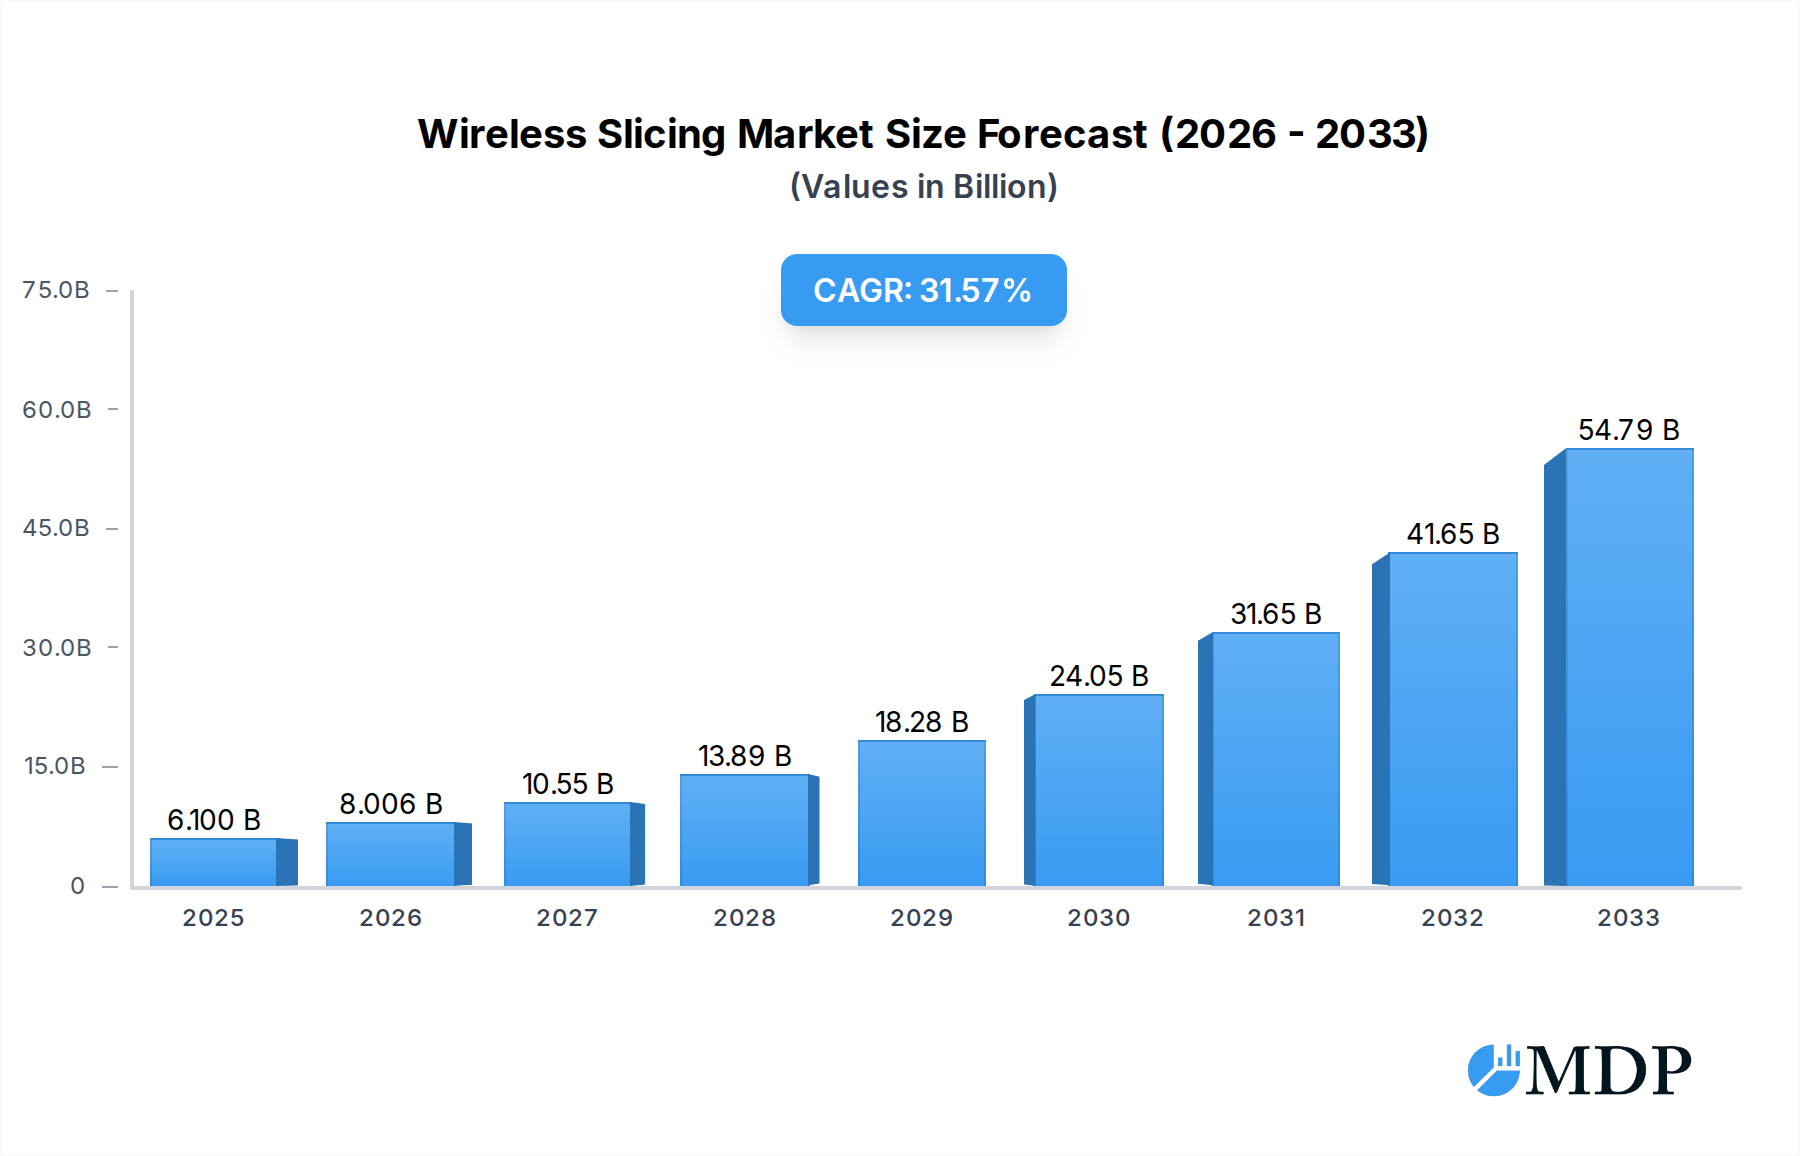
Wireless Slicing Market Size (In Billion)
The market is segmented into Separate Slices and Shared Slices, with a growing emphasis on the latter due to its cost-effectiveness and efficient resource utilization. Key players like Ericsson, Nokia, Ciena, Huawei, and ZTE are at the forefront, investing heavily in R&D to develop advanced slicing solutions and forge strategic partnerships. While the market is characterized by immense opportunities, certain restraints, such as the complexity of orchestration and management of multiple slices, interoperability challenges between different vendor solutions, and the need for robust security frameworks to prevent slice interference, need to be addressed. Geographically, Asia Pacific, led by China, is expected to dominate the market, driven by aggressive 5G deployments and a strong focus on AI integration. North America and Europe are also significant markets, with ongoing investments in network upgrades and the development of innovative use cases for wireless slicing.

Wireless Slicing Company Market Share
Unleash the Future of Connectivity: Comprehensive Wireless Slicing Market Report (2019-2033)
This in-depth report delves into the burgeoning Wireless Slicing market, a critical technology enabling the diversification and optimization of cellular networks. With the global wireless slicing market projected to reach one hundred billion by 2033, driven by the exponential growth of the Communications Industry and Artificial Intelligence, this analysis provides indispensable insights for industry stakeholders. Our study covers the historical period of 2019–2024, the base year of 2025, and a comprehensive forecast period extending from 2025–2033, with an estimated year of 2025. This report is meticulously crafted for immediate use, offering actionable strategies and a clear understanding of the market landscape.
Wireless Slicing Market Dynamics & Concentration
The wireless slicing market exhibits a dynamic and evolving concentration, with key players strategically positioning themselves to capitalize on the demand for network virtualization and specialized connectivity. Innovation drivers are primarily fueled by the increasing need for differentiated services, ranging from ultra-low latency for critical applications to high bandwidth for media streaming. Regulatory frameworks are gradually adapting to accommodate the complexities of network slicing, fostering an environment conducive to deployment. Product substitutes, while limited in their ability to replicate the granular control offered by slicing, include advanced QoS mechanisms within traditional networks. End-user trends are shifting towards solutions that promise guaranteed performance and tailored network experiences, particularly within enterprise and industrial settings. Mergers and acquisitions (M&A) activity is a significant indicator of market consolidation and strategic partnerships, with an estimated ten billion in M&A deal counts anticipated over the study period. The market share of leading providers is steadily increasing as network operators invest in 5G Standalone deployments.
Wireless Slicing Industry Trends & Analysis
The wireless slicing industry is on a trajectory of remarkable expansion, driven by a confluence of technological advancements and burgeoning market demands. The projected Compound Annual Growth Rate (CAGR) for the wireless slicing market is a robust twenty-five percent from 2025 to 2033. This growth is propelled by the increasing adoption of 5G and future 6G technologies, which inherently support network virtualization and the creation of dedicated, logically separated network slices. These slices cater to a diverse range of applications, from the high-bandwidth demands of the Communications Industry, including video streaming and augmented reality, to the ultra-low latency requirements of Artificial Intelligence applications such as autonomous driving and industrial automation. The evolution of cloud-native architectures and edge computing further enhances the feasibility and efficiency of wireless slicing, enabling localized processing and reduced latency.
Consumer preferences are increasingly dictating the need for customized network experiences. Users expect guaranteed Quality of Service (QoS) for their specific needs, whether it's seamless gaming, reliable remote work connectivity, or mission-critical industrial communications. This paradigm shift from a one-size-fits-all network to a highly personalized and optimized connectivity model is a fundamental driver of market penetration. The competitive dynamics within the industry are characterized by intense innovation, with established telecommunications equipment manufacturers and emerging technology providers vying for market leadership. Strategic partnerships between network operators, technology vendors, and application developers are crucial for fostering a robust ecosystem and accelerating the development and deployment of advanced wireless slicing solutions. The market penetration of advanced slicing capabilities is expected to reach forty percent by 2033.
Leading Markets & Segments in Wireless Slicing
The Communications Industry stands as the dominant region for wireless slicing adoption, driven by the foundational need for flexible and high-performance networks to support an ever-expanding array of communication services. Within this sector, the demand for Separate Slices is particularly pronounced, allowing operators to dedicate distinct network resources for specialized services such as ultra-reliable low-latency communication (URLLC) for critical infrastructure and enhanced mobile broadband (eMBB) for consumer applications. The economic policies and infrastructure investments by governments worldwide, aimed at facilitating 5G deployments and fostering digital transformation, are key drivers of this dominance.
Furthermore, the burgeoning field of Artificial Intelligence is a significant growth accelerator for wireless slicing. The requirement for massive data processing, real-time analytics, and consistent, low-latency connections for AI-powered applications makes network slicing an indispensable technology. Countries with robust AI research and development ecosystems are witnessing increased adoption of wireless slicing to support advanced AI initiatives. The United States and China are anticipated to be leading markets, owing to their significant investments in 5G infrastructure and AI innovation.
The type of slicing also dictates market dynamics. While Shared Slice models offer cost efficiencies and flexibility for less demanding applications, the increasing complexity and criticality of new use cases are driving the demand for Separate Slices, offering unparalleled control and guaranteed performance. Infrastructure development, including the rollout of 5G standalone networks and the expansion of edge computing facilities, is crucial for enabling both slicing types. The telecommunications sector's strategic focus on monetizing new services through differentiated network capabilities further solidifies the dominance of wireless slicing.
Wireless Slicing Product Developments
Product developments in wireless slicing are focused on enhancing the granularity of network control, simplifying slice management, and improving interoperability. Innovations include advanced orchestration platforms that enable automated slice provisioning, dynamic resource allocation, and end-to-end slice lifecycle management. Competitive advantages are being gained through the integration of AI and machine learning for predictive network performance optimization and fault detection within slices. The market is witnessing the emergence of specialized slicing solutions tailored for diverse industry verticals, such as manufacturing, healthcare, and logistics, offering optimized connectivity for specific operational requirements.
Key Drivers of Wireless Slicing Growth
The primary growth drivers for wireless slicing are deeply rooted in technological advancements and evolving market demands. The widespread deployment of 5G networks and the anticipated advent of 6G provide the foundational infrastructure for advanced network slicing capabilities. The increasing demand for differentiated services, characterized by varying requirements for bandwidth, latency, and reliability, fuels the need for dedicated network slices. Furthermore, the rapid growth of IoT devices and the explosion of data generated by connected systems necessitate efficient resource allocation and management, which wireless slicing effectively addresses. Regulatory support and industry standardization efforts are also pivotal in accelerating adoption.
Challenges in the Wireless Slicing Market
Despite its immense potential, the wireless slicing market faces several challenges. The complexity of network orchestration and management can be a significant barrier, requiring sophisticated tools and skilled personnel. Interoperability issues between different vendor solutions and across various network domains can hinder seamless deployment. Security concerns related to slice isolation and data privacy within a shared infrastructure also require robust solutions. Furthermore, the high initial investment costs associated with deploying and managing slicing infrastructure can be a restraint for some operators. Regulatory uncertainty and the evolving nature of standards can also pose challenges.
Emerging Opportunities in Wireless Slicing
Emerging opportunities in wireless slicing are abundant, driven by technological breakthroughs and strategic market expansion. The integration of AI and machine learning into slicing management platforms offers significant potential for autonomous network operations and predictive optimization. Strategic partnerships between network operators, cloud providers, and enterprise customers are creating new revenue streams through the provision of Network-as-a-Service (NaaS) offerings underpinned by wireless slicing. The expansion of slicing capabilities to support enterprise private networks and critical communications infrastructure presents substantial growth avenues. Furthermore, the development of multi-access edge computing (MEC) combined with network slicing opens doors for low-latency, real-time applications across various industries.
Leading Players in the Wireless Slicing Sector
- Ericsson
- NOKIA
- Ciena
- MEF
- Huawei
- ZTE
- FiberHome Communications
- China Telecom
- Tsinghua Unigroup
- StarNet Ruijie
- Tongding Internet
- Wangsu Technology
- Huaxing Entrepreneurship
- Sinnet
- Gongjin shares
Key Milestones in Wireless Slicing Industry
- 2019: Initial standardization of 5G network slicing capabilities by 3GPP.
- 2020: First commercial deployments of 5G Standalone networks featuring basic network slicing functionalities.
- 2021: Increased focus on enterprise-specific slicing solutions for industrial IoT and private networks.
- 2022: Advancements in orchestration and management platforms for automated slice provisioning and dynamic resource allocation.
- 2023: Growing interest in slicing for augmented reality (AR) and virtual reality (VR) applications.
- 2024: Development of multi-operator and cross-domain slicing capabilities to enhance flexibility.
Strategic Outlook for Wireless Slicing Market
The strategic outlook for the wireless slicing market is overwhelmingly positive, characterized by continuous innovation and expanding applications. The increasing maturity of 5G networks and the ongoing development of 6G technologies will further solidify the importance of network slicing as a fundamental enabler of advanced services. Key growth accelerators include the ongoing digital transformation across industries, the proliferation of AI-driven applications, and the growing demand for personalized and guaranteed connectivity experiences. Strategic opportunities lie in developing robust security frameworks, fostering ecosystem collaboration, and creating innovative business models that leverage the capabilities of sliced networks to unlock new revenue streams and enhance customer value.
Wireless Slicing Segmentation
-
1. Application
- 1.1. Communications Industry
- 1.2. Artificial Intelligence
-
2. Type
- 2.1. Separate Slices
- 2.2. Shared Slice
Wireless Slicing Segmentation By Geography
-
1. North America
- 1.1. United States
- 1.2. Canada
- 1.3. Mexico
-
2. South America
- 2.1. Brazil
- 2.2. Argentina
- 2.3. Rest of South America
-
3. Europe
- 3.1. United Kingdom
- 3.2. Germany
- 3.3. France
- 3.4. Italy
- 3.5. Spain
- 3.6. Russia
- 3.7. Benelux
- 3.8. Nordics
- 3.9. Rest of Europe
-
4. Middle East & Africa
- 4.1. Turkey
- 4.2. Israel
- 4.3. GCC
- 4.4. North Africa
- 4.5. South Africa
- 4.6. Rest of Middle East & Africa
-
5. Asia Pacific
- 5.1. China
- 5.2. India
- 5.3. Japan
- 5.4. South Korea
- 5.5. ASEAN
- 5.6. Oceania
- 5.7. Rest of Asia Pacific
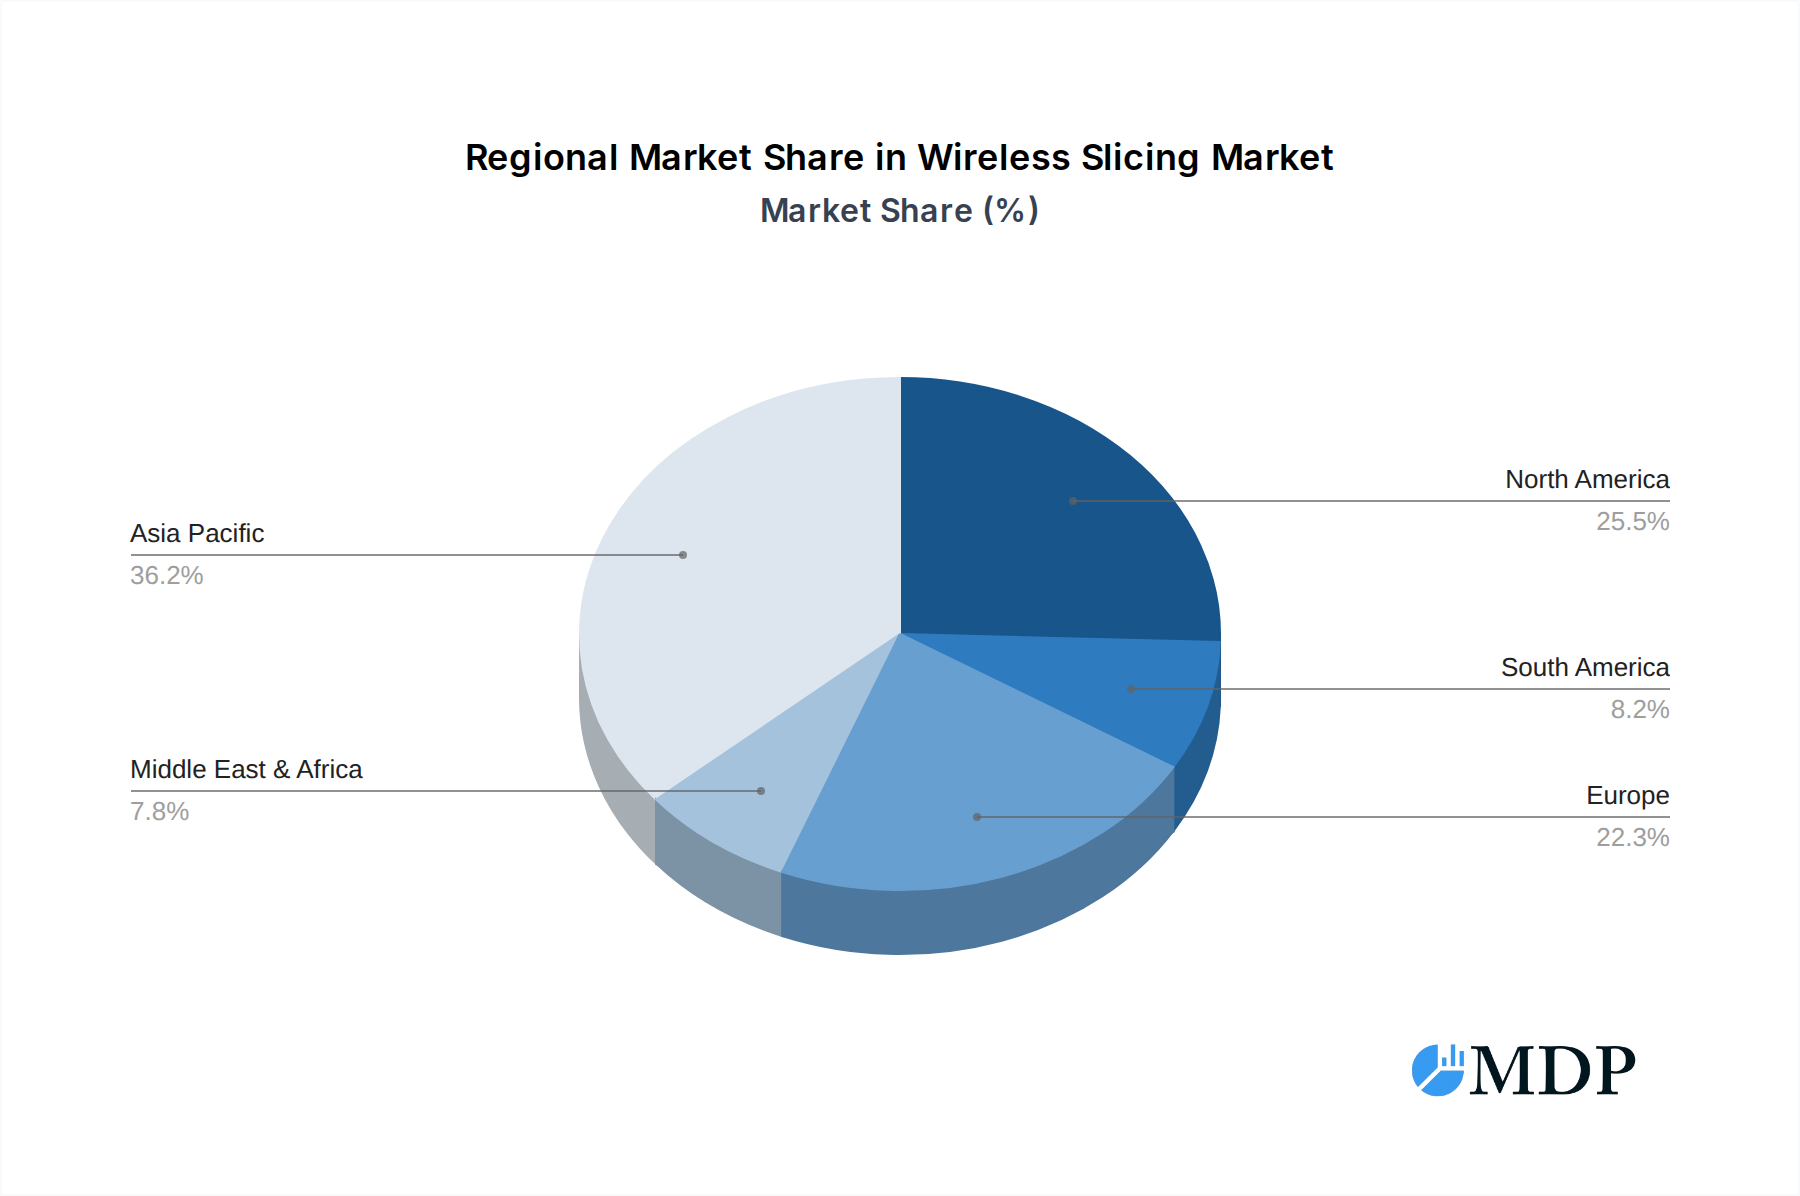
Wireless Slicing Regional Market Share
Geographic Coverage of Wireless Slicing
Wireless Slicing REPORT HIGHLIGHTS
| Aspects | Details |
|---|---|
| Study Period | 2020-2034 |
| Base Year | 2025 |
| Estimated Year | 2026 |
| Forecast Period | 2026-2034 |
| Historical Period | 2020-2025 |
| Growth Rate | CAGR of 34.2% from 2020-2034 |
| Segmentation |
|
Table of Contents
- 1. Introduction
- 1.1. Research Scope
- 1.2. Market Segmentation
- 1.3. Research Methodology
- 1.4. Definitions and Assumptions
- 2. Executive Summary
- 2.1. Introduction
- 3. Market Dynamics
- 3.1. Introduction
- 3.2. Market Drivers
- 3.3. Market Restrains
- 3.4. Market Trends
- 4. Market Factor Analysis
- 4.1. Porters Five Forces
- 4.2. Supply/Value Chain
- 4.3. PESTEL analysis
- 4.4. Market Entropy
- 4.5. Patent/Trademark Analysis
- 5. Global Wireless Slicing Analysis, Insights and Forecast, 2020-2032
- 5.1. Market Analysis, Insights and Forecast - by Application
- 5.1.1. Communications Industry
- 5.1.2. Artificial Intelligence
- 5.2. Market Analysis, Insights and Forecast - by Type
- 5.2.1. Separate Slices
- 5.2.2. Shared Slice
- 5.3. Market Analysis, Insights and Forecast - by Region
- 5.3.1. North America
- 5.3.2. South America
- 5.3.3. Europe
- 5.3.4. Middle East & Africa
- 5.3.5. Asia Pacific
- 5.1. Market Analysis, Insights and Forecast - by Application
- 6. North America Wireless Slicing Analysis, Insights and Forecast, 2020-2032
- 6.1. Market Analysis, Insights and Forecast - by Application
- 6.1.1. Communications Industry
- 6.1.2. Artificial Intelligence
- 6.2. Market Analysis, Insights and Forecast - by Type
- 6.2.1. Separate Slices
- 6.2.2. Shared Slice
- 6.1. Market Analysis, Insights and Forecast - by Application
- 7. South America Wireless Slicing Analysis, Insights and Forecast, 2020-2032
- 7.1. Market Analysis, Insights and Forecast - by Application
- 7.1.1. Communications Industry
- 7.1.2. Artificial Intelligence
- 7.2. Market Analysis, Insights and Forecast - by Type
- 7.2.1. Separate Slices
- 7.2.2. Shared Slice
- 7.1. Market Analysis, Insights and Forecast - by Application
- 8. Europe Wireless Slicing Analysis, Insights and Forecast, 2020-2032
- 8.1. Market Analysis, Insights and Forecast - by Application
- 8.1.1. Communications Industry
- 8.1.2. Artificial Intelligence
- 8.2. Market Analysis, Insights and Forecast - by Type
- 8.2.1. Separate Slices
- 8.2.2. Shared Slice
- 8.1. Market Analysis, Insights and Forecast - by Application
- 9. Middle East & Africa Wireless Slicing Analysis, Insights and Forecast, 2020-2032
- 9.1. Market Analysis, Insights and Forecast - by Application
- 9.1.1. Communications Industry
- 9.1.2. Artificial Intelligence
- 9.2. Market Analysis, Insights and Forecast - by Type
- 9.2.1. Separate Slices
- 9.2.2. Shared Slice
- 9.1. Market Analysis, Insights and Forecast - by Application
- 10. Asia Pacific Wireless Slicing Analysis, Insights and Forecast, 2020-2032
- 10.1. Market Analysis, Insights and Forecast - by Application
- 10.1.1. Communications Industry
- 10.1.2. Artificial Intelligence
- 10.2. Market Analysis, Insights and Forecast - by Type
- 10.2.1. Separate Slices
- 10.2.2. Shared Slice
- 10.1. Market Analysis, Insights and Forecast - by Application
- 11. Competitive Analysis
- 11.1. Global Market Share Analysis 2025
- 11.2. Company Profiles
- 11.2.1 Ericsson
- 11.2.1.1. Overview
- 11.2.1.2. Products
- 11.2.1.3. SWOT Analysis
- 11.2.1.4. Recent Developments
- 11.2.1.5. Financials (Based on Availability)
- 11.2.2 NOKIA
- 11.2.2.1. Overview
- 11.2.2.2. Products
- 11.2.2.3. SWOT Analysis
- 11.2.2.4. Recent Developments
- 11.2.2.5. Financials (Based on Availability)
- 11.2.3 Ciena
- 11.2.3.1. Overview
- 11.2.3.2. Products
- 11.2.3.3. SWOT Analysis
- 11.2.3.4. Recent Developments
- 11.2.3.5. Financials (Based on Availability)
- 11.2.4 MEF
- 11.2.4.1. Overview
- 11.2.4.2. Products
- 11.2.4.3. SWOT Analysis
- 11.2.4.4. Recent Developments
- 11.2.4.5. Financials (Based on Availability)
- 11.2.5 Huawei
- 11.2.5.1. Overview
- 11.2.5.2. Products
- 11.2.5.3. SWOT Analysis
- 11.2.5.4. Recent Developments
- 11.2.5.5. Financials (Based on Availability)
- 11.2.6 ZTE
- 11.2.6.1. Overview
- 11.2.6.2. Products
- 11.2.6.3. SWOT Analysis
- 11.2.6.4. Recent Developments
- 11.2.6.5. Financials (Based on Availability)
- 11.2.7 FiberHome Communications
- 11.2.7.1. Overview
- 11.2.7.2. Products
- 11.2.7.3. SWOT Analysis
- 11.2.7.4. Recent Developments
- 11.2.7.5. Financials (Based on Availability)
- 11.2.8 China Telecom
- 11.2.8.1. Overview
- 11.2.8.2. Products
- 11.2.8.3. SWOT Analysis
- 11.2.8.4. Recent Developments
- 11.2.8.5. Financials (Based on Availability)
- 11.2.9 Tsinghua Unigroup
- 11.2.9.1. Overview
- 11.2.9.2. Products
- 11.2.9.3. SWOT Analysis
- 11.2.9.4. Recent Developments
- 11.2.9.5. Financials (Based on Availability)
- 11.2.10 StarNet Ruijie
- 11.2.10.1. Overview
- 11.2.10.2. Products
- 11.2.10.3. SWOT Analysis
- 11.2.10.4. Recent Developments
- 11.2.10.5. Financials (Based on Availability)
- 11.2.11 Tongding Internet
- 11.2.11.1. Overview
- 11.2.11.2. Products
- 11.2.11.3. SWOT Analysis
- 11.2.11.4. Recent Developments
- 11.2.11.5. Financials (Based on Availability)
- 11.2.12 Wangsu Technology
- 11.2.12.1. Overview
- 11.2.12.2. Products
- 11.2.12.3. SWOT Analysis
- 11.2.12.4. Recent Developments
- 11.2.12.5. Financials (Based on Availability)
- 11.2.13 Huaxing Entrepreneurship
- 11.2.13.1. Overview
- 11.2.13.2. Products
- 11.2.13.3. SWOT Analysis
- 11.2.13.4. Recent Developments
- 11.2.13.5. Financials (Based on Availability)
- 11.2.14 Sinnet
- 11.2.14.1. Overview
- 11.2.14.2. Products
- 11.2.14.3. SWOT Analysis
- 11.2.14.4. Recent Developments
- 11.2.14.5. Financials (Based on Availability)
- 11.2.15 Gongjin shares
- 11.2.15.1. Overview
- 11.2.15.2. Products
- 11.2.15.3. SWOT Analysis
- 11.2.15.4. Recent Developments
- 11.2.15.5. Financials (Based on Availability)
- 11.2.1 Ericsson
List of Figures
- Figure 1: Global Wireless Slicing Revenue Breakdown (undefined, %) by Region 2025 & 2033
- Figure 2: Global Wireless Slicing Volume Breakdown (K, %) by Region 2025 & 2033
- Figure 3: North America Wireless Slicing Revenue (undefined), by Application 2025 & 2033
- Figure 4: North America Wireless Slicing Volume (K), by Application 2025 & 2033
- Figure 5: North America Wireless Slicing Revenue Share (%), by Application 2025 & 2033
- Figure 6: North America Wireless Slicing Volume Share (%), by Application 2025 & 2033
- Figure 7: North America Wireless Slicing Revenue (undefined), by Type 2025 & 2033
- Figure 8: North America Wireless Slicing Volume (K), by Type 2025 & 2033
- Figure 9: North America Wireless Slicing Revenue Share (%), by Type 2025 & 2033
- Figure 10: North America Wireless Slicing Volume Share (%), by Type 2025 & 2033
- Figure 11: North America Wireless Slicing Revenue (undefined), by Country 2025 & 2033
- Figure 12: North America Wireless Slicing Volume (K), by Country 2025 & 2033
- Figure 13: North America Wireless Slicing Revenue Share (%), by Country 2025 & 2033
- Figure 14: North America Wireless Slicing Volume Share (%), by Country 2025 & 2033
- Figure 15: South America Wireless Slicing Revenue (undefined), by Application 2025 & 2033
- Figure 16: South America Wireless Slicing Volume (K), by Application 2025 & 2033
- Figure 17: South America Wireless Slicing Revenue Share (%), by Application 2025 & 2033
- Figure 18: South America Wireless Slicing Volume Share (%), by Application 2025 & 2033
- Figure 19: South America Wireless Slicing Revenue (undefined), by Type 2025 & 2033
- Figure 20: South America Wireless Slicing Volume (K), by Type 2025 & 2033
- Figure 21: South America Wireless Slicing Revenue Share (%), by Type 2025 & 2033
- Figure 22: South America Wireless Slicing Volume Share (%), by Type 2025 & 2033
- Figure 23: South America Wireless Slicing Revenue (undefined), by Country 2025 & 2033
- Figure 24: South America Wireless Slicing Volume (K), by Country 2025 & 2033
- Figure 25: South America Wireless Slicing Revenue Share (%), by Country 2025 & 2033
- Figure 26: South America Wireless Slicing Volume Share (%), by Country 2025 & 2033
- Figure 27: Europe Wireless Slicing Revenue (undefined), by Application 2025 & 2033
- Figure 28: Europe Wireless Slicing Volume (K), by Application 2025 & 2033
- Figure 29: Europe Wireless Slicing Revenue Share (%), by Application 2025 & 2033
- Figure 30: Europe Wireless Slicing Volume Share (%), by Application 2025 & 2033
- Figure 31: Europe Wireless Slicing Revenue (undefined), by Type 2025 & 2033
- Figure 32: Europe Wireless Slicing Volume (K), by Type 2025 & 2033
- Figure 33: Europe Wireless Slicing Revenue Share (%), by Type 2025 & 2033
- Figure 34: Europe Wireless Slicing Volume Share (%), by Type 2025 & 2033
- Figure 35: Europe Wireless Slicing Revenue (undefined), by Country 2025 & 2033
- Figure 36: Europe Wireless Slicing Volume (K), by Country 2025 & 2033
- Figure 37: Europe Wireless Slicing Revenue Share (%), by Country 2025 & 2033
- Figure 38: Europe Wireless Slicing Volume Share (%), by Country 2025 & 2033
- Figure 39: Middle East & Africa Wireless Slicing Revenue (undefined), by Application 2025 & 2033
- Figure 40: Middle East & Africa Wireless Slicing Volume (K), by Application 2025 & 2033
- Figure 41: Middle East & Africa Wireless Slicing Revenue Share (%), by Application 2025 & 2033
- Figure 42: Middle East & Africa Wireless Slicing Volume Share (%), by Application 2025 & 2033
- Figure 43: Middle East & Africa Wireless Slicing Revenue (undefined), by Type 2025 & 2033
- Figure 44: Middle East & Africa Wireless Slicing Volume (K), by Type 2025 & 2033
- Figure 45: Middle East & Africa Wireless Slicing Revenue Share (%), by Type 2025 & 2033
- Figure 46: Middle East & Africa Wireless Slicing Volume Share (%), by Type 2025 & 2033
- Figure 47: Middle East & Africa Wireless Slicing Revenue (undefined), by Country 2025 & 2033
- Figure 48: Middle East & Africa Wireless Slicing Volume (K), by Country 2025 & 2033
- Figure 49: Middle East & Africa Wireless Slicing Revenue Share (%), by Country 2025 & 2033
- Figure 50: Middle East & Africa Wireless Slicing Volume Share (%), by Country 2025 & 2033
- Figure 51: Asia Pacific Wireless Slicing Revenue (undefined), by Application 2025 & 2033
- Figure 52: Asia Pacific Wireless Slicing Volume (K), by Application 2025 & 2033
- Figure 53: Asia Pacific Wireless Slicing Revenue Share (%), by Application 2025 & 2033
- Figure 54: Asia Pacific Wireless Slicing Volume Share (%), by Application 2025 & 2033
- Figure 55: Asia Pacific Wireless Slicing Revenue (undefined), by Type 2025 & 2033
- Figure 56: Asia Pacific Wireless Slicing Volume (K), by Type 2025 & 2033
- Figure 57: Asia Pacific Wireless Slicing Revenue Share (%), by Type 2025 & 2033
- Figure 58: Asia Pacific Wireless Slicing Volume Share (%), by Type 2025 & 2033
- Figure 59: Asia Pacific Wireless Slicing Revenue (undefined), by Country 2025 & 2033
- Figure 60: Asia Pacific Wireless Slicing Volume (K), by Country 2025 & 2033
- Figure 61: Asia Pacific Wireless Slicing Revenue Share (%), by Country 2025 & 2033
- Figure 62: Asia Pacific Wireless Slicing Volume Share (%), by Country 2025 & 2033
List of Tables
- Table 1: Global Wireless Slicing Revenue undefined Forecast, by Application 2020 & 2033
- Table 2: Global Wireless Slicing Volume K Forecast, by Application 2020 & 2033
- Table 3: Global Wireless Slicing Revenue undefined Forecast, by Type 2020 & 2033
- Table 4: Global Wireless Slicing Volume K Forecast, by Type 2020 & 2033
- Table 5: Global Wireless Slicing Revenue undefined Forecast, by Region 2020 & 2033
- Table 6: Global Wireless Slicing Volume K Forecast, by Region 2020 & 2033
- Table 7: Global Wireless Slicing Revenue undefined Forecast, by Application 2020 & 2033
- Table 8: Global Wireless Slicing Volume K Forecast, by Application 2020 & 2033
- Table 9: Global Wireless Slicing Revenue undefined Forecast, by Type 2020 & 2033
- Table 10: Global Wireless Slicing Volume K Forecast, by Type 2020 & 2033
- Table 11: Global Wireless Slicing Revenue undefined Forecast, by Country 2020 & 2033
- Table 12: Global Wireless Slicing Volume K Forecast, by Country 2020 & 2033
- Table 13: United States Wireless Slicing Revenue (undefined) Forecast, by Application 2020 & 2033
- Table 14: United States Wireless Slicing Volume (K) Forecast, by Application 2020 & 2033
- Table 15: Canada Wireless Slicing Revenue (undefined) Forecast, by Application 2020 & 2033
- Table 16: Canada Wireless Slicing Volume (K) Forecast, by Application 2020 & 2033
- Table 17: Mexico Wireless Slicing Revenue (undefined) Forecast, by Application 2020 & 2033
- Table 18: Mexico Wireless Slicing Volume (K) Forecast, by Application 2020 & 2033
- Table 19: Global Wireless Slicing Revenue undefined Forecast, by Application 2020 & 2033
- Table 20: Global Wireless Slicing Volume K Forecast, by Application 2020 & 2033
- Table 21: Global Wireless Slicing Revenue undefined Forecast, by Type 2020 & 2033
- Table 22: Global Wireless Slicing Volume K Forecast, by Type 2020 & 2033
- Table 23: Global Wireless Slicing Revenue undefined Forecast, by Country 2020 & 2033
- Table 24: Global Wireless Slicing Volume K Forecast, by Country 2020 & 2033
- Table 25: Brazil Wireless Slicing Revenue (undefined) Forecast, by Application 2020 & 2033
- Table 26: Brazil Wireless Slicing Volume (K) Forecast, by Application 2020 & 2033
- Table 27: Argentina Wireless Slicing Revenue (undefined) Forecast, by Application 2020 & 2033
- Table 28: Argentina Wireless Slicing Volume (K) Forecast, by Application 2020 & 2033
- Table 29: Rest of South America Wireless Slicing Revenue (undefined) Forecast, by Application 2020 & 2033
- Table 30: Rest of South America Wireless Slicing Volume (K) Forecast, by Application 2020 & 2033
- Table 31: Global Wireless Slicing Revenue undefined Forecast, by Application 2020 & 2033
- Table 32: Global Wireless Slicing Volume K Forecast, by Application 2020 & 2033
- Table 33: Global Wireless Slicing Revenue undefined Forecast, by Type 2020 & 2033
- Table 34: Global Wireless Slicing Volume K Forecast, by Type 2020 & 2033
- Table 35: Global Wireless Slicing Revenue undefined Forecast, by Country 2020 & 2033
- Table 36: Global Wireless Slicing Volume K Forecast, by Country 2020 & 2033
- Table 37: United Kingdom Wireless Slicing Revenue (undefined) Forecast, by Application 2020 & 2033
- Table 38: United Kingdom Wireless Slicing Volume (K) Forecast, by Application 2020 & 2033
- Table 39: Germany Wireless Slicing Revenue (undefined) Forecast, by Application 2020 & 2033
- Table 40: Germany Wireless Slicing Volume (K) Forecast, by Application 2020 & 2033
- Table 41: France Wireless Slicing Revenue (undefined) Forecast, by Application 2020 & 2033
- Table 42: France Wireless Slicing Volume (K) Forecast, by Application 2020 & 2033
- Table 43: Italy Wireless Slicing Revenue (undefined) Forecast, by Application 2020 & 2033
- Table 44: Italy Wireless Slicing Volume (K) Forecast, by Application 2020 & 2033
- Table 45: Spain Wireless Slicing Revenue (undefined) Forecast, by Application 2020 & 2033
- Table 46: Spain Wireless Slicing Volume (K) Forecast, by Application 2020 & 2033
- Table 47: Russia Wireless Slicing Revenue (undefined) Forecast, by Application 2020 & 2033
- Table 48: Russia Wireless Slicing Volume (K) Forecast, by Application 2020 & 2033
- Table 49: Benelux Wireless Slicing Revenue (undefined) Forecast, by Application 2020 & 2033
- Table 50: Benelux Wireless Slicing Volume (K) Forecast, by Application 2020 & 2033
- Table 51: Nordics Wireless Slicing Revenue (undefined) Forecast, by Application 2020 & 2033
- Table 52: Nordics Wireless Slicing Volume (K) Forecast, by Application 2020 & 2033
- Table 53: Rest of Europe Wireless Slicing Revenue (undefined) Forecast, by Application 2020 & 2033
- Table 54: Rest of Europe Wireless Slicing Volume (K) Forecast, by Application 2020 & 2033
- Table 55: Global Wireless Slicing Revenue undefined Forecast, by Application 2020 & 2033
- Table 56: Global Wireless Slicing Volume K Forecast, by Application 2020 & 2033
- Table 57: Global Wireless Slicing Revenue undefined Forecast, by Type 2020 & 2033
- Table 58: Global Wireless Slicing Volume K Forecast, by Type 2020 & 2033
- Table 59: Global Wireless Slicing Revenue undefined Forecast, by Country 2020 & 2033
- Table 60: Global Wireless Slicing Volume K Forecast, by Country 2020 & 2033
- Table 61: Turkey Wireless Slicing Revenue (undefined) Forecast, by Application 2020 & 2033
- Table 62: Turkey Wireless Slicing Volume (K) Forecast, by Application 2020 & 2033
- Table 63: Israel Wireless Slicing Revenue (undefined) Forecast, by Application 2020 & 2033
- Table 64: Israel Wireless Slicing Volume (K) Forecast, by Application 2020 & 2033
- Table 65: GCC Wireless Slicing Revenue (undefined) Forecast, by Application 2020 & 2033
- Table 66: GCC Wireless Slicing Volume (K) Forecast, by Application 2020 & 2033
- Table 67: North Africa Wireless Slicing Revenue (undefined) Forecast, by Application 2020 & 2033
- Table 68: North Africa Wireless Slicing Volume (K) Forecast, by Application 2020 & 2033
- Table 69: South Africa Wireless Slicing Revenue (undefined) Forecast, by Application 2020 & 2033
- Table 70: South Africa Wireless Slicing Volume (K) Forecast, by Application 2020 & 2033
- Table 71: Rest of Middle East & Africa Wireless Slicing Revenue (undefined) Forecast, by Application 2020 & 2033
- Table 72: Rest of Middle East & Africa Wireless Slicing Volume (K) Forecast, by Application 2020 & 2033
- Table 73: Global Wireless Slicing Revenue undefined Forecast, by Application 2020 & 2033
- Table 74: Global Wireless Slicing Volume K Forecast, by Application 2020 & 2033
- Table 75: Global Wireless Slicing Revenue undefined Forecast, by Type 2020 & 2033
- Table 76: Global Wireless Slicing Volume K Forecast, by Type 2020 & 2033
- Table 77: Global Wireless Slicing Revenue undefined Forecast, by Country 2020 & 2033
- Table 78: Global Wireless Slicing Volume K Forecast, by Country 2020 & 2033
- Table 79: China Wireless Slicing Revenue (undefined) Forecast, by Application 2020 & 2033
- Table 80: China Wireless Slicing Volume (K) Forecast, by Application 2020 & 2033
- Table 81: India Wireless Slicing Revenue (undefined) Forecast, by Application 2020 & 2033
- Table 82: India Wireless Slicing Volume (K) Forecast, by Application 2020 & 2033
- Table 83: Japan Wireless Slicing Revenue (undefined) Forecast, by Application 2020 & 2033
- Table 84: Japan Wireless Slicing Volume (K) Forecast, by Application 2020 & 2033
- Table 85: South Korea Wireless Slicing Revenue (undefined) Forecast, by Application 2020 & 2033
- Table 86: South Korea Wireless Slicing Volume (K) Forecast, by Application 2020 & 2033
- Table 87: ASEAN Wireless Slicing Revenue (undefined) Forecast, by Application 2020 & 2033
- Table 88: ASEAN Wireless Slicing Volume (K) Forecast, by Application 2020 & 2033
- Table 89: Oceania Wireless Slicing Revenue (undefined) Forecast, by Application 2020 & 2033
- Table 90: Oceania Wireless Slicing Volume (K) Forecast, by Application 2020 & 2033
- Table 91: Rest of Asia Pacific Wireless Slicing Revenue (undefined) Forecast, by Application 2020 & 2033
- Table 92: Rest of Asia Pacific Wireless Slicing Volume (K) Forecast, by Application 2020 & 2033
Frequently Asked Questions
1. What is the projected Compound Annual Growth Rate (CAGR) of the Wireless Slicing?
The projected CAGR is approximately 34.2%.
2. Which companies are prominent players in the Wireless Slicing?
Key companies in the market include Ericsson, NOKIA, Ciena, MEF, Huawei, ZTE, FiberHome Communications, China Telecom, Tsinghua Unigroup, StarNet Ruijie, Tongding Internet, Wangsu Technology, Huaxing Entrepreneurship, Sinnet, Gongjin shares.
3. What are the main segments of the Wireless Slicing?
The market segments include Application, Type.
4. Can you provide details about the market size?
The market size is estimated to be USD XXX N/A as of 2022.
5. What are some drivers contributing to market growth?
N/A
6. What are the notable trends driving market growth?
N/A
7. Are there any restraints impacting market growth?
N/A
8. Can you provide examples of recent developments in the market?
N/A
9. What pricing options are available for accessing the report?
Pricing options include single-user, multi-user, and enterprise licenses priced at USD 3950.00, USD 5925.00, and USD 7900.00 respectively.
10. Is the market size provided in terms of value or volume?
The market size is provided in terms of value, measured in N/A and volume, measured in K.
11. Are there any specific market keywords associated with the report?
Yes, the market keyword associated with the report is "Wireless Slicing," which aids in identifying and referencing the specific market segment covered.
12. How do I determine which pricing option suits my needs best?
The pricing options vary based on user requirements and access needs. Individual users may opt for single-user licenses, while businesses requiring broader access may choose multi-user or enterprise licenses for cost-effective access to the report.
13. Are there any additional resources or data provided in the Wireless Slicing report?
While the report offers comprehensive insights, it's advisable to review the specific contents or supplementary materials provided to ascertain if additional resources or data are available.
14. How can I stay updated on further developments or reports in the Wireless Slicing?
To stay informed about further developments, trends, and reports in the Wireless Slicing, consider subscribing to industry newsletters, following relevant companies and organizations, or regularly checking reputable industry news sources and publications.
Methodology
Step 1 - Identification of Relevant Samples Size from Population Database


Step 2 - Approaches for Defining Global Market Size (Value, Volume* & Price*)

Note*: In applicable scenarios
Step 3 - Data Sources
Primary Research
- Web Analytics
- Survey Reports
- Research Institute
- Latest Research Reports
- Opinion Leaders
Secondary Research
- Annual Reports
- White Paper
- Latest Press Release
- Industry Association
- Paid Database
- Investor Presentations

Step 4 - Data Triangulation
Involves using different sources of information in order to increase the validity of a study
These sources are likely to be stakeholders in a program - participants, other researchers, program staff, other community members, and so on.
Then we put all data in single framework & apply various statistical tools to find out the dynamic on the market.
During the analysis stage, feedback from the stakeholder groups would be compared to determine areas of agreement as well as areas of divergence