

Key Insights
The global Virtual Production Service market is poised for substantial expansion, projected to reach an impressive $2987 million by 2025, with a robust Compound Annual Growth Rate (CAGR) of 14.1% during the forecast period of 2025-2033. This significant growth is primarily fueled by the escalating demand for immersive and realistic visual content across various industries. The Broadcast and Film & TV sectors are leading the charge, leveraging virtual production to create dynamic storytelling experiences and reduce production timelines and costs. The increasing adoption of advanced technologies like LED walls, real-time rendering engines, and motion capture further accelerates market penetration. Furthermore, the burgeoning streaming media landscape, with its constant need for fresh and engaging content, acts as a significant catalyst. Emerging applications in advertising, where brands seek to create highly targeted and visually captivating campaigns, are also contributing to this upward trajectory. The market is characterized by a dynamic ecosystem of software and service providers, each contributing to the evolution of this transformative technology.
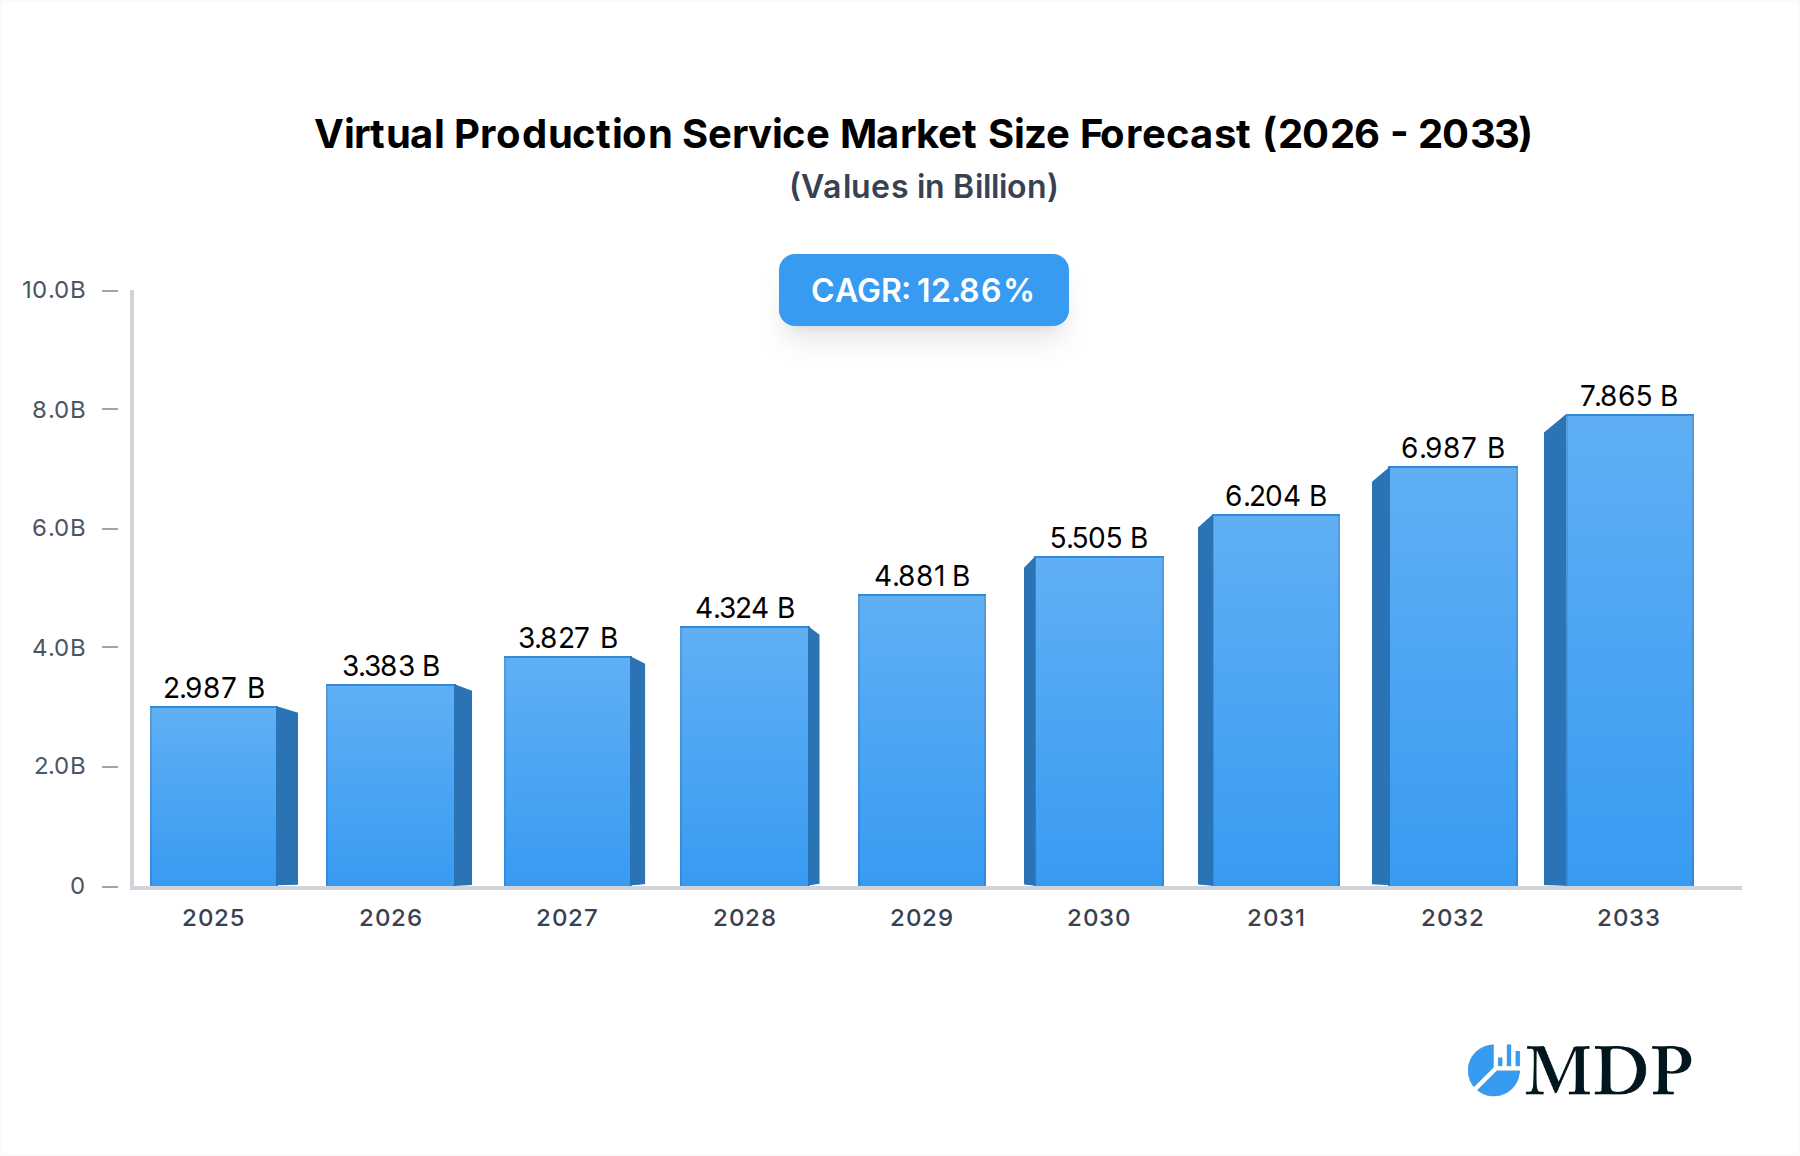
Virtual Production Service Market Size (In Billion)
The market is not without its challenges, however. High initial investment costs for sophisticated virtual production setups can present a barrier for smaller studios and independent creators. Additionally, the need for specialized skillsets and the ongoing development of standardized workflows pose transitional challenges. Despite these restraints, the inherent benefits of virtual production, including enhanced creative control, reduced physical set requirements, and the ability to iterate on scenes in real-time, are compelling enough to drive widespread adoption. Key players are investing heavily in research and development, pushing the boundaries of what's possible in virtual environments and making the technology more accessible. Geographically, North America and Europe currently dominate the market due to their established film and television industries and early adoption of technological advancements. However, the Asia Pacific region is emerging as a significant growth engine, driven by the rapid expansion of its digital content creation sector and increasing technological investment.

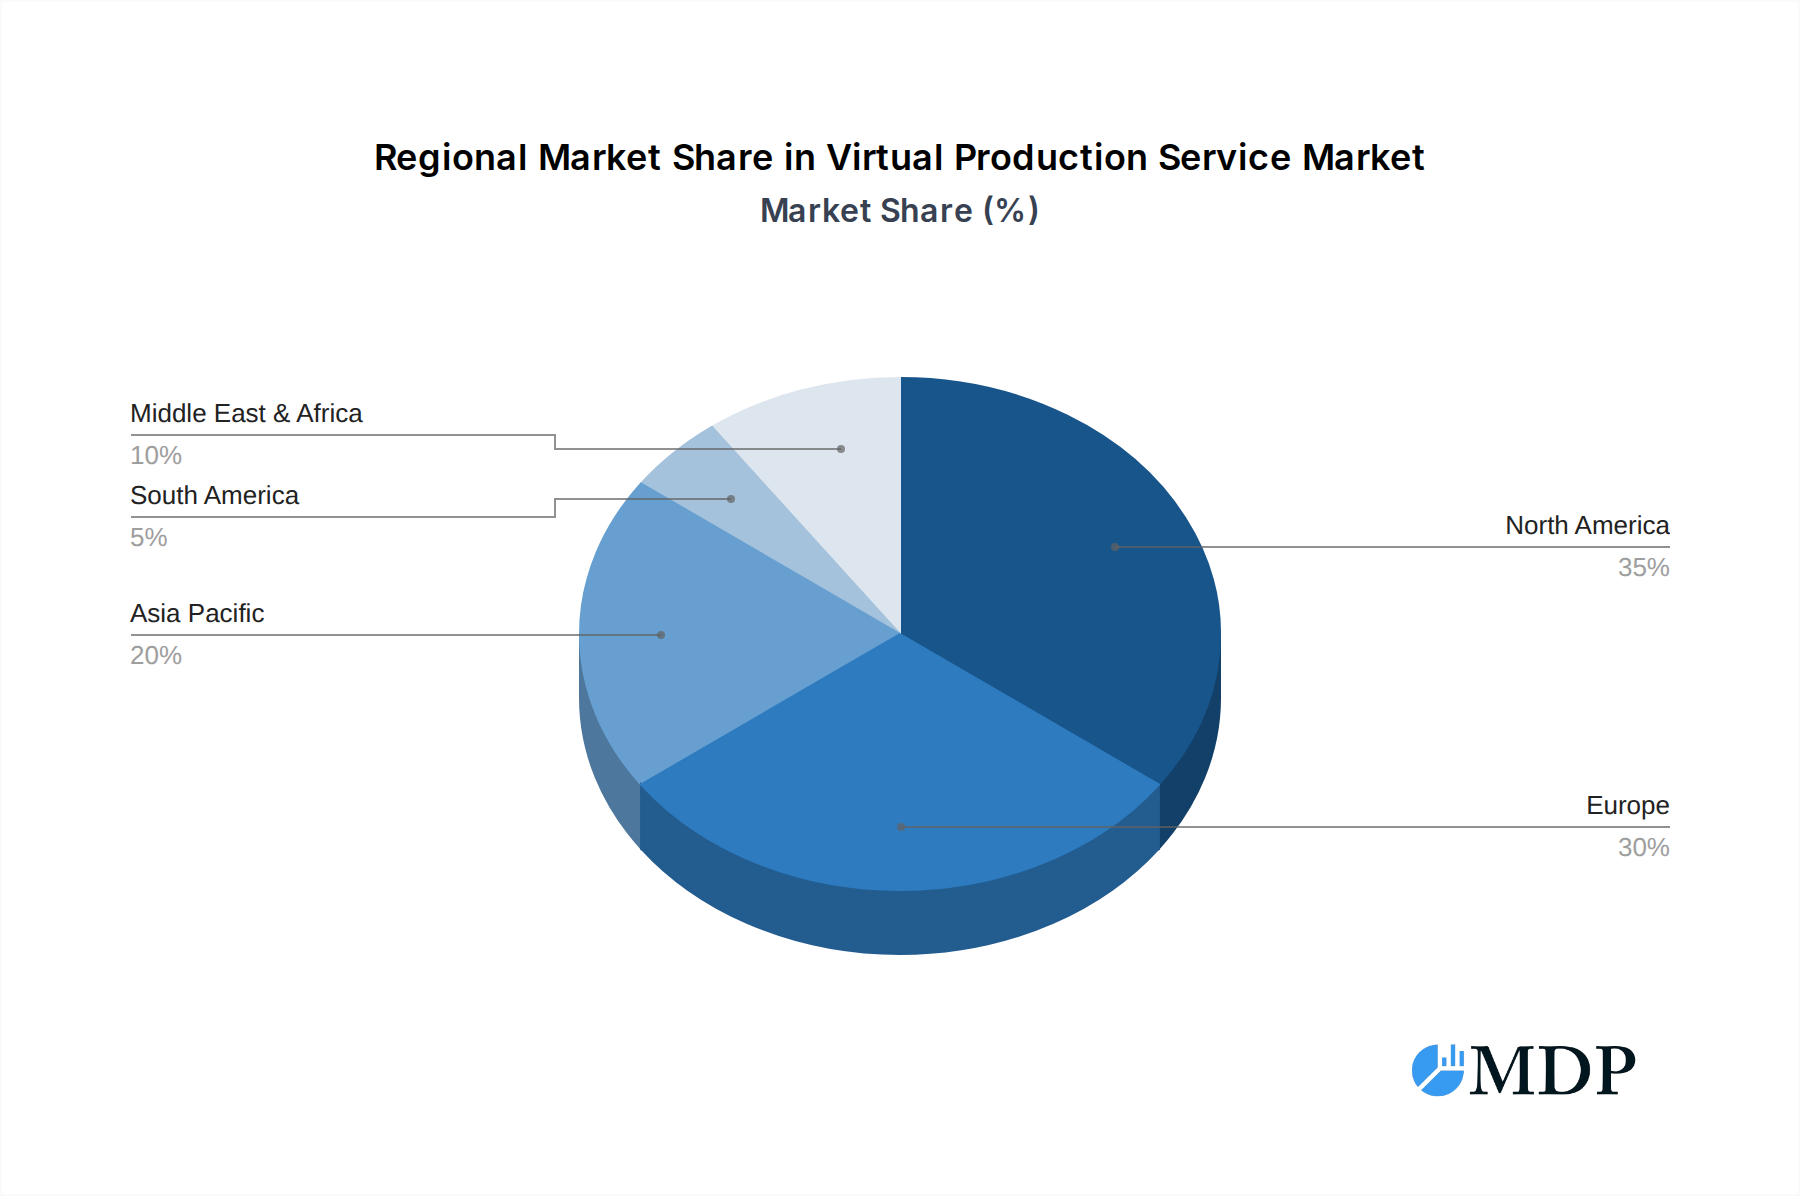
Virtual Production Service Company Market Share
Virtual Production Service Market Report: Revolutionizing Media Creation with Real-time CG and LED Walls
This comprehensive report, spanning from 2019 to 2033 with a base and estimated year of 2025, delves deep into the burgeoning Virtual Production Service market. Explore how cutting-edge technologies like real-time CG, LED walls, and motion capture are transforming Broadcast, Streaming Media, Advertising, and Film and TV production. With an estimated market size projected to reach millions in value, this report offers invaluable insights for industry stakeholders, including production houses, technology providers, and investors. Discover key market dynamics, emerging trends, leading players, and strategic opportunities that will shape the future of visual storytelling.
Virtual Production Service Market Dynamics & Concentration
The Virtual Production Service market is characterized by a dynamic interplay of technological innovation, evolving content demands, and a growing number of specialized service providers. Market concentration is shifting as established players like NEP GROUP and PRG adapt their offerings alongside nimble innovators such as Vū Technologies and Pixotope. Key innovation drivers include the relentless pursuit of photorealistic real-time rendering, seamless integration of in-camera VFX, and advancements in LED display technology. Regulatory frameworks, while still developing, are beginning to address intellectual property rights and data security within virtual environments. Product substitutes, primarily traditional VFX workflows and green screen techniques, are increasingly being supplanted by the efficiency and creative control offered by virtual production. End-user trends are strongly influenced by the demand for immersive content across all media segments, driving the adoption of virtual production for its cost-effectiveness and speed. Mergers and acquisitions (M&A) activity is on the rise, with significant deals occurring as companies seek to consolidate expertise and expand their service portfolios. For example, several hundred M&A deals are anticipated within the forecast period as the industry matures. The market share distribution is becoming more fragmented yet also seeing strategic consolidation among key players.
- Innovation Drivers: Real-time rendering, LED display technology, motion capture, AI in virtual asset creation.
- Regulatory Considerations: IP protection for virtual assets, data privacy, emerging industry standards.
- End-User Preferences: Demand for immersive experiences, faster production cycles, cost-effective VFX.
- M&A Activity: Strategic acquisitions for talent, technology, and market reach.
Virtual Production Service Industry Trends & Analysis
The Virtual Production Service industry is experiencing unprecedented growth, propelled by a confluence of factors that are fundamentally reshaping media creation. The market is projected to witness a Compound Annual Growth Rate (CAGR) of approximately xx% during the forecast period of 2025–2033. This robust expansion is largely driven by the increasing demand for high-quality, visually stunning content across broadcast, streaming, advertising, and film and television sectors. Technological disruptions are at the forefront, with advancements in real-time rendering engines, such as Unreal Engine and Unity, making photorealistic virtual environments accessible and manageable. The proliferation of powerful LED display technology, exemplified by solutions from companies like AOIN and Sony, enables the creation of dynamic, in-camera backgrounds that significantly reduce post-production time and costs. Consumer preferences are heavily skewed towards immersive and engaging experiences, pushing content creators to explore new storytelling techniques. Virtual production offers a compelling solution, allowing for greater creative freedom and interactivity. Competitive dynamics are intensifying, with a diverse range of players, from established giants like DNEG and Wētā FX to specialized software providers like Pixotope and Mo-Sys, vying for market dominance. The integration of AI is also emerging as a significant trend, promising to automate complex tasks in virtual asset creation and scene manipulation. Market penetration is rapidly increasing, with virtual production moving beyond high-budget film studios to become an accessible tool for a wider array of content creators. The ability to iterate on scenes in real-time, visualize shots with actors on set, and minimize the need for extensive green screen work are major attractions. Furthermore, the growing accessibility of virtual production workflows is democratizing high-end visual effects, making them attainable for independent filmmakers and smaller production houses. This accessibility, coupled with the continuous innovation in hardware and software, is fueling widespread adoption and driving the market’s upward trajectory.
Leading Markets & Segments in Virtual Production Service
The Virtual Production Service market exhibits distinct regional strengths and segment dominance, driven by varying levels of technological adoption, investment, and creative output. The Film and TV segment stands out as the largest and most influential application, accounting for an estimated xx% of the total market share in 2025. This dominance is fueled by the immense demand for feature films, episodic series, and high-quality documentaries that benefit immensely from the immersive capabilities and cost efficiencies of virtual production. North America, particularly Hollywood, remains a leading region due to its established infrastructure, significant investment in R&D, and a high concentration of major studios and production companies. Economic policies that encourage film production and technological innovation further bolster its position.
Within the application segments:
- Film and TV: This sector benefits from the ability to create complex virtual sets, real-time pre-visualization, and in-camera visual effects, significantly reducing post-production time and expense. The development of advanced virtual production stages by companies like NantStudios and Showrunner is a testament to this segment's growth.
- Broadcast: The broadcast industry is increasingly adopting virtual production for live shows, news segments, and sports coverage, offering dynamic virtual backgrounds and enhanced graphical overlays. Companies like NEP GROUP are at the forefront of integrating these solutions for broadcasters.
- Streaming Media: The explosive growth of streaming platforms has created an insatiable demand for fresh content, making virtual production an attractive solution for producing high-quality shows efficiently and at scale. Netflix, Amazon Prime Video, and other major streamers are key drivers here.
- Advertising: Advertisers are leveraging virtual production for creating visually striking and cost-effective commercials, allowing for greater creative control and faster turnaround times.
- Others: This encompasses emerging applications in gaming, virtual events, and immersive experiences, representing a growing but currently smaller segment.
In terms of Types, the Services segment is currently dominant, encompassing the expertise, virtual studio operation, and end-to-end production solutions offered by companies like FuseFX, Framestore, and Vero. However, the Software segment, featuring platforms like Pixotope and Unreal Engine, is experiencing rapid growth, indicating a future where integrated software solutions will play an increasingly crucial role. The synergy between services and software is paramount, with advancements in software enabling more sophisticated and accessible virtual production services. Infrastructure development, such as the availability of high-speed internet and specialized virtual production studios, plays a critical role in regional dominance. For instance, the increasing number of virtual production studios in the UK and Europe is positioning these regions as significant hubs.
Virtual Production Service Product Developments
Product developments in virtual production are rapidly advancing, focusing on enhancing real-time capabilities, streamlining workflows, and improving accessibility. Key innovations include the development of more sophisticated real-time rendering engines that achieve near-photorealistic quality, such as advancements in Unreal Engine and Unity. The integration of AI for procedural content generation and automated scene setup is also a significant trend, offering competitive advantages to early adopters. Furthermore, companies like Mo-Sys and Tiltlabs are pushing the boundaries with advanced camera tracking systems and virtual camera solutions that offer unprecedented levels of precision and flexibility. The development of integrated virtual production platforms, combining hardware and software, is also gaining traction, providing end-to-end solutions for creators.
Key Drivers of Virtual Production Service Growth
The Virtual Production Service market is experiencing robust growth driven by several interconnected factors. Technologically, the continuous advancements in real-time rendering, LED display technology, and camera tracking systems are making virtual production more feasible and visually compelling. Economically, the ability to reduce post-production costs, shorten production timelines, and minimize physical set construction makes virtual production a highly attractive proposition for budget-conscious productions. Regulatory factors, such as evolving intellectual property laws for virtual assets and a growing industry consensus on best practices, are also contributing to market stability and growth. The increasing demand for immersive content across all media platforms further amplifies these drivers, pushing creators to adopt more innovative production methods.
- Technological Advancements: Real-time rendering, LED walls, motion capture.
- Cost Efficiency: Reduced post-production, fewer physical sets, shorter schedules.
- Content Demand: Growth in streaming, demand for visually rich content.
- Creative Freedom: Enhanced storytelling possibilities and iteration.
Challenges in the Virtual Production Service Market
Despite its rapid growth, the Virtual Production Service market faces several challenges. The high initial investment required for cutting-edge hardware and software can be a significant barrier for smaller production houses. Ensuring consistent and high-quality performance across diverse projects requires specialized expertise and skilled personnel, leading to a talent gap in the industry. Supply chain issues for specialized components, though improving, can still impact project timelines. Furthermore, the rapid pace of technological change necessitates continuous investment in upgrades and training, adding to the operational costs. Competitive pressures among service providers and software developers can also lead to price wars, potentially impacting profitability for some.
- High Upfront Investment: Cost of hardware and software.
- Talent Shortage: Need for skilled virtual production professionals.
- Technological Obsolescence: Rapid innovation requires continuous updates.
- Integration Complexity: Seamlessly combining different technologies.
Emerging Opportunities in Virtual Production Service
The Virtual Production Service market is brimming with emerging opportunities driven by continuous innovation and evolving industry needs. Technological breakthroughs, such as advancements in AI-powered content generation and cloud-based rendering solutions, are poised to democratize virtual production further, making it more accessible and affordable. Strategic partnerships between technology providers, service companies, and content creators are fostering synergistic ecosystems, leading to more integrated and efficient workflows. For instance, collaborations between companies like Crew In Motion and Narwhal Studios could lead to novel production pipelines. Market expansion into new verticals like virtual and augmented reality content creation, immersive training simulations, and live entertainment experiences presents significant growth potential. The increasing adoption of virtual production for creating digital twins of real-world locations and assets also opens up new avenues for industries beyond entertainment.
Leading Players in the Virtual Production Service Sector
- 80six
- FuseFX
- cyd virtual studio
- NEP GROUP
- NantStudios
- PRG
- SHOWRUNNER
- Vū Technologies
- AOIN
- Mriya production
- DNEG
- Wētā FX
- Dark Matters
- Vero
- Mo-Sys
- Framestore
- Crew In Motion
- SoFlo Studios
- Lexhag
- Pixotope
- Tiltlabs
- Creative Technology
- Narwhal Studios
- Sony
- Solotech
- Fox
Key Milestones in Virtual Production Service Industry
- 2019: Increased adoption of real-time rendering engines for pre-visualization in film.
- 2020: The COVID-19 pandemic accelerated the adoption of virtual production for remote filmmaking and reduced on-set crew sizes.
- 2021: Significant advancements in LED wall technology, enabling more realistic in-camera backgrounds. Launch of major virtual production stages by companies like NantStudios.
- 2022: Increased integration of AI and machine learning into virtual production workflows for asset generation and scene optimization. Growing prevalence of virtual production in streaming series.
- 2023: Emergence of cloud-based virtual production solutions, enhancing accessibility and collaboration. Further refinement of camera tracking and motion capture systems by companies like Mo-Sys.
- 2024: Growing interest in virtual production for advertising and broadcast segments. Continued investment in R&D by major players like Sony and Pixotope.
Strategic Outlook for Virtual Production Service Market
The strategic outlook for the Virtual Production Service market remains exceptionally bright, driven by sustained technological innovation and increasing demand for immersive content. Future growth will be characterized by the further integration of AI for automated workflows and content creation, alongside the development of more accessible and scalable virtual production solutions. Strategic opportunities lie in forging deeper collaborations between hardware manufacturers, software developers, and content creators to streamline end-to-end production pipelines. Expansion into new markets, including enterprise training, live events, and the metaverse, will also be key growth accelerators. The continued evolution of LED technology and real-time rendering will enable even more sophisticated and cost-effective virtual production, solidifying its position as an indispensable tool in the media and entertainment landscape.
Virtual Production Service Segmentation
-
1. Application
- 1.1. Broadcast
- 1.2. Streaming Media
- 1.3. Advertising
- 1.4. Film and TV
- 1.5. Others
-
2. Types
- 2.1. Software
- 2.2. Services
Virtual Production Service Segmentation By Geography
-
1. North America
- 1.1. United States
- 1.2. Canada
- 1.3. Mexico
-
2. South America
- 2.1. Brazil
- 2.2. Argentina
- 2.3. Rest of South America
-
3. Europe
- 3.1. United Kingdom
- 3.2. Germany
- 3.3. France
- 3.4. Italy
- 3.5. Spain
- 3.6. Russia
- 3.7. Benelux
- 3.8. Nordics
- 3.9. Rest of Europe
-
4. Middle East & Africa
- 4.1. Turkey
- 4.2. Israel
- 4.3. GCC
- 4.4. North Africa
- 4.5. South Africa
- 4.6. Rest of Middle East & Africa
-
5. Asia Pacific
- 5.1. China
- 5.2. India
- 5.3. Japan
- 5.4. South Korea
- 5.5. ASEAN
- 5.6. Oceania
- 5.7. Rest of Asia Pacific
Virtual Production Service Regional Market Share
Geographic Coverage of Virtual Production Service
Virtual Production Service REPORT HIGHLIGHTS
| Aspects | Details |
|---|---|
| Study Period | 2020-2034 |
| Base Year | 2025 |
| Estimated Year | 2026 |
| Forecast Period | 2026-2034 |
| Historical Period | 2020-2025 |
| Growth Rate | CAGR of 14.1% from 2020-2034 |
| Segmentation |
|
Table of Contents
- 1. Introduction
- 1.1. Research Scope
- 1.2. Market Segmentation
- 1.3. Research Methodology
- 1.4. Definitions and Assumptions
- 2. Executive Summary
- 2.1. Introduction
- 3. Market Dynamics
- 3.1. Introduction
- 3.2. Market Drivers
- 3.3. Market Restrains
- 3.4. Market Trends
- 4. Market Factor Analysis
- 4.1. Porters Five Forces
- 4.2. Supply/Value Chain
- 4.3. PESTEL analysis
- 4.4. Market Entropy
- 4.5. Patent/Trademark Analysis
- 5. Global Virtual Production Service Analysis, Insights and Forecast, 2020-2032
- 5.1. Market Analysis, Insights and Forecast - by Application
- 5.1.1. Broadcast
- 5.1.2. Streaming Media
- 5.1.3. Advertising
- 5.1.4. Film and TV
- 5.1.5. Others
- 5.2. Market Analysis, Insights and Forecast - by Types
- 5.2.1. Software
- 5.2.2. Services
- 5.3. Market Analysis, Insights and Forecast - by Region
- 5.3.1. North America
- 5.3.2. South America
- 5.3.3. Europe
- 5.3.4. Middle East & Africa
- 5.3.5. Asia Pacific
- 5.1. Market Analysis, Insights and Forecast - by Application
- 6. North America Virtual Production Service Analysis, Insights and Forecast, 2020-2032
- 6.1. Market Analysis, Insights and Forecast - by Application
- 6.1.1. Broadcast
- 6.1.2. Streaming Media
- 6.1.3. Advertising
- 6.1.4. Film and TV
- 6.1.5. Others
- 6.2. Market Analysis, Insights and Forecast - by Types
- 6.2.1. Software
- 6.2.2. Services
- 6.1. Market Analysis, Insights and Forecast - by Application
- 7. South America Virtual Production Service Analysis, Insights and Forecast, 2020-2032
- 7.1. Market Analysis, Insights and Forecast - by Application
- 7.1.1. Broadcast
- 7.1.2. Streaming Media
- 7.1.3. Advertising
- 7.1.4. Film and TV
- 7.1.5. Others
- 7.2. Market Analysis, Insights and Forecast - by Types
- 7.2.1. Software
- 7.2.2. Services
- 7.1. Market Analysis, Insights and Forecast - by Application
- 8. Europe Virtual Production Service Analysis, Insights and Forecast, 2020-2032
- 8.1. Market Analysis, Insights and Forecast - by Application
- 8.1.1. Broadcast
- 8.1.2. Streaming Media
- 8.1.3. Advertising
- 8.1.4. Film and TV
- 8.1.5. Others
- 8.2. Market Analysis, Insights and Forecast - by Types
- 8.2.1. Software
- 8.2.2. Services
- 8.1. Market Analysis, Insights and Forecast - by Application
- 9. Middle East & Africa Virtual Production Service Analysis, Insights and Forecast, 2020-2032
- 9.1. Market Analysis, Insights and Forecast - by Application
- 9.1.1. Broadcast
- 9.1.2. Streaming Media
- 9.1.3. Advertising
- 9.1.4. Film and TV
- 9.1.5. Others
- 9.2. Market Analysis, Insights and Forecast - by Types
- 9.2.1. Software
- 9.2.2. Services
- 9.1. Market Analysis, Insights and Forecast - by Application
- 10. Asia Pacific Virtual Production Service Analysis, Insights and Forecast, 2020-2032
- 10.1. Market Analysis, Insights and Forecast - by Application
- 10.1.1. Broadcast
- 10.1.2. Streaming Media
- 10.1.3. Advertising
- 10.1.4. Film and TV
- 10.1.5. Others
- 10.2. Market Analysis, Insights and Forecast - by Types
- 10.2.1. Software
- 10.2.2. Services
- 10.1. Market Analysis, Insights and Forecast - by Application
- 11. Competitive Analysis
- 11.1. Global Market Share Analysis 2025
- 11.2. Company Profiles
- 11.2.1 80six
- 11.2.1.1. Overview
- 11.2.1.2. Products
- 11.2.1.3. SWOT Analysis
- 11.2.1.4. Recent Developments
- 11.2.1.5. Financials (Based on Availability)
- 11.2.2 FuseFX
- 11.2.2.1. Overview
- 11.2.2.2. Products
- 11.2.2.3. SWOT Analysis
- 11.2.2.4. Recent Developments
- 11.2.2.5. Financials (Based on Availability)
- 11.2.3 cyd virtual studio
- 11.2.3.1. Overview
- 11.2.3.2. Products
- 11.2.3.3. SWOT Analysis
- 11.2.3.4. Recent Developments
- 11.2.3.5. Financials (Based on Availability)
- 11.2.4 NEP GROUP
- 11.2.4.1. Overview
- 11.2.4.2. Products
- 11.2.4.3. SWOT Analysis
- 11.2.4.4. Recent Developments
- 11.2.4.5. Financials (Based on Availability)
- 11.2.5 NantStudios
- 11.2.5.1. Overview
- 11.2.5.2. Products
- 11.2.5.3. SWOT Analysis
- 11.2.5.4. Recent Developments
- 11.2.5.5. Financials (Based on Availability)
- 11.2.6 PRG
- 11.2.6.1. Overview
- 11.2.6.2. Products
- 11.2.6.3. SWOT Analysis
- 11.2.6.4. Recent Developments
- 11.2.6.5. Financials (Based on Availability)
- 11.2.7 SHOWRUNNER
- 11.2.7.1. Overview
- 11.2.7.2. Products
- 11.2.7.3. SWOT Analysis
- 11.2.7.4. Recent Developments
- 11.2.7.5. Financials (Based on Availability)
- 11.2.8 Vū Technologies
- 11.2.8.1. Overview
- 11.2.8.2. Products
- 11.2.8.3. SWOT Analysis
- 11.2.8.4. Recent Developments
- 11.2.8.5. Financials (Based on Availability)
- 11.2.9 AOIN
- 11.2.9.1. Overview
- 11.2.9.2. Products
- 11.2.9.3. SWOT Analysis
- 11.2.9.4. Recent Developments
- 11.2.9.5. Financials (Based on Availability)
- 11.2.10 Mriya production
- 11.2.10.1. Overview
- 11.2.10.2. Products
- 11.2.10.3. SWOT Analysis
- 11.2.10.4. Recent Developments
- 11.2.10.5. Financials (Based on Availability)
- 11.2.11 DNEG
- 11.2.11.1. Overview
- 11.2.11.2. Products
- 11.2.11.3. SWOT Analysis
- 11.2.11.4. Recent Developments
- 11.2.11.5. Financials (Based on Availability)
- 11.2.12 Wētā FX
- 11.2.12.1. Overview
- 11.2.12.2. Products
- 11.2.12.3. SWOT Analysis
- 11.2.12.4. Recent Developments
- 11.2.12.5. Financials (Based on Availability)
- 11.2.13 Dark Matters
- 11.2.13.1. Overview
- 11.2.13.2. Products
- 11.2.13.3. SWOT Analysis
- 11.2.13.4. Recent Developments
- 11.2.13.5. Financials (Based on Availability)
- 11.2.14 Vero
- 11.2.14.1. Overview
- 11.2.14.2. Products
- 11.2.14.3. SWOT Analysis
- 11.2.14.4. Recent Developments
- 11.2.14.5. Financials (Based on Availability)
- 11.2.15 Mo-Sys
- 11.2.15.1. Overview
- 11.2.15.2. Products
- 11.2.15.3. SWOT Analysis
- 11.2.15.4. Recent Developments
- 11.2.15.5. Financials (Based on Availability)
- 11.2.16 Framestore
- 11.2.16.1. Overview
- 11.2.16.2. Products
- 11.2.16.3. SWOT Analysis
- 11.2.16.4. Recent Developments
- 11.2.16.5. Financials (Based on Availability)
- 11.2.17 Crew In Motion
- 11.2.17.1. Overview
- 11.2.17.2. Products
- 11.2.17.3. SWOT Analysis
- 11.2.17.4. Recent Developments
- 11.2.17.5. Financials (Based on Availability)
- 11.2.18 SoFlo Studios
- 11.2.18.1. Overview
- 11.2.18.2. Products
- 11.2.18.3. SWOT Analysis
- 11.2.18.4. Recent Developments
- 11.2.18.5. Financials (Based on Availability)
- 11.2.19 Lexhag
- 11.2.19.1. Overview
- 11.2.19.2. Products
- 11.2.19.3. SWOT Analysis
- 11.2.19.4. Recent Developments
- 11.2.19.5. Financials (Based on Availability)
- 11.2.20 Pixotope
- 11.2.20.1. Overview
- 11.2.20.2. Products
- 11.2.20.3. SWOT Analysis
- 11.2.20.4. Recent Developments
- 11.2.20.5. Financials (Based on Availability)
- 11.2.21 Tiltlabs
- 11.2.21.1. Overview
- 11.2.21.2. Products
- 11.2.21.3. SWOT Analysis
- 11.2.21.4. Recent Developments
- 11.2.21.5. Financials (Based on Availability)
- 11.2.22 Creative Technology
- 11.2.22.1. Overview
- 11.2.22.2. Products
- 11.2.22.3. SWOT Analysis
- 11.2.22.4. Recent Developments
- 11.2.22.5. Financials (Based on Availability)
- 11.2.23 Narwhal Studios
- 11.2.23.1. Overview
- 11.2.23.2. Products
- 11.2.23.3. SWOT Analysis
- 11.2.23.4. Recent Developments
- 11.2.23.5. Financials (Based on Availability)
- 11.2.24 Sony
- 11.2.24.1. Overview
- 11.2.24.2. Products
- 11.2.24.3. SWOT Analysis
- 11.2.24.4. Recent Developments
- 11.2.24.5. Financials (Based on Availability)
- 11.2.25 Solotech
- 11.2.25.1. Overview
- 11.2.25.2. Products
- 11.2.25.3. SWOT Analysis
- 11.2.25.4. Recent Developments
- 11.2.25.5. Financials (Based on Availability)
- 11.2.26 Fox
- 11.2.26.1. Overview
- 11.2.26.2. Products
- 11.2.26.3. SWOT Analysis
- 11.2.26.4. Recent Developments
- 11.2.26.5. Financials (Based on Availability)
- 11.2.1 80six
List of Figures
- Figure 1: Global Virtual Production Service Revenue Breakdown (million, %) by Region 2025 & 2033
- Figure 2: North America Virtual Production Service Revenue (million), by Application 2025 & 2033
- Figure 3: North America Virtual Production Service Revenue Share (%), by Application 2025 & 2033
- Figure 4: North America Virtual Production Service Revenue (million), by Types 2025 & 2033
- Figure 5: North America Virtual Production Service Revenue Share (%), by Types 2025 & 2033
- Figure 6: North America Virtual Production Service Revenue (million), by Country 2025 & 2033
- Figure 7: North America Virtual Production Service Revenue Share (%), by Country 2025 & 2033
- Figure 8: South America Virtual Production Service Revenue (million), by Application 2025 & 2033
- Figure 9: South America Virtual Production Service Revenue Share (%), by Application 2025 & 2033
- Figure 10: South America Virtual Production Service Revenue (million), by Types 2025 & 2033
- Figure 11: South America Virtual Production Service Revenue Share (%), by Types 2025 & 2033
- Figure 12: South America Virtual Production Service Revenue (million), by Country 2025 & 2033
- Figure 13: South America Virtual Production Service Revenue Share (%), by Country 2025 & 2033
- Figure 14: Europe Virtual Production Service Revenue (million), by Application 2025 & 2033
- Figure 15: Europe Virtual Production Service Revenue Share (%), by Application 2025 & 2033
- Figure 16: Europe Virtual Production Service Revenue (million), by Types 2025 & 2033
- Figure 17: Europe Virtual Production Service Revenue Share (%), by Types 2025 & 2033
- Figure 18: Europe Virtual Production Service Revenue (million), by Country 2025 & 2033
- Figure 19: Europe Virtual Production Service Revenue Share (%), by Country 2025 & 2033
- Figure 20: Middle East & Africa Virtual Production Service Revenue (million), by Application 2025 & 2033
- Figure 21: Middle East & Africa Virtual Production Service Revenue Share (%), by Application 2025 & 2033
- Figure 22: Middle East & Africa Virtual Production Service Revenue (million), by Types 2025 & 2033
- Figure 23: Middle East & Africa Virtual Production Service Revenue Share (%), by Types 2025 & 2033
- Figure 24: Middle East & Africa Virtual Production Service Revenue (million), by Country 2025 & 2033
- Figure 25: Middle East & Africa Virtual Production Service Revenue Share (%), by Country 2025 & 2033
- Figure 26: Asia Pacific Virtual Production Service Revenue (million), by Application 2025 & 2033
- Figure 27: Asia Pacific Virtual Production Service Revenue Share (%), by Application 2025 & 2033
- Figure 28: Asia Pacific Virtual Production Service Revenue (million), by Types 2025 & 2033
- Figure 29: Asia Pacific Virtual Production Service Revenue Share (%), by Types 2025 & 2033
- Figure 30: Asia Pacific Virtual Production Service Revenue (million), by Country 2025 & 2033
- Figure 31: Asia Pacific Virtual Production Service Revenue Share (%), by Country 2025 & 2033
List of Tables
- Table 1: Global Virtual Production Service Revenue million Forecast, by Application 2020 & 2033
- Table 2: Global Virtual Production Service Revenue million Forecast, by Types 2020 & 2033
- Table 3: Global Virtual Production Service Revenue million Forecast, by Region 2020 & 2033
- Table 4: Global Virtual Production Service Revenue million Forecast, by Application 2020 & 2033
- Table 5: Global Virtual Production Service Revenue million Forecast, by Types 2020 & 2033
- Table 6: Global Virtual Production Service Revenue million Forecast, by Country 2020 & 2033
- Table 7: United States Virtual Production Service Revenue (million) Forecast, by Application 2020 & 2033
- Table 8: Canada Virtual Production Service Revenue (million) Forecast, by Application 2020 & 2033
- Table 9: Mexico Virtual Production Service Revenue (million) Forecast, by Application 2020 & 2033
- Table 10: Global Virtual Production Service Revenue million Forecast, by Application 2020 & 2033
- Table 11: Global Virtual Production Service Revenue million Forecast, by Types 2020 & 2033
- Table 12: Global Virtual Production Service Revenue million Forecast, by Country 2020 & 2033
- Table 13: Brazil Virtual Production Service Revenue (million) Forecast, by Application 2020 & 2033
- Table 14: Argentina Virtual Production Service Revenue (million) Forecast, by Application 2020 & 2033
- Table 15: Rest of South America Virtual Production Service Revenue (million) Forecast, by Application 2020 & 2033
- Table 16: Global Virtual Production Service Revenue million Forecast, by Application 2020 & 2033
- Table 17: Global Virtual Production Service Revenue million Forecast, by Types 2020 & 2033
- Table 18: Global Virtual Production Service Revenue million Forecast, by Country 2020 & 2033
- Table 19: United Kingdom Virtual Production Service Revenue (million) Forecast, by Application 2020 & 2033
- Table 20: Germany Virtual Production Service Revenue (million) Forecast, by Application 2020 & 2033
- Table 21: France Virtual Production Service Revenue (million) Forecast, by Application 2020 & 2033
- Table 22: Italy Virtual Production Service Revenue (million) Forecast, by Application 2020 & 2033
- Table 23: Spain Virtual Production Service Revenue (million) Forecast, by Application 2020 & 2033
- Table 24: Russia Virtual Production Service Revenue (million) Forecast, by Application 2020 & 2033
- Table 25: Benelux Virtual Production Service Revenue (million) Forecast, by Application 2020 & 2033
- Table 26: Nordics Virtual Production Service Revenue (million) Forecast, by Application 2020 & 2033
- Table 27: Rest of Europe Virtual Production Service Revenue (million) Forecast, by Application 2020 & 2033
- Table 28: Global Virtual Production Service Revenue million Forecast, by Application 2020 & 2033
- Table 29: Global Virtual Production Service Revenue million Forecast, by Types 2020 & 2033
- Table 30: Global Virtual Production Service Revenue million Forecast, by Country 2020 & 2033
- Table 31: Turkey Virtual Production Service Revenue (million) Forecast, by Application 2020 & 2033
- Table 32: Israel Virtual Production Service Revenue (million) Forecast, by Application 2020 & 2033
- Table 33: GCC Virtual Production Service Revenue (million) Forecast, by Application 2020 & 2033
- Table 34: North Africa Virtual Production Service Revenue (million) Forecast, by Application 2020 & 2033
- Table 35: South Africa Virtual Production Service Revenue (million) Forecast, by Application 2020 & 2033
- Table 36: Rest of Middle East & Africa Virtual Production Service Revenue (million) Forecast, by Application 2020 & 2033
- Table 37: Global Virtual Production Service Revenue million Forecast, by Application 2020 & 2033
- Table 38: Global Virtual Production Service Revenue million Forecast, by Types 2020 & 2033
- Table 39: Global Virtual Production Service Revenue million Forecast, by Country 2020 & 2033
- Table 40: China Virtual Production Service Revenue (million) Forecast, by Application 2020 & 2033
- Table 41: India Virtual Production Service Revenue (million) Forecast, by Application 2020 & 2033
- Table 42: Japan Virtual Production Service Revenue (million) Forecast, by Application 2020 & 2033
- Table 43: South Korea Virtual Production Service Revenue (million) Forecast, by Application 2020 & 2033
- Table 44: ASEAN Virtual Production Service Revenue (million) Forecast, by Application 2020 & 2033
- Table 45: Oceania Virtual Production Service Revenue (million) Forecast, by Application 2020 & 2033
- Table 46: Rest of Asia Pacific Virtual Production Service Revenue (million) Forecast, by Application 2020 & 2033
Frequently Asked Questions
1. What is the projected Compound Annual Growth Rate (CAGR) of the Virtual Production Service?
The projected CAGR is approximately 14.1%.
2. Which companies are prominent players in the Virtual Production Service?
Key companies in the market include 80six, FuseFX, cyd virtual studio, NEP GROUP, NantStudios, PRG, SHOWRUNNER, Vū Technologies, AOIN, Mriya production, DNEG, Wētā FX, Dark Matters, Vero, Mo-Sys, Framestore, Crew In Motion, SoFlo Studios, Lexhag, Pixotope, Tiltlabs, Creative Technology, Narwhal Studios, Sony, Solotech, Fox.
3. What are the main segments of the Virtual Production Service?
The market segments include Application, Types.
4. Can you provide details about the market size?
The market size is estimated to be USD 2987 million as of 2022.
5. What are some drivers contributing to market growth?
N/A
6. What are the notable trends driving market growth?
N/A
7. Are there any restraints impacting market growth?
N/A
8. Can you provide examples of recent developments in the market?
N/A
9. What pricing options are available for accessing the report?
Pricing options include single-user, multi-user, and enterprise licenses priced at USD 4900.00, USD 7350.00, and USD 9800.00 respectively.
10. Is the market size provided in terms of value or volume?
The market size is provided in terms of value, measured in million.
11. Are there any specific market keywords associated with the report?
Yes, the market keyword associated with the report is "Virtual Production Service," which aids in identifying and referencing the specific market segment covered.
12. How do I determine which pricing option suits my needs best?
The pricing options vary based on user requirements and access needs. Individual users may opt for single-user licenses, while businesses requiring broader access may choose multi-user or enterprise licenses for cost-effective access to the report.
13. Are there any additional resources or data provided in the Virtual Production Service report?
While the report offers comprehensive insights, it's advisable to review the specific contents or supplementary materials provided to ascertain if additional resources or data are available.
14. How can I stay updated on further developments or reports in the Virtual Production Service?
To stay informed about further developments, trends, and reports in the Virtual Production Service, consider subscribing to industry newsletters, following relevant companies and organizations, or regularly checking reputable industry news sources and publications.
Methodology
Step 1 - Identification of Relevant Samples Size from Population Database


Step 2 - Approaches for Defining Global Market Size (Value, Volume* & Price*)

Note*: In applicable scenarios
Step 3 - Data Sources
Primary Research
- Web Analytics
- Survey Reports
- Research Institute
- Latest Research Reports
- Opinion Leaders
Secondary Research
- Annual Reports
- White Paper
- Latest Press Release
- Industry Association
- Paid Database
- Investor Presentations

Step 4 - Data Triangulation
Involves using different sources of information in order to increase the validity of a study
These sources are likely to be stakeholders in a program - participants, other researchers, program staff, other community members, and so on.
Then we put all data in single framework & apply various statistical tools to find out the dynamic on the market.
During the analysis stage, feedback from the stakeholder groups would be compared to determine areas of agreement as well as areas of divergence