

Key Insights
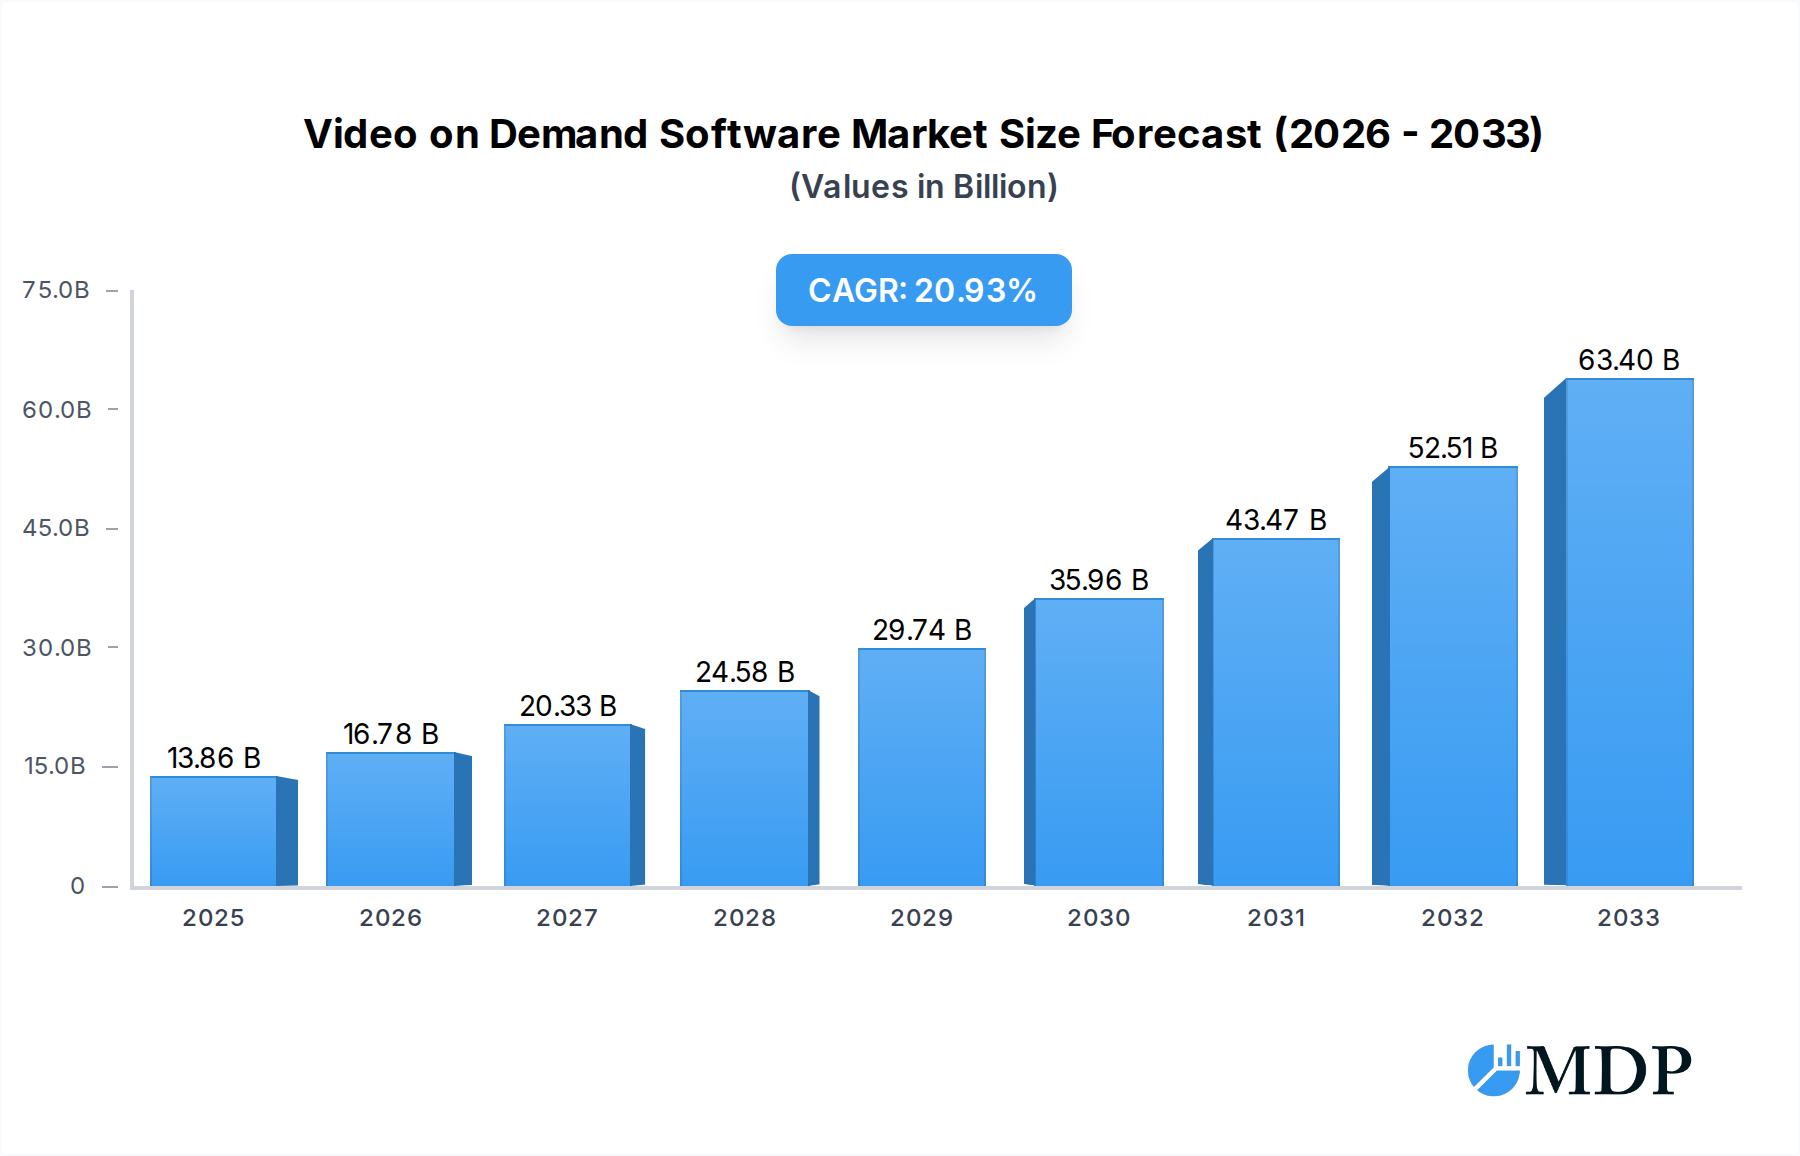
The global Video on Demand (VOD) software market is poised for remarkable expansion, projected to reach an impressive $13.86 billion in 2025, driven by a robust compound annual growth rate (CAGR) of 21.09%. This significant surge is fueled by several key factors. The insatiable consumer demand for personalized and on-demand entertainment content across various devices continues to be a primary driver. Furthermore, the increasing adoption of VOD services for educational and corporate training purposes is unlocking new revenue streams and expanding the market's reach. The proliferation of smart TVs, mobile devices, and enhanced internet infrastructure is making VOD solutions more accessible and convenient for a global audience. Network video kiosks and online commerce integration are also contributing to market growth by offering alternative access points and enhanced user experiences. The evolution of digital libraries, seeking to digitize and offer vast content repositories, further underpins this upward trajectory. The market is segmented across Transactional Video on Demand (TVOD), Subscription Video on Demand (SVOD), and Near-Video on Demand (NVOD), with SVOD expected to maintain a dominant position due to its recurring revenue model and customer loyalty.

Video on Demand Software Market Size (In Billion)
The competitive landscape is characterized by the presence of major technology giants alongside specialized VOD solution providers. Key players like IBM, SAP, Adobe, Microsoft, Apple, and Google are leveraging their existing ecosystems and cloud infrastructure to offer comprehensive VOD solutions. Emerging players and established network infrastructure companies such as Huawei Technologies, ZTE, and Cisco are also playing a crucial role in developing the underlying technology and enabling seamless content delivery. Akamai Technologies and Level 3 Communications, for instance, are vital in ensuring robust content delivery networks, while companies like Avaya and AT&T are integrating VOD capabilities into their communication and telecommunications services. The market's geographical segmentation highlights North America and Asia Pacific as leading regions, owing to high internet penetration and a strong appetite for digital content. However, Europe, the Middle East, and Africa are also witnessing significant growth as VOD adoption becomes more widespread. Continuous innovation in areas like personalized recommendations, 4K streaming, and interactive VOD experiences will continue to shape market dynamics and fuel future growth.
Video on Demand Software Company Market Share
Unlocking the Future of Content Delivery: A Comprehensive Report on Video on Demand (VOD) Software
Dive deep into the rapidly evolving Video on Demand (VOD) Software market with this in-depth industry analysis. This report provides actionable insights, strategic guidance, and critical data for stakeholders navigating the digital streaming landscape. Covering the historical period of 2019–2024 and forecasting through 2033, this research empowers you to capitalize on emerging trends, understand competitive dynamics, and make informed investment decisions. Explore market size projected to reach hundreds of billions, driven by the insatiable global demand for accessible, personalized entertainment and educational content.
Video on Demand Software Market Dynamics & Concentration
The Video on Demand (VOD) Software market exhibits a dynamic and evolving concentration. Innovation remains a primary driver, with companies constantly striving to enhance user experience, optimize streaming quality, and introduce new monetization models. Regulatory frameworks are also playing an increasingly significant role, impacting content licensing, data privacy, and cross-border distribution. Product substitutes, while present in the form of traditional broadcasting and physical media, are rapidly losing ground to the convenience and vast libraries offered by VOD solutions. End-user trends are overwhelmingly shifting towards on-demand consumption, favoring personalization and accessibility across all devices. Mergers and Acquisitions (M&A) activities are a key feature, with an estimated X billion in M&A deal value within the historical period, reflecting a consolidation trend and the pursuit of market dominance. Key players like IBM, SAP, Adobe, and Microsoft are actively investing, while emerging innovators like Lightbox and established tech giants such as Apple and Google are shaping the competitive landscape. Akamai Technologies and Cisco are crucial for infrastructure, while AT&T and Level 3 Communications provide backbone connectivity. Ericsson Television is a significant player in broadcast VOD solutions.
- Market Concentration: Moderate to High, with a trend towards consolidation.
- Innovation Drivers: AI-powered recommendations, personalized content, enhanced user interfaces, 4K/8K streaming, and interactive VOD features.
- Regulatory Frameworks: Evolving regulations around content licensing, data privacy (GDPR, CCPA), and digital rights management.
- Product Substitutes: Traditional linear TV, physical media (DVDs/Blu-rays), and live streaming events.
- End-User Trends: Growing demand for personalized content, multi-device access, ad-supported free tiers, and premium subscription models.
- M&A Activities: Significant deal volume driven by the pursuit of market share, technological capabilities, and content acquisition.
Video on Demand Software Industry Trends & Analysis
The Video on Demand (VOD) Software industry is experiencing unprecedented growth, projected to exceed a market size of hundreds of billions by 2033. This surge is fueled by a confluence of factors, including the exponential growth of internet penetration globally, the widespread adoption of smart devices, and a fundamental shift in consumer behavior towards on-demand content consumption. The Compound Annual Growth Rate (CAGR) is estimated to be in the double digits, driven by continuous technological advancements and increasing market penetration across diverse demographics. Technological disruptions are at the forefront, with advancements in AI and machine learning revolutionizing content discovery through sophisticated recommendation engines, personalizing the viewing experience to an unprecedented degree. Cloud computing infrastructure is enabling scalable and cost-effective VOD delivery, while edge computing is reducing latency for a seamless streaming experience. The proliferation of 5G technology is further accelerating this trend, offering faster speeds and lower latency, thereby supporting higher quality video streams and enabling new immersive experiences like augmented and virtual reality VOD.
Consumer preferences are increasingly dictating market direction. Viewers demand convenience, flexibility, and a vast library of content accessible anytime, anywhere. This has led to the dominance of subscription-based models (SVOD), where users pay a recurring fee for unlimited access to content. However, Transactional Video on Demand (TVOD) and Advertising Video on Demand (AVOD) models are also carving out significant niches, catering to users who prefer to rent or buy specific titles or consume content supported by advertisements. The competitive dynamics are fierce, with established media giants, technology behemoths like Google and Apple, and agile startups vying for market share. Companies like IBM, SAP, and Adobe are providing crucial backend infrastructure and content management solutions, while others like Lightbox are focusing on niche content offerings. The integration of social media features within VOD platforms is another growing trend, allowing for enhanced user engagement and community building. As the market matures, we anticipate further innovation in interactive VOD, live streaming integration, and the development of more sophisticated monetization strategies to cater to the evolving demands of a global audience eager to consume content on their own terms. The overall market penetration is steadily increasing, indicating a widespread acceptance and reliance on VOD services for entertainment, education, and information.
Leading Markets & Segments in Video on Demand Software
The global Video on Demand (VOD) Software market is characterized by dominant regional players and critical segment growth. North America currently leads, driven by its mature digital infrastructure, high disposable incomes, and a deeply ingrained culture of content consumption. The United States, in particular, stands out as the largest individual market, propelled by the presence of major VOD service providers and a highly engaged consumer base. However, the Asia-Pacific region is exhibiting the most rapid growth, fueled by increasing internet penetration, a burgeoning middle class, and a rising demand for digital entertainment in countries like China, India, and South Korea.
Within the Application segment, Entertainment overwhelmingly dominates the market. This encompasses everything from blockbuster movies and binge-worthy series to live sports and on-demand music. The sheer volume of content production and consumption in this sector underpins its market leadership. Education and Training represents a significant and rapidly growing segment, with the increasing adoption of e-learning platforms and corporate training modules leveraging VOD for accessible and flexible learning. Online Commerce is also a noteworthy segment, integrating video content for product demonstrations, shoppable videos, and live commerce experiences. While Network Video Kiosks and Digital Libraries are more niche, they represent specific use cases that contribute to the overall market diversity.
The Types of VOD software are also crucial to understanding market segmentation. Subscription Video on Demand (SVOD), exemplified by Netflix, Disney+, and Amazon Prime Video, is the most dominant type, offering a recurring revenue model and strong customer loyalty. Transactional Video on Demand (TVOD), where users rent or purchase content individually (e.g., Apple TV+, Google Play Movies & TV), holds a significant market share, particularly for new releases and specialized content. Near-Video on Demand (NVOD), offering scheduled content streams at short intervals, plays a role in specific broadcasting scenarios but is less prominent than SVOD and TVOD in the broader consumer market.
- Dominant Region: North America (especially the USA), with rapid growth anticipated in Asia-Pacific.
- Key Application Segments:
- Entertainment: Largest segment, driven by massive content libraries and consumer demand.
- Education and Training: Rapidly expanding due to e-learning and corporate adoption.
- Online Commerce: Growing with shoppable videos and live commerce integrations.
- Network Video Kiosks: Niche segment with specific deployment scenarios.
- Digital Libraries: Important for archival and educational institutions.
- Dominant VOD Types:
- Subscription Video on Demand (SVOD): Leading revenue generator, fostering customer loyalty.
- Transactional Video on Demand (TVOD): Significant for individual content purchases and rentals.
- Near-Video on Demand (NVOD): Utilized for scheduled content delivery, less prominent for general consumers.
Video on Demand Software Product Developments
Product development in VOD software is characterized by a relentless pursuit of enhanced user experience, advanced streaming capabilities, and innovative monetization. Key trends include the integration of AI for hyper-personalized content recommendations and predictive user behavior analysis, significantly boosting engagement and retention. Advanced codecs and adaptive bitrate streaming are enabling seamless, high-definition (4K/8K) playback across a wide range of devices and network conditions. The development of interactive VOD features, allowing viewers to make choices within content, and the seamless integration of live streaming capabilities are also prominent, blurring the lines between on-demand and real-time experiences. Competitive advantages are being gained through robust content management systems (CMS), secure digital rights management (DRM), and flexible scalability to accommodate millions of concurrent users. Players like IBM, SAP, and Adobe are providing enterprise-grade solutions, while others focus on user-centric applications.
Key Drivers of Video on Demand Software Growth
The exponential growth of the Video on Demand (VOD) Software market is propelled by several interconnected drivers. The widespread availability of high-speed internet and mobile connectivity, particularly with the advent of 5G, is foundational. The increasing affordability and prevalence of smart devices, including smartphones, tablets, smart TVs, and gaming consoles, have made VOD content accessible to a vast global audience. Furthermore, a significant shift in consumer behavior, prioritizing convenience and on-demand access over traditional linear broadcasting, is a primary catalyst. The continuous innovation in streaming technology, from higher resolution video (4K, 8K) to immersive experiences, keeps users engaged. The diverse and expanding content libraries, including original productions and licensed material, attract and retain subscribers across all demographics.
- Technological Advancements: 5G deployment, AI-powered recommendations, cloud infrastructure.
- Device Proliferation: Ubiquity of smartphones, smart TVs, and other connected devices.
- Consumer Behavior Shift: Preference for on-demand, personalized content consumption.
- Content Diversity & Originality: Growing libraries and exclusive original programming.
- Economic Factors: Increasing disposable incomes and willingness to subscribe to entertainment services.
Challenges in the Video on Demand Software Market
Despite its robust growth, the Video on Demand (VOD) Software market faces several significant challenges. Piracy and copyright infringement remain persistent threats, leading to substantial revenue losses for content creators and distributors. The escalating costs of content acquisition and production, coupled with intense competition, squeeze profit margins. The saturation of the market with numerous VOD services creates subscription fatigue among consumers, making customer acquisition and retention increasingly difficult and expensive, with estimated customer acquisition costs reaching hundreds of dollars. Regulatory hurdles, particularly concerning content localization, data privacy, and cross-border distribution rights, add complexity and can hinder market expansion. The substantial infrastructure investment required for robust streaming capabilities and global content delivery networks (CDNs) presents a barrier to entry for smaller players. Finally, the ongoing battle for subscriber loyalty necessitates continuous innovation and significant marketing expenditure.
- Content Piracy: Undermines revenue streams and intellectual property.
- High Content Costs: Escalating expenses for acquisition and original productions.
- Market Saturation & Subscription Fatigue: Increased competition for consumer attention and wallets.
- Regulatory Complexities: Navigating diverse global legal frameworks.
- Infrastructure Investment: Significant capital required for reliable streaming.
Emerging Opportunities in Video on Demand Software
The Video on Demand (VOD) Software market is ripe with emerging opportunities that promise to drive long-term growth. The expansion of VOD into emerging economies, with their rapidly growing internet infrastructure and young, tech-savvy populations, represents a vast untapped market. Technological breakthroughs, such as the further development of AI for hyper-personalization and the integration of augmented and virtual reality (AR/VR) for immersive viewing experiences, will create new avenues for engagement and monetization. Strategic partnerships between content creators, technology providers like IBM and SAP, and telecommunication companies (e.g., AT&T, Verizon) can unlock synergistic benefits and expand reach. The increasing demand for niche content and specialized VOD services, catering to specific interests and demographics, presents an opportunity for market differentiation. Furthermore, the integration of VOD with social commerce and interactive features will foster new revenue streams and enhance user engagement beyond passive viewing.
Leading Players in the Video on Demand Software Sector
- IBM
- SAP
- Adobe
- Microsoft
- Apple
- Lightbox
- Fujitsu
- ZTE
- Huawei Technologies
- Akamai Technologies
- Avaya
- Level 3 Communications
- AT&T
- Cisco
- Ericsson Television
Key Milestones in Video on Demand Software Industry
- 2019: Widespread adoption of 4K streaming technology becomes mainstream, enhancing visual quality and user expectations.
- 2020: Surge in SVOD subscriptions driven by global lockdowns, solidifying VOD as a primary entertainment source.
- 2021: Increased investment in original content production by major VOD platforms, leading to a content arms race.
- 2022: Expansion of Advertising-Supported Video on Demand (AVOD) models as a competitive pricing strategy.
- 2023: Significant advancements in AI-powered recommendation engines, leading to more personalized content discovery.
- 2024: Growing exploration of interactive VOD features and integration of live streaming within VOD platforms.
Strategic Outlook for Video on Demand Software Market
The strategic outlook for the Video on Demand (VOD) Software market remains exceptionally strong, poised for continued expansion and innovation. Growth accelerators will center on leveraging emerging technologies like AI for predictive analytics and hyper-personalized user experiences, alongside the widespread adoption of 5G for enhanced streaming quality and immersive content. The strategic imperative for market players will be to focus on differentiated content acquisition and creation, alongside exploring diversified monetization models beyond traditional subscriptions, including hybrid SVOD/AVOD approaches and transactional offerings. Expanding into underserved emerging markets, forming strategic alliances for content delivery and infrastructure, and investing in interactive and social VOD features will be crucial for capturing future market share and fostering long-term customer loyalty in this dynamic digital entertainment landscape.
Video on Demand Software Segmentation
-
1. Application
- 1.1. Entertainment
- 1.2. Education and Training
- 1.3. Network Video Kiosks
- 1.4. Online Commerce
- 1.5. Digital Libraries
- 1.6. Others
-
2. Types
- 2.1. Transactional Video on Demand (TVOD)
- 2.2. Subscription Video on Demand (SVOD)
- 2.3. Near-Video on Demand (NVOD)
- 2.4. Others
Video on Demand Software Segmentation By Geography
-
1. North America
- 1.1. United States
- 1.2. Canada
- 1.3. Mexico
-
2. South America
- 2.1. Brazil
- 2.2. Argentina
- 2.3. Rest of South America
-
3. Europe
- 3.1. United Kingdom
- 3.2. Germany
- 3.3. France
- 3.4. Italy
- 3.5. Spain
- 3.6. Russia
- 3.7. Benelux
- 3.8. Nordics
- 3.9. Rest of Europe
-
4. Middle East & Africa
- 4.1. Turkey
- 4.2. Israel
- 4.3. GCC
- 4.4. North Africa
- 4.5. South Africa
- 4.6. Rest of Middle East & Africa
-
5. Asia Pacific
- 5.1. China
- 5.2. India
- 5.3. Japan
- 5.4. South Korea
- 5.5. ASEAN
- 5.6. Oceania
- 5.7. Rest of Asia Pacific
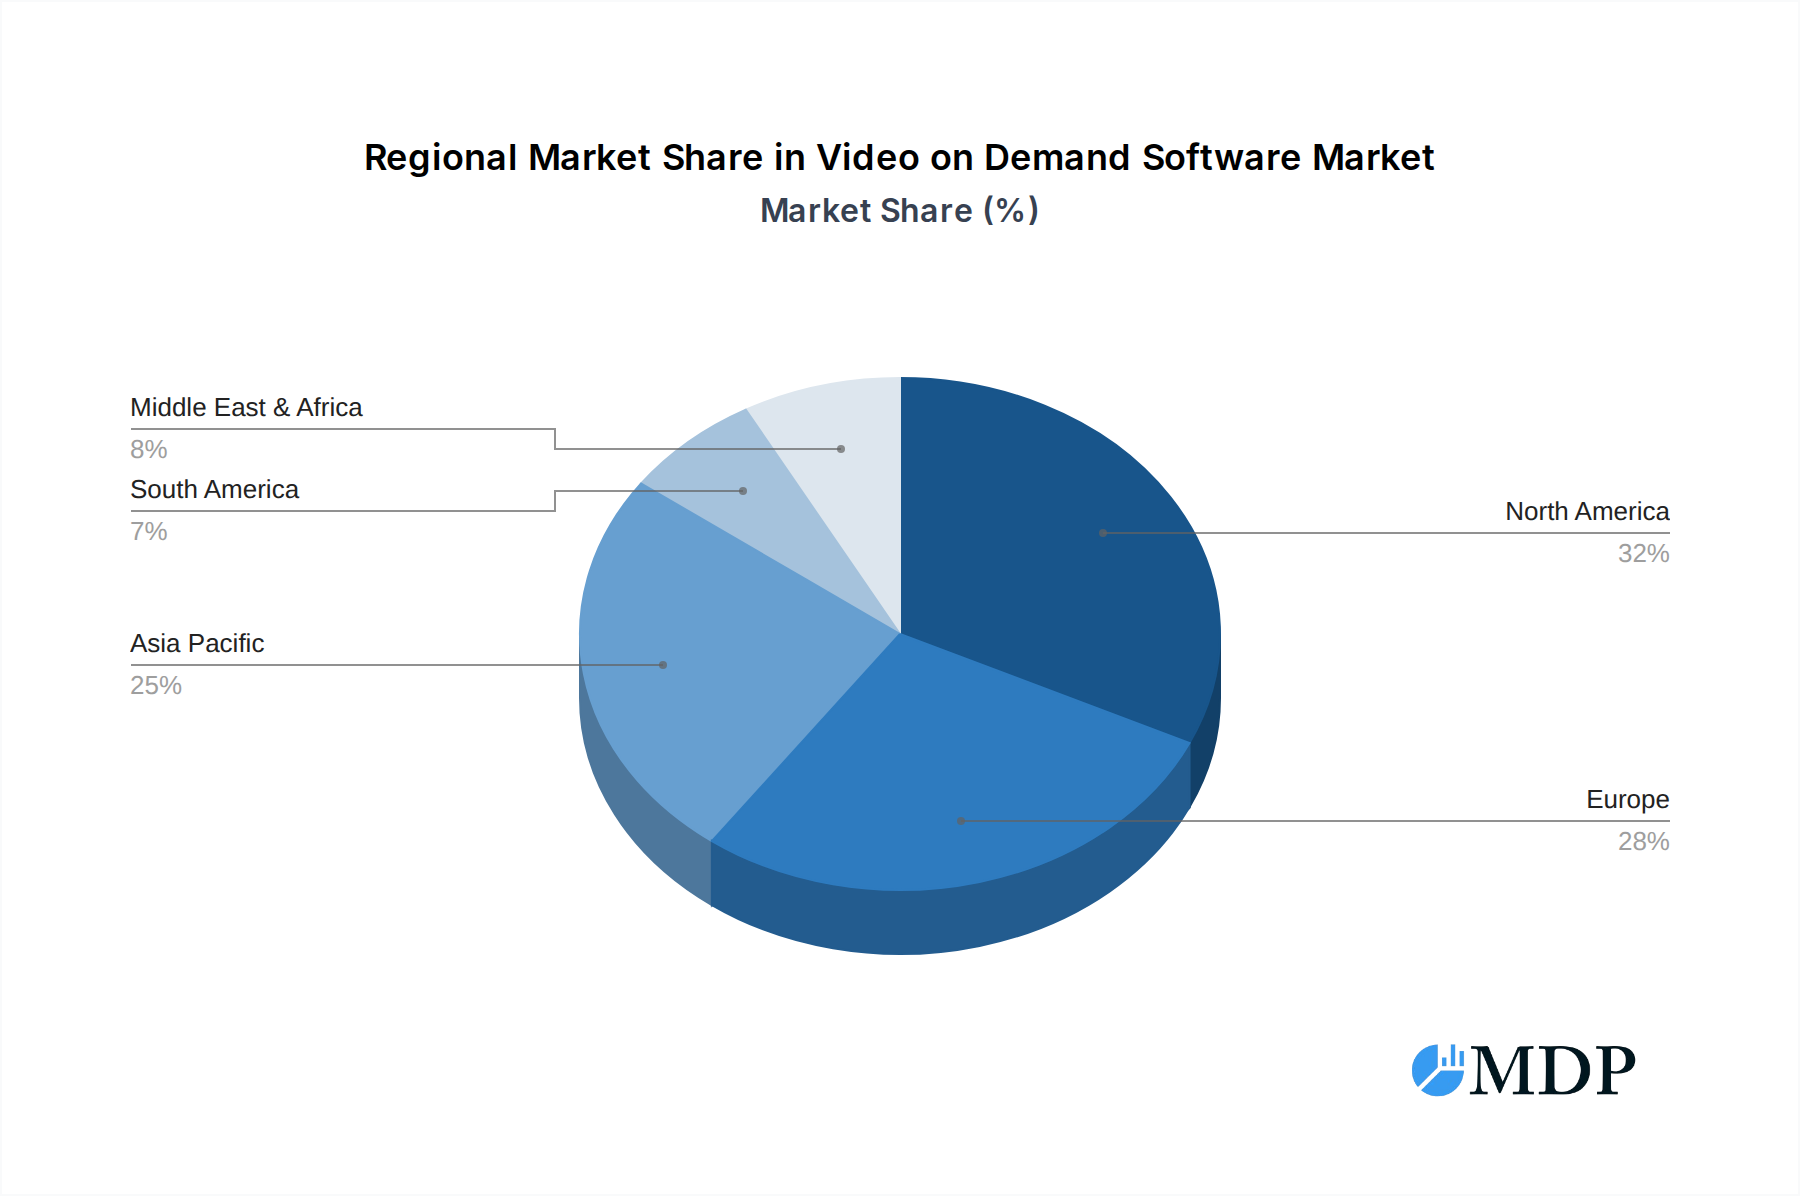
Video on Demand Software Regional Market Share
Geographic Coverage of Video on Demand Software
Video on Demand Software REPORT HIGHLIGHTS
| Aspects | Details |
|---|---|
| Study Period | 2020-2034 |
| Base Year | 2025 |
| Estimated Year | 2026 |
| Forecast Period | 2026-2034 |
| Historical Period | 2020-2025 |
| Growth Rate | CAGR of 16.4% from 2020-2034 |
| Segmentation |
|
Table of Contents
- 1. Introduction
- 1.1. Research Scope
- 1.2. Market Segmentation
- 1.3. Research Methodology
- 1.4. Definitions and Assumptions
- 2. Executive Summary
- 2.1. Introduction
- 3. Market Dynamics
- 3.1. Introduction
- 3.2. Market Drivers
- 3.3. Market Restrains
- 3.4. Market Trends
- 4. Market Factor Analysis
- 4.1. Porters Five Forces
- 4.2. Supply/Value Chain
- 4.3. PESTEL analysis
- 4.4. Market Entropy
- 4.5. Patent/Trademark Analysis
- 5. Global Video on Demand Software Analysis, Insights and Forecast, 2020-2032
- 5.1. Market Analysis, Insights and Forecast - by Application
- 5.1.1. Entertainment
- 5.1.2. Education and Training
- 5.1.3. Network Video Kiosks
- 5.1.4. Online Commerce
- 5.1.5. Digital Libraries
- 5.1.6. Others
- 5.2. Market Analysis, Insights and Forecast - by Types
- 5.2.1. Transactional Video on Demand (TVOD)
- 5.2.2. Subscription Video on Demand (SVOD)
- 5.2.3. Near-Video on Demand (NVOD)
- 5.2.4. Others
- 5.3. Market Analysis, Insights and Forecast - by Region
- 5.3.1. North America
- 5.3.2. South America
- 5.3.3. Europe
- 5.3.4. Middle East & Africa
- 5.3.5. Asia Pacific
- 5.1. Market Analysis, Insights and Forecast - by Application
- 6. North America Video on Demand Software Analysis, Insights and Forecast, 2020-2032
- 6.1. Market Analysis, Insights and Forecast - by Application
- 6.1.1. Entertainment
- 6.1.2. Education and Training
- 6.1.3. Network Video Kiosks
- 6.1.4. Online Commerce
- 6.1.5. Digital Libraries
- 6.1.6. Others
- 6.2. Market Analysis, Insights and Forecast - by Types
- 6.2.1. Transactional Video on Demand (TVOD)
- 6.2.2. Subscription Video on Demand (SVOD)
- 6.2.3. Near-Video on Demand (NVOD)
- 6.2.4. Others
- 6.1. Market Analysis, Insights and Forecast - by Application
- 7. South America Video on Demand Software Analysis, Insights and Forecast, 2020-2032
- 7.1. Market Analysis, Insights and Forecast - by Application
- 7.1.1. Entertainment
- 7.1.2. Education and Training
- 7.1.3. Network Video Kiosks
- 7.1.4. Online Commerce
- 7.1.5. Digital Libraries
- 7.1.6. Others
- 7.2. Market Analysis, Insights and Forecast - by Types
- 7.2.1. Transactional Video on Demand (TVOD)
- 7.2.2. Subscription Video on Demand (SVOD)
- 7.2.3. Near-Video on Demand (NVOD)
- 7.2.4. Others
- 7.1. Market Analysis, Insights and Forecast - by Application
- 8. Europe Video on Demand Software Analysis, Insights and Forecast, 2020-2032
- 8.1. Market Analysis, Insights and Forecast - by Application
- 8.1.1. Entertainment
- 8.1.2. Education and Training
- 8.1.3. Network Video Kiosks
- 8.1.4. Online Commerce
- 8.1.5. Digital Libraries
- 8.1.6. Others
- 8.2. Market Analysis, Insights and Forecast - by Types
- 8.2.1. Transactional Video on Demand (TVOD)
- 8.2.2. Subscription Video on Demand (SVOD)
- 8.2.3. Near-Video on Demand (NVOD)
- 8.2.4. Others
- 8.1. Market Analysis, Insights and Forecast - by Application
- 9. Middle East & Africa Video on Demand Software Analysis, Insights and Forecast, 2020-2032
- 9.1. Market Analysis, Insights and Forecast - by Application
- 9.1.1. Entertainment
- 9.1.2. Education and Training
- 9.1.3. Network Video Kiosks
- 9.1.4. Online Commerce
- 9.1.5. Digital Libraries
- 9.1.6. Others
- 9.2. Market Analysis, Insights and Forecast - by Types
- 9.2.1. Transactional Video on Demand (TVOD)
- 9.2.2. Subscription Video on Demand (SVOD)
- 9.2.3. Near-Video on Demand (NVOD)
- 9.2.4. Others
- 9.1. Market Analysis, Insights and Forecast - by Application
- 10. Asia Pacific Video on Demand Software Analysis, Insights and Forecast, 2020-2032
- 10.1. Market Analysis, Insights and Forecast - by Application
- 10.1.1. Entertainment
- 10.1.2. Education and Training
- 10.1.3. Network Video Kiosks
- 10.1.4. Online Commerce
- 10.1.5. Digital Libraries
- 10.1.6. Others
- 10.2. Market Analysis, Insights and Forecast - by Types
- 10.2.1. Transactional Video on Demand (TVOD)
- 10.2.2. Subscription Video on Demand (SVOD)
- 10.2.3. Near-Video on Demand (NVOD)
- 10.2.4. Others
- 10.1. Market Analysis, Insights and Forecast - by Application
- 11. Competitive Analysis
- 11.1. Global Market Share Analysis 2025
- 11.2. Company Profiles
- 11.2.1 IBM
- 11.2.1.1. Overview
- 11.2.1.2. Products
- 11.2.1.3. SWOT Analysis
- 11.2.1.4. Recent Developments
- 11.2.1.5. Financials (Based on Availability)
- 11.2.2 SAP
- 11.2.2.1. Overview
- 11.2.2.2. Products
- 11.2.2.3. SWOT Analysis
- 11.2.2.4. Recent Developments
- 11.2.2.5. Financials (Based on Availability)
- 11.2.3 Adobe
- 11.2.3.1. Overview
- 11.2.3.2. Products
- 11.2.3.3. SWOT Analysis
- 11.2.3.4. Recent Developments
- 11.2.3.5. Financials (Based on Availability)
- 11.2.4 Microsoft
- 11.2.4.1. Overview
- 11.2.4.2. Products
- 11.2.4.3. SWOT Analysis
- 11.2.4.4. Recent Developments
- 11.2.4.5. Financials (Based on Availability)
- 11.2.5 Apple
- 11.2.5.1. Overview
- 11.2.5.2. Products
- 11.2.5.3. SWOT Analysis
- 11.2.5.4. Recent Developments
- 11.2.5.5. Financials (Based on Availability)
- 11.2.6 Google
- 11.2.6.1. Overview
- 11.2.6.2. Products
- 11.2.6.3. SWOT Analysis
- 11.2.6.4. Recent Developments
- 11.2.6.5. Financials (Based on Availability)
- 11.2.7 Lightbox
- 11.2.7.1. Overview
- 11.2.7.2. Products
- 11.2.7.3. SWOT Analysis
- 11.2.7.4. Recent Developments
- 11.2.7.5. Financials (Based on Availability)
- 11.2.8 Fujitsu
- 11.2.8.1. Overview
- 11.2.8.2. Products
- 11.2.8.3. SWOT Analysis
- 11.2.8.4. Recent Developments
- 11.2.8.5. Financials (Based on Availability)
- 11.2.9 ZTE
- 11.2.9.1. Overview
- 11.2.9.2. Products
- 11.2.9.3. SWOT Analysis
- 11.2.9.4. Recent Developments
- 11.2.9.5. Financials (Based on Availability)
- 11.2.10 Huawei Technologies
- 11.2.10.1. Overview
- 11.2.10.2. Products
- 11.2.10.3. SWOT Analysis
- 11.2.10.4. Recent Developments
- 11.2.10.5. Financials (Based on Availability)
- 11.2.11 Akamai Technologies
- 11.2.11.1. Overview
- 11.2.11.2. Products
- 11.2.11.3. SWOT Analysis
- 11.2.11.4. Recent Developments
- 11.2.11.5. Financials (Based on Availability)
- 11.2.12 Avaya
- 11.2.12.1. Overview
- 11.2.12.2. Products
- 11.2.12.3. SWOT Analysis
- 11.2.12.4. Recent Developments
- 11.2.12.5. Financials (Based on Availability)
- 11.2.13 Level 3 Communications
- 11.2.13.1. Overview
- 11.2.13.2. Products
- 11.2.13.3. SWOT Analysis
- 11.2.13.4. Recent Developments
- 11.2.13.5. Financials (Based on Availability)
- 11.2.14 AT&T
- 11.2.14.1. Overview
- 11.2.14.2. Products
- 11.2.14.3. SWOT Analysis
- 11.2.14.4. Recent Developments
- 11.2.14.5. Financials (Based on Availability)
- 11.2.15 Cisco
- 11.2.15.1. Overview
- 11.2.15.2. Products
- 11.2.15.3. SWOT Analysis
- 11.2.15.4. Recent Developments
- 11.2.15.5. Financials (Based on Availability)
- 11.2.16 Ericsson Television
- 11.2.16.1. Overview
- 11.2.16.2. Products
- 11.2.16.3. SWOT Analysis
- 11.2.16.4. Recent Developments
- 11.2.16.5. Financials (Based on Availability)
- 11.2.1 IBM
List of Figures
- Figure 1: Global Video on Demand Software Revenue Breakdown (undefined, %) by Region 2025 & 2033
- Figure 2: North America Video on Demand Software Revenue (undefined), by Application 2025 & 2033
- Figure 3: North America Video on Demand Software Revenue Share (%), by Application 2025 & 2033
- Figure 4: North America Video on Demand Software Revenue (undefined), by Types 2025 & 2033
- Figure 5: North America Video on Demand Software Revenue Share (%), by Types 2025 & 2033
- Figure 6: North America Video on Demand Software Revenue (undefined), by Country 2025 & 2033
- Figure 7: North America Video on Demand Software Revenue Share (%), by Country 2025 & 2033
- Figure 8: South America Video on Demand Software Revenue (undefined), by Application 2025 & 2033
- Figure 9: South America Video on Demand Software Revenue Share (%), by Application 2025 & 2033
- Figure 10: South America Video on Demand Software Revenue (undefined), by Types 2025 & 2033
- Figure 11: South America Video on Demand Software Revenue Share (%), by Types 2025 & 2033
- Figure 12: South America Video on Demand Software Revenue (undefined), by Country 2025 & 2033
- Figure 13: South America Video on Demand Software Revenue Share (%), by Country 2025 & 2033
- Figure 14: Europe Video on Demand Software Revenue (undefined), by Application 2025 & 2033
- Figure 15: Europe Video on Demand Software Revenue Share (%), by Application 2025 & 2033
- Figure 16: Europe Video on Demand Software Revenue (undefined), by Types 2025 & 2033
- Figure 17: Europe Video on Demand Software Revenue Share (%), by Types 2025 & 2033
- Figure 18: Europe Video on Demand Software Revenue (undefined), by Country 2025 & 2033
- Figure 19: Europe Video on Demand Software Revenue Share (%), by Country 2025 & 2033
- Figure 20: Middle East & Africa Video on Demand Software Revenue (undefined), by Application 2025 & 2033
- Figure 21: Middle East & Africa Video on Demand Software Revenue Share (%), by Application 2025 & 2033
- Figure 22: Middle East & Africa Video on Demand Software Revenue (undefined), by Types 2025 & 2033
- Figure 23: Middle East & Africa Video on Demand Software Revenue Share (%), by Types 2025 & 2033
- Figure 24: Middle East & Africa Video on Demand Software Revenue (undefined), by Country 2025 & 2033
- Figure 25: Middle East & Africa Video on Demand Software Revenue Share (%), by Country 2025 & 2033
- Figure 26: Asia Pacific Video on Demand Software Revenue (undefined), by Application 2025 & 2033
- Figure 27: Asia Pacific Video on Demand Software Revenue Share (%), by Application 2025 & 2033
- Figure 28: Asia Pacific Video on Demand Software Revenue (undefined), by Types 2025 & 2033
- Figure 29: Asia Pacific Video on Demand Software Revenue Share (%), by Types 2025 & 2033
- Figure 30: Asia Pacific Video on Demand Software Revenue (undefined), by Country 2025 & 2033
- Figure 31: Asia Pacific Video on Demand Software Revenue Share (%), by Country 2025 & 2033
List of Tables
- Table 1: Global Video on Demand Software Revenue undefined Forecast, by Application 2020 & 2033
- Table 2: Global Video on Demand Software Revenue undefined Forecast, by Types 2020 & 2033
- Table 3: Global Video on Demand Software Revenue undefined Forecast, by Region 2020 & 2033
- Table 4: Global Video on Demand Software Revenue undefined Forecast, by Application 2020 & 2033
- Table 5: Global Video on Demand Software Revenue undefined Forecast, by Types 2020 & 2033
- Table 6: Global Video on Demand Software Revenue undefined Forecast, by Country 2020 & 2033
- Table 7: United States Video on Demand Software Revenue (undefined) Forecast, by Application 2020 & 2033
- Table 8: Canada Video on Demand Software Revenue (undefined) Forecast, by Application 2020 & 2033
- Table 9: Mexico Video on Demand Software Revenue (undefined) Forecast, by Application 2020 & 2033
- Table 10: Global Video on Demand Software Revenue undefined Forecast, by Application 2020 & 2033
- Table 11: Global Video on Demand Software Revenue undefined Forecast, by Types 2020 & 2033
- Table 12: Global Video on Demand Software Revenue undefined Forecast, by Country 2020 & 2033
- Table 13: Brazil Video on Demand Software Revenue (undefined) Forecast, by Application 2020 & 2033
- Table 14: Argentina Video on Demand Software Revenue (undefined) Forecast, by Application 2020 & 2033
- Table 15: Rest of South America Video on Demand Software Revenue (undefined) Forecast, by Application 2020 & 2033
- Table 16: Global Video on Demand Software Revenue undefined Forecast, by Application 2020 & 2033
- Table 17: Global Video on Demand Software Revenue undefined Forecast, by Types 2020 & 2033
- Table 18: Global Video on Demand Software Revenue undefined Forecast, by Country 2020 & 2033
- Table 19: United Kingdom Video on Demand Software Revenue (undefined) Forecast, by Application 2020 & 2033
- Table 20: Germany Video on Demand Software Revenue (undefined) Forecast, by Application 2020 & 2033
- Table 21: France Video on Demand Software Revenue (undefined) Forecast, by Application 2020 & 2033
- Table 22: Italy Video on Demand Software Revenue (undefined) Forecast, by Application 2020 & 2033
- Table 23: Spain Video on Demand Software Revenue (undefined) Forecast, by Application 2020 & 2033
- Table 24: Russia Video on Demand Software Revenue (undefined) Forecast, by Application 2020 & 2033
- Table 25: Benelux Video on Demand Software Revenue (undefined) Forecast, by Application 2020 & 2033
- Table 26: Nordics Video on Demand Software Revenue (undefined) Forecast, by Application 2020 & 2033
- Table 27: Rest of Europe Video on Demand Software Revenue (undefined) Forecast, by Application 2020 & 2033
- Table 28: Global Video on Demand Software Revenue undefined Forecast, by Application 2020 & 2033
- Table 29: Global Video on Demand Software Revenue undefined Forecast, by Types 2020 & 2033
- Table 30: Global Video on Demand Software Revenue undefined Forecast, by Country 2020 & 2033
- Table 31: Turkey Video on Demand Software Revenue (undefined) Forecast, by Application 2020 & 2033
- Table 32: Israel Video on Demand Software Revenue (undefined) Forecast, by Application 2020 & 2033
- Table 33: GCC Video on Demand Software Revenue (undefined) Forecast, by Application 2020 & 2033
- Table 34: North Africa Video on Demand Software Revenue (undefined) Forecast, by Application 2020 & 2033
- Table 35: South Africa Video on Demand Software Revenue (undefined) Forecast, by Application 2020 & 2033
- Table 36: Rest of Middle East & Africa Video on Demand Software Revenue (undefined) Forecast, by Application 2020 & 2033
- Table 37: Global Video on Demand Software Revenue undefined Forecast, by Application 2020 & 2033
- Table 38: Global Video on Demand Software Revenue undefined Forecast, by Types 2020 & 2033
- Table 39: Global Video on Demand Software Revenue undefined Forecast, by Country 2020 & 2033
- Table 40: China Video on Demand Software Revenue (undefined) Forecast, by Application 2020 & 2033
- Table 41: India Video on Demand Software Revenue (undefined) Forecast, by Application 2020 & 2033
- Table 42: Japan Video on Demand Software Revenue (undefined) Forecast, by Application 2020 & 2033
- Table 43: South Korea Video on Demand Software Revenue (undefined) Forecast, by Application 2020 & 2033
- Table 44: ASEAN Video on Demand Software Revenue (undefined) Forecast, by Application 2020 & 2033
- Table 45: Oceania Video on Demand Software Revenue (undefined) Forecast, by Application 2020 & 2033
- Table 46: Rest of Asia Pacific Video on Demand Software Revenue (undefined) Forecast, by Application 2020 & 2033
Frequently Asked Questions
1. What is the projected Compound Annual Growth Rate (CAGR) of the Video on Demand Software?
The projected CAGR is approximately 16.4%.
2. Which companies are prominent players in the Video on Demand Software?
Key companies in the market include IBM, SAP, Adobe, Microsoft, Apple, Google, Lightbox, Fujitsu, ZTE, Huawei Technologies, Akamai Technologies, Avaya, Level 3 Communications, AT&T, Cisco, Ericsson Television.
3. What are the main segments of the Video on Demand Software?
The market segments include Application, Types.
4. Can you provide details about the market size?
The market size is estimated to be USD XXX N/A as of 2022.
5. What are some drivers contributing to market growth?
N/A
6. What are the notable trends driving market growth?
N/A
7. Are there any restraints impacting market growth?
N/A
8. Can you provide examples of recent developments in the market?
N/A
9. What pricing options are available for accessing the report?
Pricing options include single-user, multi-user, and enterprise licenses priced at USD 4900.00, USD 7350.00, and USD 9800.00 respectively.
10. Is the market size provided in terms of value or volume?
The market size is provided in terms of value, measured in N/A.
11. Are there any specific market keywords associated with the report?
Yes, the market keyword associated with the report is "Video on Demand Software," which aids in identifying and referencing the specific market segment covered.
12. How do I determine which pricing option suits my needs best?
The pricing options vary based on user requirements and access needs. Individual users may opt for single-user licenses, while businesses requiring broader access may choose multi-user or enterprise licenses for cost-effective access to the report.
13. Are there any additional resources or data provided in the Video on Demand Software report?
While the report offers comprehensive insights, it's advisable to review the specific contents or supplementary materials provided to ascertain if additional resources or data are available.
14. How can I stay updated on further developments or reports in the Video on Demand Software?
To stay informed about further developments, trends, and reports in the Video on Demand Software, consider subscribing to industry newsletters, following relevant companies and organizations, or regularly checking reputable industry news sources and publications.
Methodology
Step 1 - Identification of Relevant Samples Size from Population Database


Step 2 - Approaches for Defining Global Market Size (Value, Volume* & Price*)

Note*: In applicable scenarios
Step 3 - Data Sources
Primary Research
- Web Analytics
- Survey Reports
- Research Institute
- Latest Research Reports
- Opinion Leaders
Secondary Research
- Annual Reports
- White Paper
- Latest Press Release
- Industry Association
- Paid Database
- Investor Presentations

Step 4 - Data Triangulation
Involves using different sources of information in order to increase the validity of a study
These sources are likely to be stakeholders in a program - participants, other researchers, program staff, other community members, and so on.
Then we put all data in single framework & apply various statistical tools to find out the dynamic on the market.
During the analysis stage, feedback from the stakeholder groups would be compared to determine areas of agreement as well as areas of divergence