

Key Insights
The global Veterinary Orthopedic Joint Replacement Implants market is poised for substantial growth, projected to reach USD 13.77 billion in 2025. Driven by an impressive 11.05% CAGR over the forecast period from 2019 to 2033, this expansion signifies a growing commitment to advanced healthcare for companion animals. Key drivers fueling this upward trajectory include the increasing humanization of pets, leading owners to invest more in their animals' well-being and longevity, and a concurrent rise in the prevalence of orthopedic conditions in pets. Advances in implant materials and surgical techniques are also playing a crucial role, offering more effective and less invasive solutions for joint ailments. The market is segmented by application into Pet Hospitals, Veterinary Clinics, Zoos, and Others, with veterinary clinics and pet hospitals expected to dominate due to higher patient volumes and specialized care offerings.
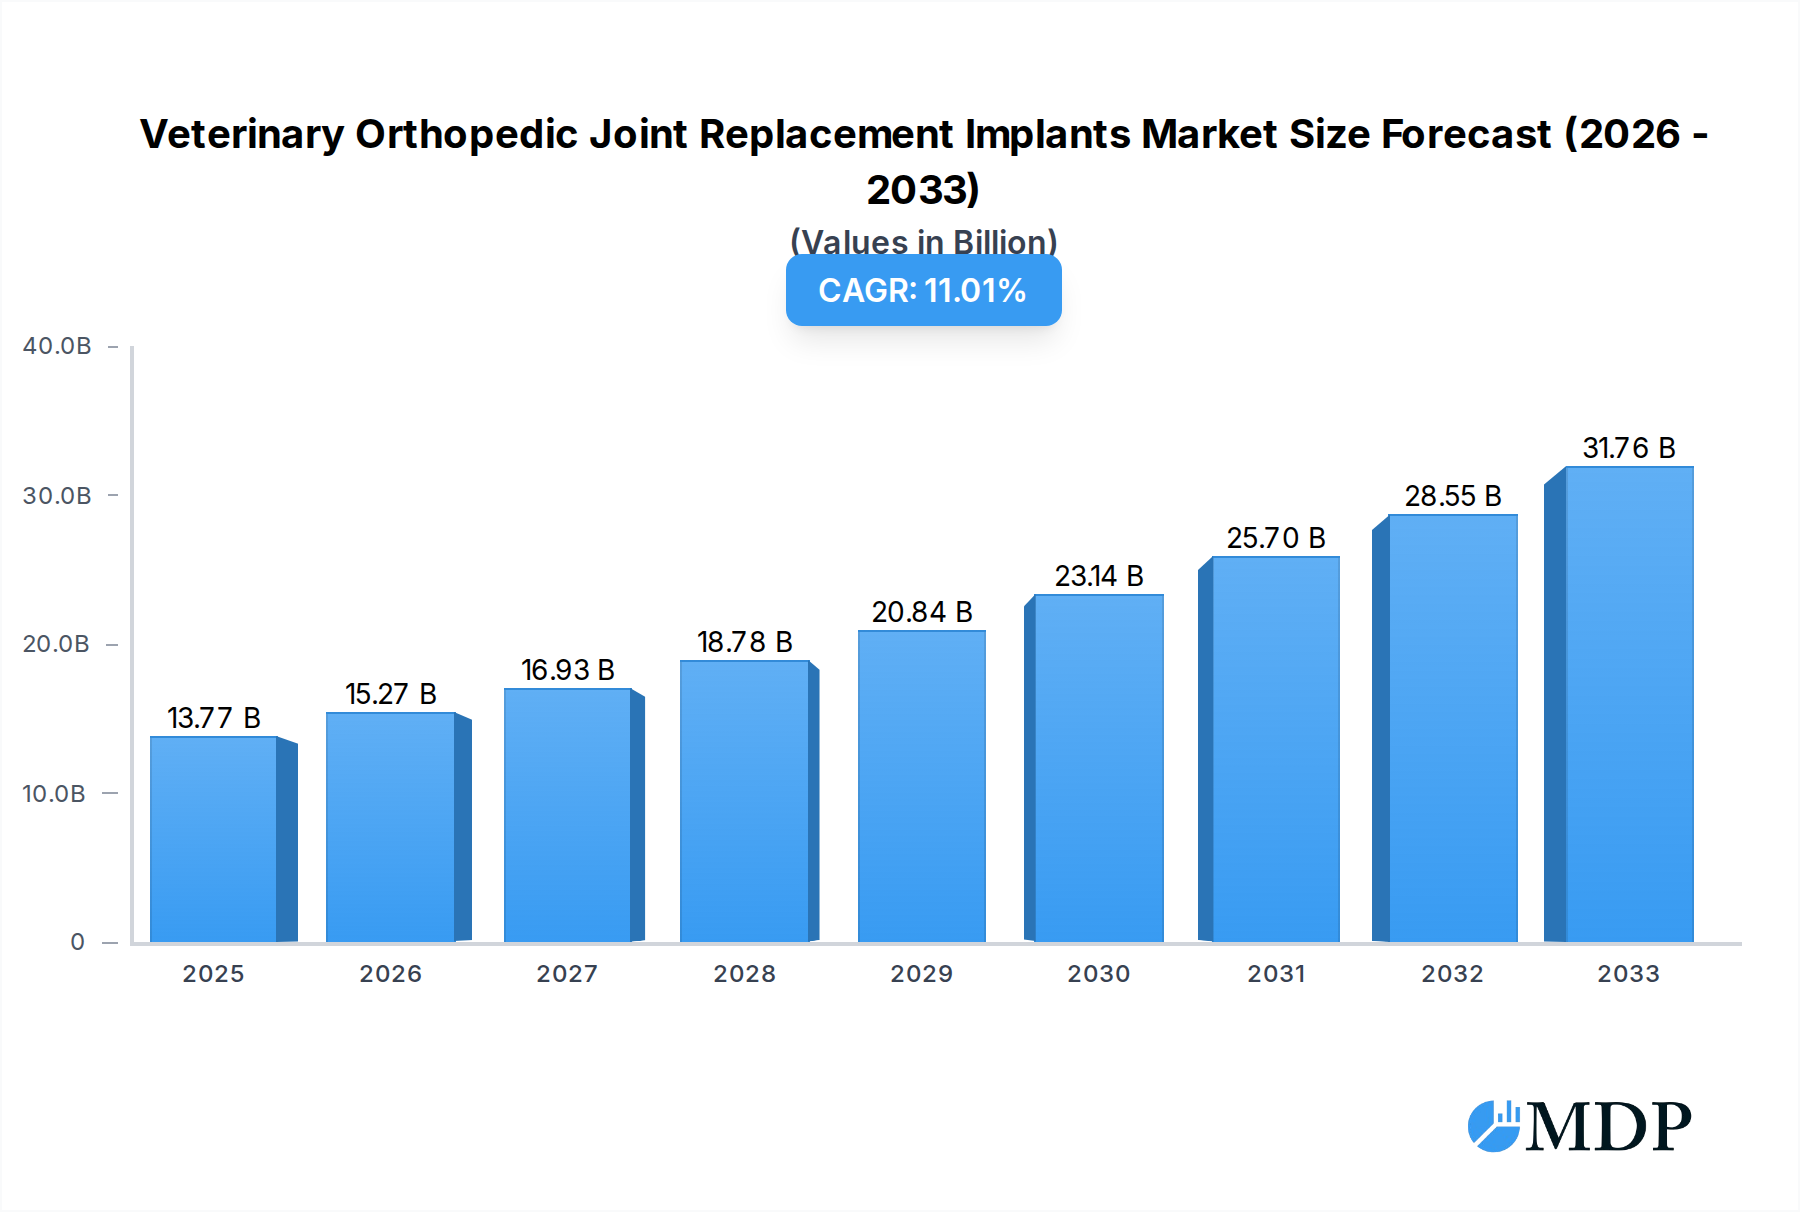
Veterinary Orthopedic Joint Replacement Implants Market Size (In Billion)
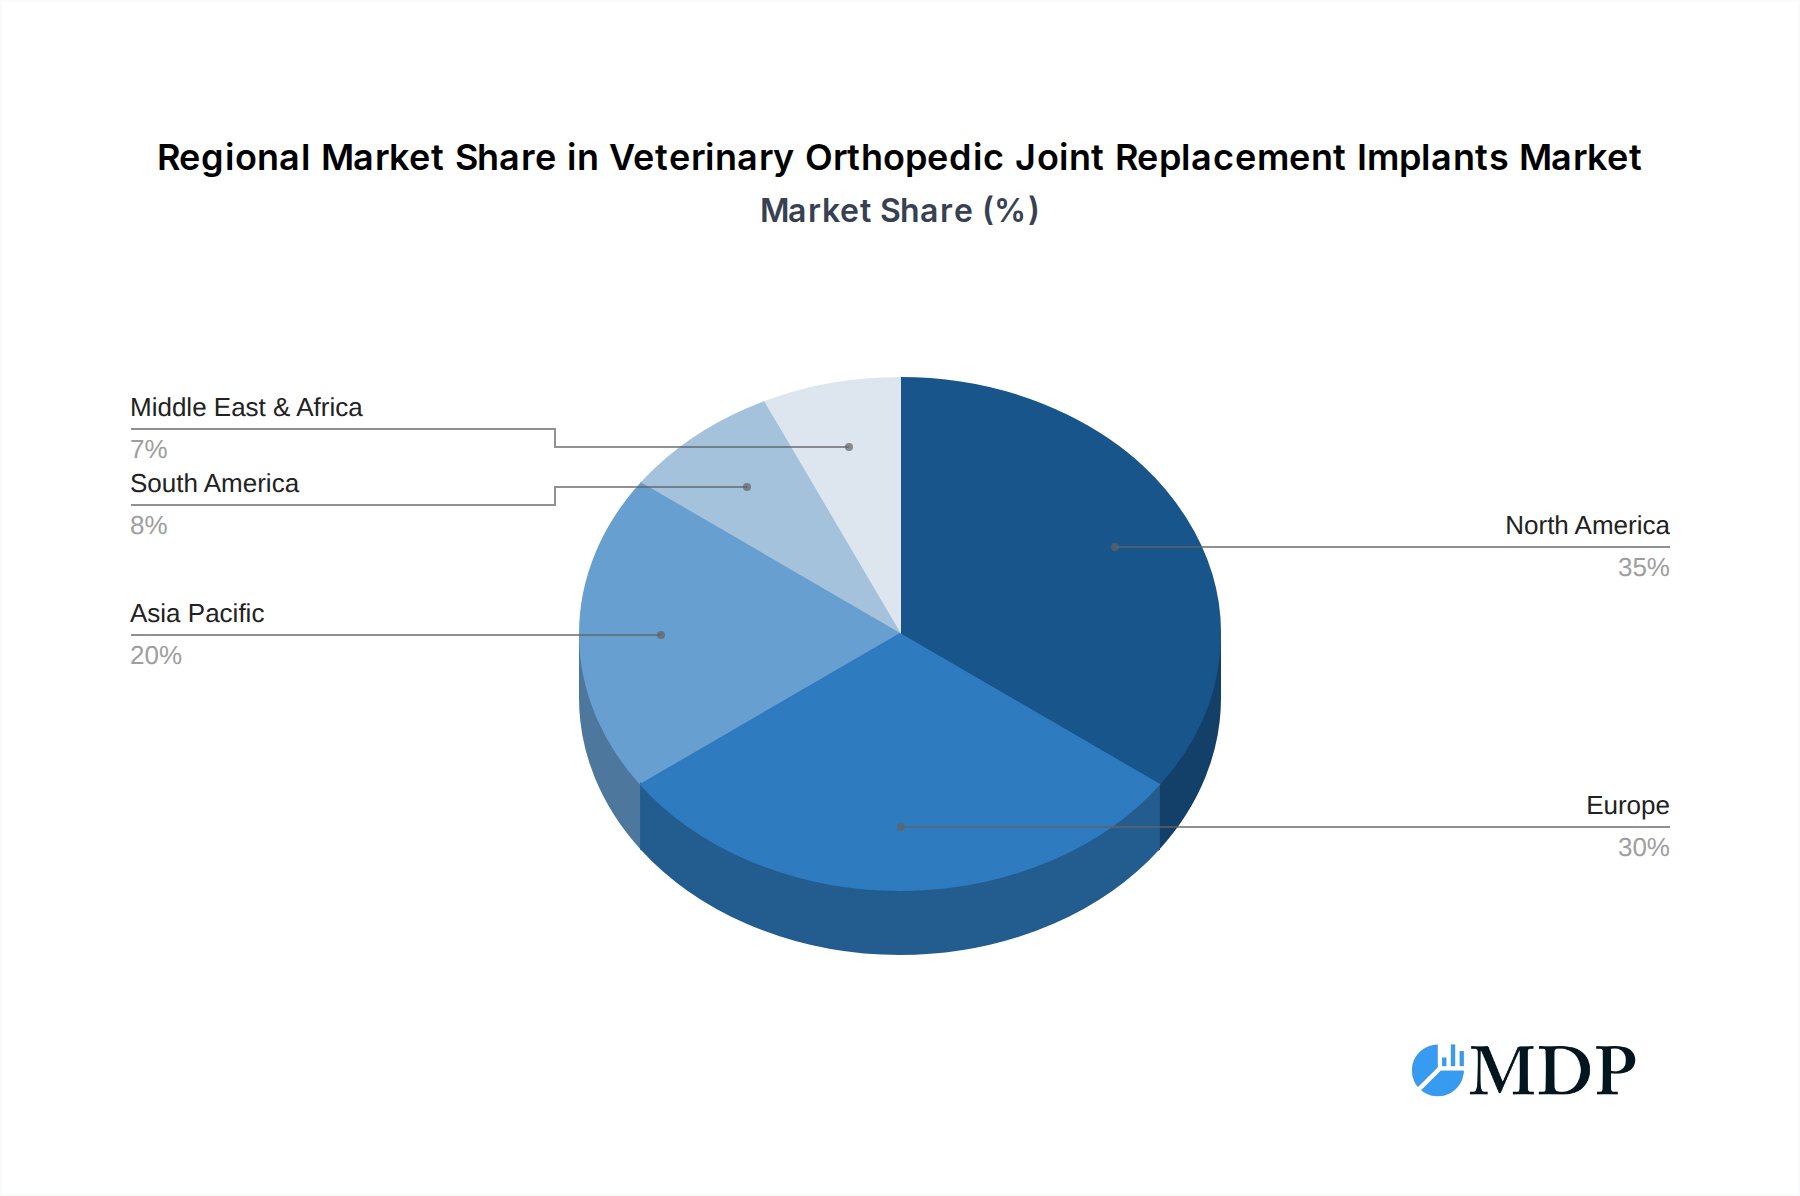
The market is further segmented by implant type, with Ceramics Implants, Metals Implants, Polymers Implants, and Others representing the primary categories. Metal implants, particularly those made from titanium and cobalt-chrome alloys, currently hold a significant share due to their durability and established track record, but advancements in biocompatible polymers and ceramic composites are steadily gaining traction, promising improved integration and reduced wear. Geographically, North America and Europe are anticipated to lead the market, owing to well-established veterinary healthcare infrastructure and higher pet expenditure. However, the Asia Pacific region is expected to witness the fastest growth, fueled by a rapidly expanding pet population and increasing awareness of advanced veterinary treatments. Despite the positive outlook, potential restraints such as the high cost of specialized implants and the need for skilled veterinary surgeons could present challenges, though ongoing research and development are actively addressing these factors to ensure broader accessibility.

Veterinary Orthopedic Joint Replacement Implants Company Market Share
Veterinary Orthopedic Joint Replacement Implants Market: Comprehensive Analysis and Future Outlook (2019-2033)
This in-depth report provides a comprehensive analysis of the global Veterinary Orthopedic Joint Replacement Implants market, offering actionable insights for industry stakeholders. Covering a study period from 2019 to 2033, with a base year of 2025 and a forecast period extending to 2033, this report delves into market dynamics, trends, leading segments, key players, and future opportunities. Gain a competitive edge with data-driven strategies and predictions for the rapidly evolving veterinary orthopedic implant sector.
Veterinary Orthopedic Joint Replacement Implants Market Dynamics & Concentration
The global Veterinary Orthopedic Joint Replacement Implants market is characterized by a moderate to high concentration, with a few key players dominating a significant portion of the market share, estimated to be over 70% of the total market value exceeding $8 billion. Innovation drivers such as advancements in biomaterials, minimally invasive surgical techniques, and the increasing adoption of advanced imaging technologies are fueling market growth. The regulatory framework, while evolving, is generally supportive, with strict quality control measures in place to ensure product safety and efficacy, leading to an estimated 95% compliance rate among manufacturers. Product substitutes, primarily traditional orthopedic repair methods and physical therapy, are present but are increasingly being overshadowed by the superior outcomes and faster recovery times offered by joint replacement implants, impacting their market penetration by less than 15%. End-user trends indicate a strong preference for advanced solutions, driven by a growing pet humanization movement and a willingness among pet owners to invest in their animals' well-being, contributing to a substantial increase in demand across pet hospitals and veterinary clinics. Mergers and acquisitions (M&A) activities are a notable aspect of market concentration, with an estimated 15 major M&A deals in the historical period (2019-2024) aimed at expanding product portfolios, geographic reach, and technological capabilities.
Veterinary Orthopedic Joint Replacement Implants Industry Trends & Analysis
The Veterinary Orthopedic Joint Replacement Implants industry is experiencing robust growth, propelled by a confluence of factors that are reshaping the landscape of animal healthcare. The market is projected to witness a Compound Annual Growth Rate (CAGR) of approximately 8.5% over the forecast period, leading to a projected market size of over $15 billion by 2033. A primary market growth driver is the escalating trend of pet humanization, where pets are increasingly viewed as integral family members, prompting owners to seek advanced medical interventions for their well-being and longevity. This has directly translated into a significant surge in demand for orthopedic procedures, including joint replacement, particularly for common ailments affecting dogs and cats, such as hip dysplasia and osteoarthritis.
Technological disruptions are playing a pivotal role in advancing the industry. Innovations in material science have led to the development of more biocompatible and durable implant materials, including advanced ceramics and high-performance polymers, which offer improved longevity and reduced rejection rates. Furthermore, the integration of 3D printing technology is enabling the creation of customized implants tailored to the unique anatomical structures of individual animals, leading to enhanced surgical outcomes and faster recovery times. This personalized approach is a key consumer preference, alongside the increasing availability of minimally invasive surgical techniques that reduce patient trauma and post-operative complications.
Consumer preferences are also shifting towards specialized veterinary care, with a growing demand for advanced orthopedic surgeries in dedicated pet hospitals and specialized veterinary clinics. The increasing accessibility of advanced diagnostic tools, such as MRI and CT scans, allows for earlier and more accurate diagnosis of orthopedic conditions, thereby driving the adoption of joint replacement surgeries. Competitive dynamics are characterized by intense R&D efforts among leading players, strategic partnerships to enhance distribution networks and technological capabilities, and a focus on expanding product offerings to cater to a wider range of animal species and orthopedic conditions. Market penetration of advanced orthopedic implants is estimated to be around 40% in developed regions, with significant potential for growth in emerging markets. The competitive landscape is dynamic, with companies continuously striving to differentiate themselves through product innovation, surgical training programs, and strategic market positioning.
Leading Markets & Segments in Veterinary Orthopedic Joint Replacement Implants
The Veterinary Orthopedic Joint Replacement Implants market demonstrates significant regional and segment-specific dominance. North America currently holds the largest market share, driven by a highly developed veterinary healthcare infrastructure, a strong pet-owning culture, and a high disposable income among pet owners, leading to an estimated market share of over 35% for the region. The United States, in particular, stands out as a leading country due to the high prevalence of orthopedic conditions in companion animals and the widespread availability of advanced veterinary surgical facilities.
Within the Application segment, Pet Hospitals and Veterinary Clinics collectively represent the dominant force, accounting for approximately 85% of the total market demand. This dominance is fueled by the continuous influx of companion animals requiring treatment for degenerative joint diseases, traumatic injuries, and congenital orthopedic defects.
- Key Drivers for Pet Hospitals & Veterinary Clinics:
- Increasing pet humanization leading to higher healthcare spending.
- Growing awareness of advanced orthopedic treatment options.
- Availability of board-certified veterinary orthopedic surgeons.
- Technological advancements enabling more precise diagnostics and treatments.
The Types of implants also showcase distinct market preferences. Metals Implants, primarily titanium alloys and cobalt-chromium alloys, currently command the largest market share, estimated at over 60% of the total implant market. This is attributed to their established track record of durability, strength, and biocompatibility, making them suitable for a wide range of joint replacement applications.
- Key Drivers for Metals Implants:
- Proven long-term performance and reliability.
- High strength-to-weight ratio.
- Extensive clinical history and surgeon familiarity.
- Cost-effectiveness compared to some advanced materials.
Ceramics Implants are experiencing rapid growth, with an estimated market share of around 25%. Their rising popularity is due to their excellent biocompatibility, wear resistance, and low friction coefficient, leading to reduced wear debris and improved implant longevity, especially in younger, more active animals.
- Key Drivers for Ceramics Implants:
- Superior biocompatibility and reduced inflammatory response.
- Exceptional wear resistance and low coefficient of friction.
- Aesthetic appeal and potential for longer implant lifespan.
- Growing research and development in advanced ceramic formulations.
Polymers Implants, typically ultra-high molecular weight polyethylene (UHMWPE), hold a significant market share of approximately 15%. These are often used as bearing surfaces in conjunction with metal components, offering flexibility and shock absorption.
- Key Drivers for Polymers Implants:
- Good shock absorption and flexibility.
- Cost-effectiveness as a component material.
- Advancements in polymer formulations for enhanced durability.
The "Others" category for both application and type encompasses niche markets and emerging technologies, representing a smaller but growing segment. The dominance of specific regions and segments is further reinforced by favorable economic policies, robust healthcare infrastructure investment, and the continuous push for innovation in veterinary medicine, driving market penetration and expansion across these key areas.
Veterinary Orthopedic Joint Replacement Implants Product Developments
Product innovations in veterinary orthopedic joint replacement implants are primarily focused on enhancing biocompatibility, durability, and surgical precision. Advancements in biomaterial science have led to the development of novel ceramic composites and bio-inert polymer formulations, offering improved wear resistance and reduced inflammatory responses. The integration of nanotechnology is paving the way for implants with enhanced surface properties for better bone integration. Furthermore, the increasing application of 3D printing allows for the creation of patient-specific implants, optimizing fit and reducing surgery time. These developments offer competitive advantages by improving patient outcomes, minimizing revision surgeries, and expanding the range of treatable orthopedic conditions in animals.
Key Drivers of Veterinary Orthopedic Joint Replacement Implants Growth
Several key factors are propelling the growth of the veterinary orthopedic joint replacement implants market. The escalating trend of pet humanization, coupled with increased disposable income among pet owners, fuels a greater willingness to invest in advanced veterinary care. Technological advancements in biomaterials, surgical instrumentation, and imaging techniques are enabling more sophisticated and successful joint replacement procedures. Furthermore, a growing awareness of the benefits of joint replacement, including improved mobility and quality of life for animals with orthopedic conditions, is driving demand. Favorable regulatory environments that ensure product safety and efficacy also contribute to market expansion.
Challenges in the Veterinary Orthopedic Joint Replacement Implants Market
Despite robust growth, the veterinary orthopedic joint replacement implants market faces several challenges. High costs associated with these advanced implants and surgical procedures can be a significant barrier for some pet owners, limiting market penetration in certain demographics and regions. The availability of highly specialized veterinary surgeons and advanced surgical facilities, though growing, remains concentrated in developed areas, creating access issues for some. Furthermore, the long-term efficacy and durability of newer implant technologies require ongoing research and clinical validation. Competitive pressures and the need for continuous innovation also place a strain on research and development budgets, impacting the affordability of emerging technologies.
Emerging Opportunities in Veterinary Orthopedic Joint Replacement Implants
The veterinary orthopedic joint replacement implants market is ripe with emerging opportunities driven by technological breakthroughs and evolving market dynamics. The development of bioresorbable implants that gradually degrade within the body, eliminating the need for removal, presents a significant avenue for innovation. Advancements in robotic-assisted surgery for veterinary applications promise enhanced precision and minimally invasive procedures, opening new market segments. Strategic partnerships between implant manufacturers, veterinary institutions, and research centers can accelerate the development and adoption of novel solutions. Expansion into emerging markets, with their growing pet populations and increasing veterinary healthcare expenditure, offers substantial growth potential.
Leading Players in the Veterinary Orthopedic Joint Replacement Implants Sector
- Johnson & Johnson
- Zimmer Biomet
- Stryker
- Aesculap
- Corin
- Smith & Nephew
- Kyocera
- Nevz-keramiks
- Mathys Medical
- MicroPort Scientific
- Exactech
- Autocam Medical
- OMNIlife Science
- B. Braun Melsungen
- DJO Global
- Arthrex
- ConforMIS
- Corenetec
- Elite Surgical
- Evolutis
- Limacorporate
- Medacta
- Ortosintese
- Peter Brehm
Key Milestones in Veterinary Orthopedic Joint Replacement Implants Industry
- 2019: Introduction of novel ceramic-polyethylene composite bearing surfaces for enhanced wear resistance.
- 2020: Launch of specialized canine hip replacement systems designed for smaller breeds.
- 2021: Significant advancements in 3D printing enabling patient-specific implant design and manufacturing.
- 2022: Approval of new biocompatible coatings for improved osseointegration.
- 2023: Increased adoption of robotic-assisted surgery in select veterinary orthopedic centers.
- 2024: Emergence of bioresorbable implant research showing promise for future applications.
Strategic Outlook for Veterinary Orthopedic Joint Replacement Implants Market
The strategic outlook for the Veterinary Orthopedic Joint Replacement Implants market is highly promising, driven by sustained demand and continuous innovation. Growth accelerators will include the further development and adoption of personalized implant solutions through advanced imaging and 3D printing. The expansion of minimally invasive surgical techniques will broaden the applicability and reduce recovery times, making these procedures more accessible. Strategic collaborations with veterinary schools and research institutions will foster the development of next-generation materials and implant designs. Furthermore, exploring untapped potential in emerging economies and developing cost-effective solutions will be crucial for maximizing market penetration and ensuring long-term growth.
Veterinary Orthopedic Joint Replacement Implants Segmentation
-
1. Application
- 1.1. Pet Hospital
- 1.2. Veterinary Clinic
- 1.3. Zoo
- 1.4. Others
-
2. Types
- 2.1. Ceramics Implants
- 2.2. Metals Implants
- 2.3. Polymers Implants
- 2.4. Others
Veterinary Orthopedic Joint Replacement Implants Segmentation By Geography
-
1. North America
- 1.1. United States
- 1.2. Canada
- 1.3. Mexico
-
2. South America
- 2.1. Brazil
- 2.2. Argentina
- 2.3. Rest of South America
-
3. Europe
- 3.1. United Kingdom
- 3.2. Germany
- 3.3. France
- 3.4. Italy
- 3.5. Spain
- 3.6. Russia
- 3.7. Benelux
- 3.8. Nordics
- 3.9. Rest of Europe
-
4. Middle East & Africa
- 4.1. Turkey
- 4.2. Israel
- 4.3. GCC
- 4.4. North Africa
- 4.5. South Africa
- 4.6. Rest of Middle East & Africa
-
5. Asia Pacific
- 5.1. China
- 5.2. India
- 5.3. Japan
- 5.4. South Korea
- 5.5. ASEAN
- 5.6. Oceania
- 5.7. Rest of Asia Pacific
Veterinary Orthopedic Joint Replacement Implants Regional Market Share
Geographic Coverage of Veterinary Orthopedic Joint Replacement Implants
Veterinary Orthopedic Joint Replacement Implants REPORT HIGHLIGHTS
| Aspects | Details |
|---|---|
| Study Period | 2020-2034 |
| Base Year | 2025 |
| Estimated Year | 2026 |
| Forecast Period | 2026-2034 |
| Historical Period | 2020-2025 |
| Growth Rate | CAGR of 11.05% from 2020-2034 |
| Segmentation |
|
Table of Contents
- 1. Introduction
- 1.1. Research Scope
- 1.2. Market Segmentation
- 1.3. Research Objective
- 1.4. Definitions and Assumptions
- 2. Executive Summary
- 2.1. Market Snapshot
- 3. Market Dynamics
- 3.1. Market Drivers
- 3.2. Market Restrains
- 3.3. Market Trends
- 3.4. Market Opportunities
- 4. Market Factor Analysis
- 4.1. Porters Five Forces
- 4.1.1. Bargaining Power of Suppliers
- 4.1.2. Bargaining Power of Buyers
- 4.1.3. Threat of New Entrants
- 4.1.4. Threat of Substitutes
- 4.1.5. Competitive Rivalry
- 4.2. PESTEL analysis
- 4.3. BCG Analysis
- 4.3.1. Stars (High Growth, High Market Share)
- 4.3.2. Cash Cows (Low Growth, High Market Share)
- 4.3.3. Question Mark (High Growth, Low Market Share)
- 4.3.4. Dogs (Low Growth, Low Market Share)
- 4.4. Ansoff Matrix Analysis
- 4.5. Supply Chain Analysis
- 4.6. Regulatory Landscape
- 4.7. Current Market Potential and Opportunity Assessment (TAM–SAM–SOM Framework)
- 4.8. MDP Analyst Note
- 4.1. Porters Five Forces
- 5. Market Analysis, Insights and Forecast 2021-2033
- 5.1. Market Analysis, Insights and Forecast - by Application
- 5.1.1. Pet Hospital
- 5.1.2. Veterinary Clinic
- 5.1.3. Zoo
- 5.1.4. Others
- 5.2. Market Analysis, Insights and Forecast - by Types
- 5.2.1. Ceramics Implants
- 5.2.2. Metals Implants
- 5.2.3. Polymers Implants
- 5.2.4. Others
- 5.3. Market Analysis, Insights and Forecast - by Region
- 5.3.1. North America
- 5.3.2. South America
- 5.3.3. Europe
- 5.3.4. Middle East & Africa
- 5.3.5. Asia Pacific
- 5.1. Market Analysis, Insights and Forecast - by Application
- 6. Global Veterinary Orthopedic Joint Replacement Implants Analysis, Insights and Forecast, 2021-2033
- 6.1. Market Analysis, Insights and Forecast - by Application
- 6.1.1. Pet Hospital
- 6.1.2. Veterinary Clinic
- 6.1.3. Zoo
- 6.1.4. Others
- 6.2. Market Analysis, Insights and Forecast - by Types
- 6.2.1. Ceramics Implants
- 6.2.2. Metals Implants
- 6.2.3. Polymers Implants
- 6.2.4. Others
- 6.1. Market Analysis, Insights and Forecast - by Application
- 7. North America Veterinary Orthopedic Joint Replacement Implants Analysis, Insights and Forecast, 2020-2032
- 7.1. Market Analysis, Insights and Forecast - by Application
- 7.1.1. Pet Hospital
- 7.1.2. Veterinary Clinic
- 7.1.3. Zoo
- 7.1.4. Others
- 7.2. Market Analysis, Insights and Forecast - by Types
- 7.2.1. Ceramics Implants
- 7.2.2. Metals Implants
- 7.2.3. Polymers Implants
- 7.2.4. Others
- 7.1. Market Analysis, Insights and Forecast - by Application
- 8. South America Veterinary Orthopedic Joint Replacement Implants Analysis, Insights and Forecast, 2020-2032
- 8.1. Market Analysis, Insights and Forecast - by Application
- 8.1.1. Pet Hospital
- 8.1.2. Veterinary Clinic
- 8.1.3. Zoo
- 8.1.4. Others
- 8.2. Market Analysis, Insights and Forecast - by Types
- 8.2.1. Ceramics Implants
- 8.2.2. Metals Implants
- 8.2.3. Polymers Implants
- 8.2.4. Others
- 8.1. Market Analysis, Insights and Forecast - by Application
- 9. Europe Veterinary Orthopedic Joint Replacement Implants Analysis, Insights and Forecast, 2020-2032
- 9.1. Market Analysis, Insights and Forecast - by Application
- 9.1.1. Pet Hospital
- 9.1.2. Veterinary Clinic
- 9.1.3. Zoo
- 9.1.4. Others
- 9.2. Market Analysis, Insights and Forecast - by Types
- 9.2.1. Ceramics Implants
- 9.2.2. Metals Implants
- 9.2.3. Polymers Implants
- 9.2.4. Others
- 9.1. Market Analysis, Insights and Forecast - by Application
- 10. Middle East & Africa Veterinary Orthopedic Joint Replacement Implants Analysis, Insights and Forecast, 2020-2032
- 10.1. Market Analysis, Insights and Forecast - by Application
- 10.1.1. Pet Hospital
- 10.1.2. Veterinary Clinic
- 10.1.3. Zoo
- 10.1.4. Others
- 10.2. Market Analysis, Insights and Forecast - by Types
- 10.2.1. Ceramics Implants
- 10.2.2. Metals Implants
- 10.2.3. Polymers Implants
- 10.2.4. Others
- 10.1. Market Analysis, Insights and Forecast - by Application
- 11. Asia Pacific Veterinary Orthopedic Joint Replacement Implants Analysis, Insights and Forecast, 2020-2032
- 11.1. Market Analysis, Insights and Forecast - by Application
- 11.1.1. Pet Hospital
- 11.1.2. Veterinary Clinic
- 11.1.3. Zoo
- 11.1.4. Others
- 11.2. Market Analysis, Insights and Forecast - by Types
- 11.2.1. Ceramics Implants
- 11.2.2. Metals Implants
- 11.2.3. Polymers Implants
- 11.2.4. Others
- 11.1. Market Analysis, Insights and Forecast - by Application
- 12. Competitive Analysis
- 12.1. Company Profiles
- 12.1.1 Johnson & Johnson
- 12.1.1.1. Company Overview
- 12.1.1.2. Products
- 12.1.1.3. Company Financials
- 12.1.1.4. SWOT Analysis
- 12.1.2 Zimmer Biomet
- 12.1.2.1. Company Overview
- 12.1.2.2. Products
- 12.1.2.3. Company Financials
- 12.1.2.4. SWOT Analysis
- 12.1.3 Stryker
- 12.1.3.1. Company Overview
- 12.1.3.2. Products
- 12.1.3.3. Company Financials
- 12.1.3.4. SWOT Analysis
- 12.1.4 Aesculap
- 12.1.4.1. Company Overview
- 12.1.4.2. Products
- 12.1.4.3. Company Financials
- 12.1.4.4. SWOT Analysis
- 12.1.5 Corin
- 12.1.5.1. Company Overview
- 12.1.5.2. Products
- 12.1.5.3. Company Financials
- 12.1.5.4. SWOT Analysis
- 12.1.6 Smith & Nephew
- 12.1.6.1. Company Overview
- 12.1.6.2. Products
- 12.1.6.3. Company Financials
- 12.1.6.4. SWOT Analysis
- 12.1.7 Kyocera
- 12.1.7.1. Company Overview
- 12.1.7.2. Products
- 12.1.7.3. Company Financials
- 12.1.7.4. SWOT Analysis
- 12.1.8 Nevz-keramiks
- 12.1.8.1. Company Overview
- 12.1.8.2. Products
- 12.1.8.3. Company Financials
- 12.1.8.4. SWOT Analysis
- 12.1.9 Mathys Medical
- 12.1.9.1. Company Overview
- 12.1.9.2. Products
- 12.1.9.3. Company Financials
- 12.1.9.4. SWOT Analysis
- 12.1.10 MicroPort Scientific
- 12.1.10.1. Company Overview
- 12.1.10.2. Products
- 12.1.10.3. Company Financials
- 12.1.10.4. SWOT Analysis
- 12.1.11 Exactech
- 12.1.11.1. Company Overview
- 12.1.11.2. Products
- 12.1.11.3. Company Financials
- 12.1.11.4. SWOT Analysis
- 12.1.12 Autocam Medical
- 12.1.12.1. Company Overview
- 12.1.12.2. Products
- 12.1.12.3. Company Financials
- 12.1.12.4. SWOT Analysis
- 12.1.13 OMNIlife Science
- 12.1.13.1. Company Overview
- 12.1.13.2. Products
- 12.1.13.3. Company Financials
- 12.1.13.4. SWOT Analysis
- 12.1.14 B. Braun Melsungen
- 12.1.14.1. Company Overview
- 12.1.14.2. Products
- 12.1.14.3. Company Financials
- 12.1.14.4. SWOT Analysis
- 12.1.15 DJO Global
- 12.1.15.1. Company Overview
- 12.1.15.2. Products
- 12.1.15.3. Company Financials
- 12.1.15.4. SWOT Analysis
- 12.1.16 Arthrex
- 12.1.16.1. Company Overview
- 12.1.16.2. Products
- 12.1.16.3. Company Financials
- 12.1.16.4. SWOT Analysis
- 12.1.17 ConforMIS
- 12.1.17.1. Company Overview
- 12.1.17.2. Products
- 12.1.17.3. Company Financials
- 12.1.17.4. SWOT Analysis
- 12.1.18 Corenetec
- 12.1.18.1. Company Overview
- 12.1.18.2. Products
- 12.1.18.3. Company Financials
- 12.1.18.4. SWOT Analysis
- 12.1.19 Elite Surgical
- 12.1.19.1. Company Overview
- 12.1.19.2. Products
- 12.1.19.3. Company Financials
- 12.1.19.4. SWOT Analysis
- 12.1.20 Evolutis
- 12.1.20.1. Company Overview
- 12.1.20.2. Products
- 12.1.20.3. Company Financials
- 12.1.20.4. SWOT Analysis
- 12.1.21 Limacorporate
- 12.1.21.1. Company Overview
- 12.1.21.2. Products
- 12.1.21.3. Company Financials
- 12.1.21.4. SWOT Analysis
- 12.1.22 Medacta
- 12.1.22.1. Company Overview
- 12.1.22.2. Products
- 12.1.22.3. Company Financials
- 12.1.22.4. SWOT Analysis
- 12.1.23 Ortosintese
- 12.1.23.1. Company Overview
- 12.1.23.2. Products
- 12.1.23.3. Company Financials
- 12.1.23.4. SWOT Analysis
- 12.1.24 Peter Brehm
- 12.1.24.1. Company Overview
- 12.1.24.2. Products
- 12.1.24.3. Company Financials
- 12.1.24.4. SWOT Analysis
- 12.1.1 Johnson & Johnson
- 12.2. Market Entropy
- 12.2.1 Company's Key Areas Served
- 12.2.2 Recent Developments
- 12.3. Company Market Share Analysis 2025
- 12.3.1 Top 5 Companies Market Share Analysis
- 12.3.2 Top 3 Companies Market Share Analysis
- 12.4. List of Potential Customers
- 13. Research Methodology
List of Figures
- Figure 1: Global Veterinary Orthopedic Joint Replacement Implants Revenue Breakdown (undefined, %) by Region 2025 & 2033
- Figure 2: Global Veterinary Orthopedic Joint Replacement Implants Volume Breakdown (K, %) by Region 2025 & 2033
- Figure 3: North America Veterinary Orthopedic Joint Replacement Implants Revenue (undefined), by Application 2025 & 2033
- Figure 4: North America Veterinary Orthopedic Joint Replacement Implants Volume (K), by Application 2025 & 2033
- Figure 5: North America Veterinary Orthopedic Joint Replacement Implants Revenue Share (%), by Application 2025 & 2033
- Figure 6: North America Veterinary Orthopedic Joint Replacement Implants Volume Share (%), by Application 2025 & 2033
- Figure 7: North America Veterinary Orthopedic Joint Replacement Implants Revenue (undefined), by Types 2025 & 2033
- Figure 8: North America Veterinary Orthopedic Joint Replacement Implants Volume (K), by Types 2025 & 2033
- Figure 9: North America Veterinary Orthopedic Joint Replacement Implants Revenue Share (%), by Types 2025 & 2033
- Figure 10: North America Veterinary Orthopedic Joint Replacement Implants Volume Share (%), by Types 2025 & 2033
- Figure 11: North America Veterinary Orthopedic Joint Replacement Implants Revenue (undefined), by Country 2025 & 2033
- Figure 12: North America Veterinary Orthopedic Joint Replacement Implants Volume (K), by Country 2025 & 2033
- Figure 13: North America Veterinary Orthopedic Joint Replacement Implants Revenue Share (%), by Country 2025 & 2033
- Figure 14: North America Veterinary Orthopedic Joint Replacement Implants Volume Share (%), by Country 2025 & 2033
- Figure 15: South America Veterinary Orthopedic Joint Replacement Implants Revenue (undefined), by Application 2025 & 2033
- Figure 16: South America Veterinary Orthopedic Joint Replacement Implants Volume (K), by Application 2025 & 2033
- Figure 17: South America Veterinary Orthopedic Joint Replacement Implants Revenue Share (%), by Application 2025 & 2033
- Figure 18: South America Veterinary Orthopedic Joint Replacement Implants Volume Share (%), by Application 2025 & 2033
- Figure 19: South America Veterinary Orthopedic Joint Replacement Implants Revenue (undefined), by Types 2025 & 2033
- Figure 20: South America Veterinary Orthopedic Joint Replacement Implants Volume (K), by Types 2025 & 2033
- Figure 21: South America Veterinary Orthopedic Joint Replacement Implants Revenue Share (%), by Types 2025 & 2033
- Figure 22: South America Veterinary Orthopedic Joint Replacement Implants Volume Share (%), by Types 2025 & 2033
- Figure 23: South America Veterinary Orthopedic Joint Replacement Implants Revenue (undefined), by Country 2025 & 2033
- Figure 24: South America Veterinary Orthopedic Joint Replacement Implants Volume (K), by Country 2025 & 2033
- Figure 25: South America Veterinary Orthopedic Joint Replacement Implants Revenue Share (%), by Country 2025 & 2033
- Figure 26: South America Veterinary Orthopedic Joint Replacement Implants Volume Share (%), by Country 2025 & 2033
- Figure 27: Europe Veterinary Orthopedic Joint Replacement Implants Revenue (undefined), by Application 2025 & 2033
- Figure 28: Europe Veterinary Orthopedic Joint Replacement Implants Volume (K), by Application 2025 & 2033
- Figure 29: Europe Veterinary Orthopedic Joint Replacement Implants Revenue Share (%), by Application 2025 & 2033
- Figure 30: Europe Veterinary Orthopedic Joint Replacement Implants Volume Share (%), by Application 2025 & 2033
- Figure 31: Europe Veterinary Orthopedic Joint Replacement Implants Revenue (undefined), by Types 2025 & 2033
- Figure 32: Europe Veterinary Orthopedic Joint Replacement Implants Volume (K), by Types 2025 & 2033
- Figure 33: Europe Veterinary Orthopedic Joint Replacement Implants Revenue Share (%), by Types 2025 & 2033
- Figure 34: Europe Veterinary Orthopedic Joint Replacement Implants Volume Share (%), by Types 2025 & 2033
- Figure 35: Europe Veterinary Orthopedic Joint Replacement Implants Revenue (undefined), by Country 2025 & 2033
- Figure 36: Europe Veterinary Orthopedic Joint Replacement Implants Volume (K), by Country 2025 & 2033
- Figure 37: Europe Veterinary Orthopedic Joint Replacement Implants Revenue Share (%), by Country 2025 & 2033
- Figure 38: Europe Veterinary Orthopedic Joint Replacement Implants Volume Share (%), by Country 2025 & 2033
- Figure 39: Middle East & Africa Veterinary Orthopedic Joint Replacement Implants Revenue (undefined), by Application 2025 & 2033
- Figure 40: Middle East & Africa Veterinary Orthopedic Joint Replacement Implants Volume (K), by Application 2025 & 2033
- Figure 41: Middle East & Africa Veterinary Orthopedic Joint Replacement Implants Revenue Share (%), by Application 2025 & 2033
- Figure 42: Middle East & Africa Veterinary Orthopedic Joint Replacement Implants Volume Share (%), by Application 2025 & 2033
- Figure 43: Middle East & Africa Veterinary Orthopedic Joint Replacement Implants Revenue (undefined), by Types 2025 & 2033
- Figure 44: Middle East & Africa Veterinary Orthopedic Joint Replacement Implants Volume (K), by Types 2025 & 2033
- Figure 45: Middle East & Africa Veterinary Orthopedic Joint Replacement Implants Revenue Share (%), by Types 2025 & 2033
- Figure 46: Middle East & Africa Veterinary Orthopedic Joint Replacement Implants Volume Share (%), by Types 2025 & 2033
- Figure 47: Middle East & Africa Veterinary Orthopedic Joint Replacement Implants Revenue (undefined), by Country 2025 & 2033
- Figure 48: Middle East & Africa Veterinary Orthopedic Joint Replacement Implants Volume (K), by Country 2025 & 2033
- Figure 49: Middle East & Africa Veterinary Orthopedic Joint Replacement Implants Revenue Share (%), by Country 2025 & 2033
- Figure 50: Middle East & Africa Veterinary Orthopedic Joint Replacement Implants Volume Share (%), by Country 2025 & 2033
- Figure 51: Asia Pacific Veterinary Orthopedic Joint Replacement Implants Revenue (undefined), by Application 2025 & 2033
- Figure 52: Asia Pacific Veterinary Orthopedic Joint Replacement Implants Volume (K), by Application 2025 & 2033
- Figure 53: Asia Pacific Veterinary Orthopedic Joint Replacement Implants Revenue Share (%), by Application 2025 & 2033
- Figure 54: Asia Pacific Veterinary Orthopedic Joint Replacement Implants Volume Share (%), by Application 2025 & 2033
- Figure 55: Asia Pacific Veterinary Orthopedic Joint Replacement Implants Revenue (undefined), by Types 2025 & 2033
- Figure 56: Asia Pacific Veterinary Orthopedic Joint Replacement Implants Volume (K), by Types 2025 & 2033
- Figure 57: Asia Pacific Veterinary Orthopedic Joint Replacement Implants Revenue Share (%), by Types 2025 & 2033
- Figure 58: Asia Pacific Veterinary Orthopedic Joint Replacement Implants Volume Share (%), by Types 2025 & 2033
- Figure 59: Asia Pacific Veterinary Orthopedic Joint Replacement Implants Revenue (undefined), by Country 2025 & 2033
- Figure 60: Asia Pacific Veterinary Orthopedic Joint Replacement Implants Volume (K), by Country 2025 & 2033
- Figure 61: Asia Pacific Veterinary Orthopedic Joint Replacement Implants Revenue Share (%), by Country 2025 & 2033
- Figure 62: Asia Pacific Veterinary Orthopedic Joint Replacement Implants Volume Share (%), by Country 2025 & 2033
List of Tables
- Table 1: Global Veterinary Orthopedic Joint Replacement Implants Revenue undefined Forecast, by Application 2020 & 2033
- Table 2: Global Veterinary Orthopedic Joint Replacement Implants Volume K Forecast, by Application 2020 & 2033
- Table 3: Global Veterinary Orthopedic Joint Replacement Implants Revenue undefined Forecast, by Types 2020 & 2033
- Table 4: Global Veterinary Orthopedic Joint Replacement Implants Volume K Forecast, by Types 2020 & 2033
- Table 5: Global Veterinary Orthopedic Joint Replacement Implants Revenue undefined Forecast, by Region 2020 & 2033
- Table 6: Global Veterinary Orthopedic Joint Replacement Implants Volume K Forecast, by Region 2020 & 2033
- Table 7: Global Veterinary Orthopedic Joint Replacement Implants Revenue undefined Forecast, by Application 2020 & 2033
- Table 8: Global Veterinary Orthopedic Joint Replacement Implants Volume K Forecast, by Application 2020 & 2033
- Table 9: Global Veterinary Orthopedic Joint Replacement Implants Revenue undefined Forecast, by Types 2020 & 2033
- Table 10: Global Veterinary Orthopedic Joint Replacement Implants Volume K Forecast, by Types 2020 & 2033
- Table 11: Global Veterinary Orthopedic Joint Replacement Implants Revenue undefined Forecast, by Country 2020 & 2033
- Table 12: Global Veterinary Orthopedic Joint Replacement Implants Volume K Forecast, by Country 2020 & 2033
- Table 13: United States Veterinary Orthopedic Joint Replacement Implants Revenue (undefined) Forecast, by Application 2020 & 2033
- Table 14: United States Veterinary Orthopedic Joint Replacement Implants Volume (K) Forecast, by Application 2020 & 2033
- Table 15: Canada Veterinary Orthopedic Joint Replacement Implants Revenue (undefined) Forecast, by Application 2020 & 2033
- Table 16: Canada Veterinary Orthopedic Joint Replacement Implants Volume (K) Forecast, by Application 2020 & 2033
- Table 17: Mexico Veterinary Orthopedic Joint Replacement Implants Revenue (undefined) Forecast, by Application 2020 & 2033
- Table 18: Mexico Veterinary Orthopedic Joint Replacement Implants Volume (K) Forecast, by Application 2020 & 2033
- Table 19: Global Veterinary Orthopedic Joint Replacement Implants Revenue undefined Forecast, by Application 2020 & 2033
- Table 20: Global Veterinary Orthopedic Joint Replacement Implants Volume K Forecast, by Application 2020 & 2033
- Table 21: Global Veterinary Orthopedic Joint Replacement Implants Revenue undefined Forecast, by Types 2020 & 2033
- Table 22: Global Veterinary Orthopedic Joint Replacement Implants Volume K Forecast, by Types 2020 & 2033
- Table 23: Global Veterinary Orthopedic Joint Replacement Implants Revenue undefined Forecast, by Country 2020 & 2033
- Table 24: Global Veterinary Orthopedic Joint Replacement Implants Volume K Forecast, by Country 2020 & 2033
- Table 25: Brazil Veterinary Orthopedic Joint Replacement Implants Revenue (undefined) Forecast, by Application 2020 & 2033
- Table 26: Brazil Veterinary Orthopedic Joint Replacement Implants Volume (K) Forecast, by Application 2020 & 2033
- Table 27: Argentina Veterinary Orthopedic Joint Replacement Implants Revenue (undefined) Forecast, by Application 2020 & 2033
- Table 28: Argentina Veterinary Orthopedic Joint Replacement Implants Volume (K) Forecast, by Application 2020 & 2033
- Table 29: Rest of South America Veterinary Orthopedic Joint Replacement Implants Revenue (undefined) Forecast, by Application 2020 & 2033
- Table 30: Rest of South America Veterinary Orthopedic Joint Replacement Implants Volume (K) Forecast, by Application 2020 & 2033
- Table 31: Global Veterinary Orthopedic Joint Replacement Implants Revenue undefined Forecast, by Application 2020 & 2033
- Table 32: Global Veterinary Orthopedic Joint Replacement Implants Volume K Forecast, by Application 2020 & 2033
- Table 33: Global Veterinary Orthopedic Joint Replacement Implants Revenue undefined Forecast, by Types 2020 & 2033
- Table 34: Global Veterinary Orthopedic Joint Replacement Implants Volume K Forecast, by Types 2020 & 2033
- Table 35: Global Veterinary Orthopedic Joint Replacement Implants Revenue undefined Forecast, by Country 2020 & 2033
- Table 36: Global Veterinary Orthopedic Joint Replacement Implants Volume K Forecast, by Country 2020 & 2033
- Table 37: United Kingdom Veterinary Orthopedic Joint Replacement Implants Revenue (undefined) Forecast, by Application 2020 & 2033
- Table 38: United Kingdom Veterinary Orthopedic Joint Replacement Implants Volume (K) Forecast, by Application 2020 & 2033
- Table 39: Germany Veterinary Orthopedic Joint Replacement Implants Revenue (undefined) Forecast, by Application 2020 & 2033
- Table 40: Germany Veterinary Orthopedic Joint Replacement Implants Volume (K) Forecast, by Application 2020 & 2033
- Table 41: France Veterinary Orthopedic Joint Replacement Implants Revenue (undefined) Forecast, by Application 2020 & 2033
- Table 42: France Veterinary Orthopedic Joint Replacement Implants Volume (K) Forecast, by Application 2020 & 2033
- Table 43: Italy Veterinary Orthopedic Joint Replacement Implants Revenue (undefined) Forecast, by Application 2020 & 2033
- Table 44: Italy Veterinary Orthopedic Joint Replacement Implants Volume (K) Forecast, by Application 2020 & 2033
- Table 45: Spain Veterinary Orthopedic Joint Replacement Implants Revenue (undefined) Forecast, by Application 2020 & 2033
- Table 46: Spain Veterinary Orthopedic Joint Replacement Implants Volume (K) Forecast, by Application 2020 & 2033
- Table 47: Russia Veterinary Orthopedic Joint Replacement Implants Revenue (undefined) Forecast, by Application 2020 & 2033
- Table 48: Russia Veterinary Orthopedic Joint Replacement Implants Volume (K) Forecast, by Application 2020 & 2033
- Table 49: Benelux Veterinary Orthopedic Joint Replacement Implants Revenue (undefined) Forecast, by Application 2020 & 2033
- Table 50: Benelux Veterinary Orthopedic Joint Replacement Implants Volume (K) Forecast, by Application 2020 & 2033
- Table 51: Nordics Veterinary Orthopedic Joint Replacement Implants Revenue (undefined) Forecast, by Application 2020 & 2033
- Table 52: Nordics Veterinary Orthopedic Joint Replacement Implants Volume (K) Forecast, by Application 2020 & 2033
- Table 53: Rest of Europe Veterinary Orthopedic Joint Replacement Implants Revenue (undefined) Forecast, by Application 2020 & 2033
- Table 54: Rest of Europe Veterinary Orthopedic Joint Replacement Implants Volume (K) Forecast, by Application 2020 & 2033
- Table 55: Global Veterinary Orthopedic Joint Replacement Implants Revenue undefined Forecast, by Application 2020 & 2033
- Table 56: Global Veterinary Orthopedic Joint Replacement Implants Volume K Forecast, by Application 2020 & 2033
- Table 57: Global Veterinary Orthopedic Joint Replacement Implants Revenue undefined Forecast, by Types 2020 & 2033
- Table 58: Global Veterinary Orthopedic Joint Replacement Implants Volume K Forecast, by Types 2020 & 2033
- Table 59: Global Veterinary Orthopedic Joint Replacement Implants Revenue undefined Forecast, by Country 2020 & 2033
- Table 60: Global Veterinary Orthopedic Joint Replacement Implants Volume K Forecast, by Country 2020 & 2033
- Table 61: Turkey Veterinary Orthopedic Joint Replacement Implants Revenue (undefined) Forecast, by Application 2020 & 2033
- Table 62: Turkey Veterinary Orthopedic Joint Replacement Implants Volume (K) Forecast, by Application 2020 & 2033
- Table 63: Israel Veterinary Orthopedic Joint Replacement Implants Revenue (undefined) Forecast, by Application 2020 & 2033
- Table 64: Israel Veterinary Orthopedic Joint Replacement Implants Volume (K) Forecast, by Application 2020 & 2033
- Table 65: GCC Veterinary Orthopedic Joint Replacement Implants Revenue (undefined) Forecast, by Application 2020 & 2033
- Table 66: GCC Veterinary Orthopedic Joint Replacement Implants Volume (K) Forecast, by Application 2020 & 2033
- Table 67: North Africa Veterinary Orthopedic Joint Replacement Implants Revenue (undefined) Forecast, by Application 2020 & 2033
- Table 68: North Africa Veterinary Orthopedic Joint Replacement Implants Volume (K) Forecast, by Application 2020 & 2033
- Table 69: South Africa Veterinary Orthopedic Joint Replacement Implants Revenue (undefined) Forecast, by Application 2020 & 2033
- Table 70: South Africa Veterinary Orthopedic Joint Replacement Implants Volume (K) Forecast, by Application 2020 & 2033
- Table 71: Rest of Middle East & Africa Veterinary Orthopedic Joint Replacement Implants Revenue (undefined) Forecast, by Application 2020 & 2033
- Table 72: Rest of Middle East & Africa Veterinary Orthopedic Joint Replacement Implants Volume (K) Forecast, by Application 2020 & 2033
- Table 73: Global Veterinary Orthopedic Joint Replacement Implants Revenue undefined Forecast, by Application 2020 & 2033
- Table 74: Global Veterinary Orthopedic Joint Replacement Implants Volume K Forecast, by Application 2020 & 2033
- Table 75: Global Veterinary Orthopedic Joint Replacement Implants Revenue undefined Forecast, by Types 2020 & 2033
- Table 76: Global Veterinary Orthopedic Joint Replacement Implants Volume K Forecast, by Types 2020 & 2033
- Table 77: Global Veterinary Orthopedic Joint Replacement Implants Revenue undefined Forecast, by Country 2020 & 2033
- Table 78: Global Veterinary Orthopedic Joint Replacement Implants Volume K Forecast, by Country 2020 & 2033
- Table 79: China Veterinary Orthopedic Joint Replacement Implants Revenue (undefined) Forecast, by Application 2020 & 2033
- Table 80: China Veterinary Orthopedic Joint Replacement Implants Volume (K) Forecast, by Application 2020 & 2033
- Table 81: India Veterinary Orthopedic Joint Replacement Implants Revenue (undefined) Forecast, by Application 2020 & 2033
- Table 82: India Veterinary Orthopedic Joint Replacement Implants Volume (K) Forecast, by Application 2020 & 2033
- Table 83: Japan Veterinary Orthopedic Joint Replacement Implants Revenue (undefined) Forecast, by Application 2020 & 2033
- Table 84: Japan Veterinary Orthopedic Joint Replacement Implants Volume (K) Forecast, by Application 2020 & 2033
- Table 85: South Korea Veterinary Orthopedic Joint Replacement Implants Revenue (undefined) Forecast, by Application 2020 & 2033
- Table 86: South Korea Veterinary Orthopedic Joint Replacement Implants Volume (K) Forecast, by Application 2020 & 2033
- Table 87: ASEAN Veterinary Orthopedic Joint Replacement Implants Revenue (undefined) Forecast, by Application 2020 & 2033
- Table 88: ASEAN Veterinary Orthopedic Joint Replacement Implants Volume (K) Forecast, by Application 2020 & 2033
- Table 89: Oceania Veterinary Orthopedic Joint Replacement Implants Revenue (undefined) Forecast, by Application 2020 & 2033
- Table 90: Oceania Veterinary Orthopedic Joint Replacement Implants Volume (K) Forecast, by Application 2020 & 2033
- Table 91: Rest of Asia Pacific Veterinary Orthopedic Joint Replacement Implants Revenue (undefined) Forecast, by Application 2020 & 2033
- Table 92: Rest of Asia Pacific Veterinary Orthopedic Joint Replacement Implants Volume (K) Forecast, by Application 2020 & 2033
Frequently Asked Questions
1. What is the projected Compound Annual Growth Rate (CAGR) of the Veterinary Orthopedic Joint Replacement Implants?
The projected CAGR is approximately 11.05%.
2. Which companies are prominent players in the Veterinary Orthopedic Joint Replacement Implants?
Key companies in the market include Johnson & Johnson, Zimmer Biomet, Stryker, Aesculap, Corin, Smith & Nephew, Kyocera, Nevz-keramiks, Mathys Medical, MicroPort Scientific, Exactech, Autocam Medical, OMNIlife Science, B. Braun Melsungen, DJO Global, Arthrex, ConforMIS, Corenetec, Elite Surgical, Evolutis, Limacorporate, Medacta, Ortosintese, Peter Brehm.
3. What are the main segments of the Veterinary Orthopedic Joint Replacement Implants?
The market segments include Application, Types.
4. Can you provide details about the market size?
The market size is estimated to be USD XXX N/A as of 2022.
5. What are some drivers contributing to market growth?
N/A
6. What are the notable trends driving market growth?
N/A
7. Are there any restraints impacting market growth?
N/A
8. Can you provide examples of recent developments in the market?
N/A
9. What pricing options are available for accessing the report?
Pricing options include single-user, multi-user, and enterprise licenses priced at USD 3950.00, USD 5925.00, and USD 7900.00 respectively.
10. Is the market size provided in terms of value or volume?
The market size is provided in terms of value, measured in N/A and volume, measured in K.
11. Are there any specific market keywords associated with the report?
Yes, the market keyword associated with the report is "Veterinary Orthopedic Joint Replacement Implants," which aids in identifying and referencing the specific market segment covered.
12. How do I determine which pricing option suits my needs best?
The pricing options vary based on user requirements and access needs. Individual users may opt for single-user licenses, while businesses requiring broader access may choose multi-user or enterprise licenses for cost-effective access to the report.
13. Are there any additional resources or data provided in the Veterinary Orthopedic Joint Replacement Implants report?
While the report offers comprehensive insights, it's advisable to review the specific contents or supplementary materials provided to ascertain if additional resources or data are available.
14. How can I stay updated on further developments or reports in the Veterinary Orthopedic Joint Replacement Implants?
To stay informed about further developments, trends, and reports in the Veterinary Orthopedic Joint Replacement Implants, consider subscribing to industry newsletters, following relevant companies and organizations, or regularly checking reputable industry news sources and publications.
Methodology
Step 1 - Identification of Relevant Samples Size from Population Database


Step 2 - Approaches for Defining Global Market Size (Value, Volume* & Price*)

Note*: In applicable scenarios
Step 3 - Data Sources
Primary Research
- Web Analytics
- Survey Reports
- Research Institute
- Latest Research Reports
- Opinion Leaders
Secondary Research
- Annual Reports
- White Paper
- Latest Press Release
- Industry Association
- Paid Database
- Investor Presentations

Step 4 - Data Triangulation
Involves using different sources of information in order to increase the validity of a study
These sources are likely to be stakeholders in a program - participants, other researchers, program staff, other community members, and so on.
Then we put all data in single framework & apply various statistical tools to find out the dynamic on the market.
During the analysis stage, feedback from the stakeholder groups would be compared to determine areas of agreement as well as areas of divergence