

Key Insights
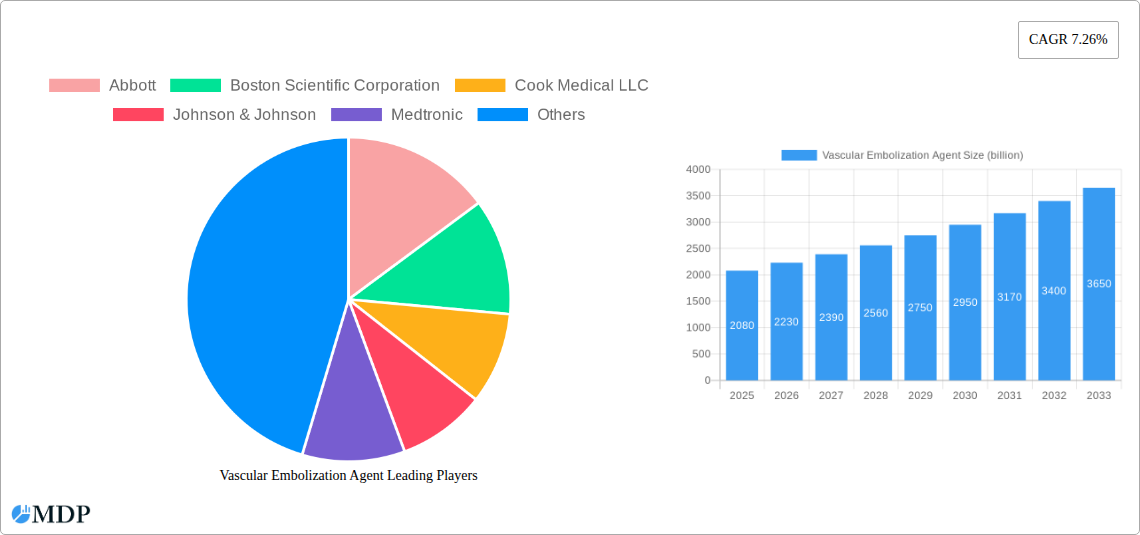
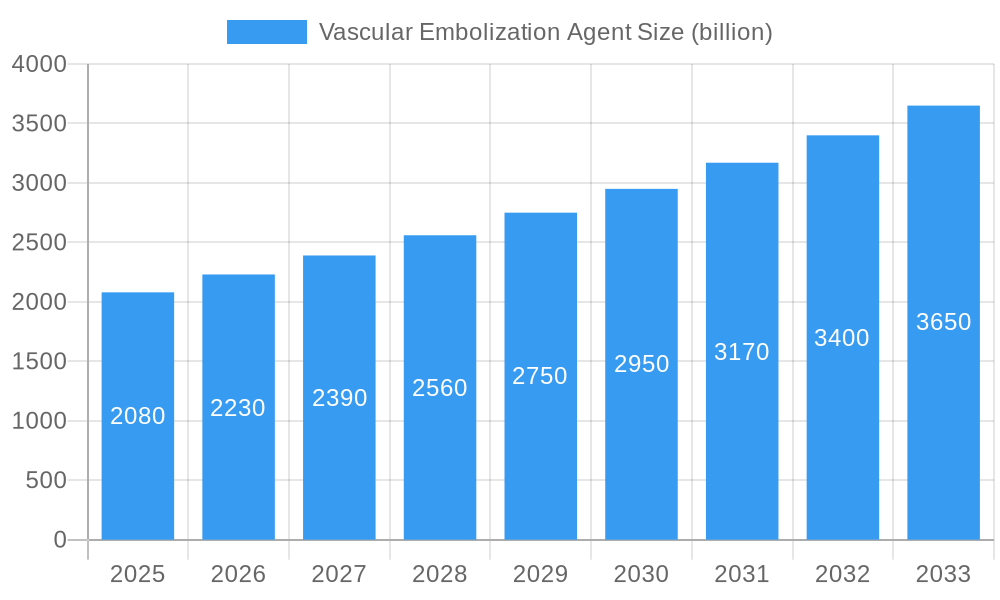
The global Vascular Embolization Agent market is poised for significant expansion, projected to reach USD 2.08 billion in 2025 and experience a robust Compound Annual Growth Rate (CAGR) of 7.26% through 2033. This growth is fueled by a confluence of escalating demand for minimally invasive procedures, a rising prevalence of vascular diseases, and continuous technological advancements in embolization technologies. Hospitals and Ambulatory Surgery Centers are the primary end-users, with both temporary and permanent embolization agents witnessing steady adoption. The increasing incidence of conditions such as aneurysms, arteriovenous malformations (AVMs), and peripheral artery disease necessitates effective and less invasive treatment options, directly driving the market. Furthermore, advancements in biomaterials and drug-eluting technologies are leading to the development of more targeted and effective embolization agents, enhancing treatment outcomes and patient recovery.
Vascular Embolization Agent Market Size (In Billion)
The market's trajectory is further shaped by a dynamic competitive landscape featuring established players and emerging innovators. Key drivers include the growing preference for outpatient procedures, reducing healthcare costs and improving patient convenience, coupled with an aging global population more susceptible to vascular ailments. While the market demonstrates strong growth potential, certain restraints such as stringent regulatory approvals for new agents and the high cost of advanced embolization devices need to be navigated. However, the ongoing research and development initiatives aimed at improving biocompatibility, efficacy, and ease of use are expected to mitigate these challenges. The Asia Pacific region, particularly China and India, is anticipated to emerge as a high-growth market due to increasing healthcare expenditure, improving access to advanced medical technologies, and a large patient pool.
Vascular Embolization Agent Company Market Share
Unlocking the Future of Endovascular Intervention: Comprehensive Report on the Global Vascular Embolization Agent Market (2019-2033)
This in-depth report offers a critical analysis of the global Vascular Embolization Agent market, a rapidly evolving sector crucial for advanced minimally invasive treatments. Spanning from 2019 to 2033, with a base year of 2025, this study provides invaluable insights into market dynamics, key trends, leading players, and future projections. Essential for interventional radiologists, neurosurgeons, vascular surgeons, medical device manufacturers, investors, and healthcare administrators, this report equips you with the data-driven intelligence needed to navigate and capitalize on this high-growth industry. The global market is projected to reach several hundred billion USD by 2033, driven by an increasing prevalence of vascular diseases and technological advancements.
Vascular Embolization Agent Market Dynamics & Concentration
The global Vascular Embolization Agent market is characterized by a moderate to high concentration, with leading players like Abbott, Boston Scientific Corporation, and Medtronic holding significant market share. Innovation remains a primary driver, fueled by the continuous development of novel embolic agents with improved biocompatibility, deliverability, and efficacy. Regulatory frameworks, while stringent, are evolving to facilitate the approval of advanced therapies, though navigating these pathways remains a key consideration for market entrants. Product substitutes, such as surgical interventions, are gradually being supplanted by less invasive embolization techniques. End-user trends highlight a growing preference for minimally invasive procedures, leading to increased adoption in both hospital settings and ambulatory surgery centers. Mergers and acquisitions (M&A) activities are notable, with companies seeking to expand their product portfolios and geographical reach. For instance, recent M&A activities have involved transactions valued in the billions, consolidating market leadership and fostering synergistic growth.
Vascular Embolization Agent Industry Trends & Analysis
The vascular embolization agent market is experiencing robust growth, projected to expand at a Compound Annual Growth Rate (CAGR) of approximately 8-10% throughout the forecast period. This expansion is propelled by several key market growth drivers. Firstly, the escalating incidence of vascular diseases such as aneurysms, arteriovenous malformations (AVMs), and tumors worldwide necessitates effective and minimally invasive treatment options, directly boosting demand for embolization agents. Secondly, significant technological disruptions are revolutionizing the field. Innovations in biomaterials have led to the development of more advanced embolic agents, including hydrogels, microspheres, and bioresorbable polymers, offering enhanced precision and reduced risk of complications. The transition towards personalized medicine is also influencing consumer preferences, with a demand for tailored embolization solutions for specific patient anatomies and pathologies. Competitive dynamics are intensifying, with established players investing heavily in R&D and new entrants vying for market share with innovative offerings. Market penetration is steadily increasing across both developed and emerging economies, as awareness of the benefits of endovascular procedures grows and healthcare infrastructure improves. The market penetration for advanced embolization techniques is expected to reach over 60% in key regions by the end of the forecast period.
Leading Markets & Segments in Vascular Embolization Agent
The Hospital segment is the dominant application within the Vascular Embolization Agent market, reflecting the critical role of hospitals in performing complex endovascular procedures. This dominance is driven by several factors, including the availability of specialized interventional suites, a higher concentration of experienced medical professionals, and the capacity to manage post-procedure care for critical patients. Economic policies in many nations are prioritizing investments in advanced healthcare infrastructure, further bolstering hospital-based embolization services.
Within applications, Temporary embolization agents are crucial for diagnostic procedures and temporary occlusion during complex interventions, exhibiting steady demand. However, the Permanent embolization agent segment is witnessing more substantial growth due to its application in definitive treatments for conditions like oncology, peripheral vascular disease, and neurovascular disorders. The increasing adoption of permanent embolization for tumor ablation and the management of chronic conditions contributes significantly to this segment's expansion.
Geographically, North America currently leads the market, driven by a high prevalence of vascular diseases, advanced healthcare infrastructure, and strong reimbursement policies for minimally invasive procedures. The region's market share is estimated to be over 35 billion USD. Asia Pacific, however, is emerging as the fastest-growing region, fueled by a large patient population, improving healthcare access, and increasing government initiatives to promote medical tourism and advanced healthcare technologies. The economic development in countries like China and India is supporting substantial investments in healthcare, leading to a rapid expansion of the embolization agent market in this region, with an estimated CAGR of over 10%.
Vascular Embolization Agent Product Developments
Product development in the vascular embolization agent market is characterized by a focus on enhanced biocompatibility, precise deliverability, and improved therapeutic outcomes. Innovations include the introduction of advanced hydrogel-based agents that conform to vascular anatomy, drug-eluting microspheres for targeted chemotherapy delivery in oncological embolization, and bioresorbable materials that minimize long-term foreign body presence. These developments offer significant competitive advantages by improving procedural efficiency, reducing complications, and enabling treatment of previously challenging vascular pathologies. The market is witnessing a trend towards agents designed for specific applications, such as neurovascular embolization or peripheral artery disease treatment, catering to specialized needs.
Key Drivers of Vascular Embolization Agent Growth
Several factors are propelling the growth of the vascular embolization agent market. Technologically, the development of advanced materials like hydrogels and bioresorbable polymers offers improved performance and patient outcomes. Economically, increasing healthcare expenditure and a growing demand for minimally invasive procedures are significant drivers. Regulatory bodies are also facilitating the approval of innovative embolization products, albeit with rigorous safety standards. The rising prevalence of chronic diseases like cancer and cardiovascular disorders further fuels the need for effective embolization therapies.
Challenges in the Vascular Embolization Agent Market
Despite its growth trajectory, the vascular embolization agent market faces several challenges. Stringent regulatory hurdles for new product approvals can lead to lengthy and costly development cycles. Supply chain disruptions, particularly for specialized raw materials or sterile manufacturing, can impact product availability. Intense competition among established and emerging players can exert pricing pressures. Furthermore, the need for specialized training and infrastructure for interventional procedures can limit adoption in certain regions, representing a market penetration challenge.
Emerging Opportunities in Vascular Embolization Agent
Emerging opportunities in the vascular embolization agent market are driven by technological breakthroughs and strategic market expansion. The development of intelligent embolic agents capable of responding to physiological cues or releasing therapeutic agents in a controlled manner presents a significant avenue for innovation. Strategic partnerships between medical device manufacturers and pharmaceutical companies can lead to the co-development of novel drug-eluting embolics. Furthermore, expanding market access in developing economies by offering cost-effective solutions and enhancing local training programs presents substantial long-term growth potential, estimated to unlock an additional several billion USD in market value.
Leading Players in the Vascular Embolization Agent Sector
- Abbott
- Boston Scientific Corporation
- Cook Medical LLC
- Johnson & Johnson
- Medtronic
- Acandis GmbH
- SSEM Mthembu Medical (Pty) Ltd
- Balt USA LLC
- Stryker
- Guerbet LLC
- Terumo Corporation
- Penumbra
- Grandpharma (Sirtex)
- Merit Medical
- Siemens Healthineers (Varian)
- Jiangsu Hengrui Medicine
- Kaneka
- Meril Life Sciences
- Peijia Medical
- Wallaby Medical
- MicroPort Scientific Corporation
- Weihai Visee Medical Devices
- Beijing Taijieweiye Technology
Key Milestones in Vascular Embolization Agent Industry
- 2019: Launch of novel bioresorbable polymer microspheres for peripheral embolization, offering improved long-term patient outcomes.
- 2020: Significant increase in R&D investments by leading players in the development of hydrogel-based embolic agents.
- 2021: Major acquisition of a key embolization device manufacturer by a large medical technology company, consolidating market share.
- 2022: Introduction of drug-eluting microspheres for targeted liver cancer treatment, enhancing oncological embolization efficacy.
- 2023: Expansion of regulatory approvals for advanced embolization agents in emerging markets, opening new revenue streams.
- 2024: Development of next-generation imaging-compatible embolic agents to improve procedural visualization and accuracy.
- 2025 (Estimated): Anticipated launch of AI-powered embolization guidance systems, revolutionizing procedural planning and execution.
- 2026-2033 (Projected): Continuous innovation in materials science and nanotechnology leading to highly targeted and programmable embolic agents.
Strategic Outlook for Vascular Embolization Agent Market
The strategic outlook for the vascular embolization agent market is exceptionally bright, driven by sustained innovation and increasing global demand for minimally invasive treatments. Key growth accelerators include the continued development of advanced materials with enhanced precision and biocompatibility, as well as the expansion of applications into new therapeutic areas like regenerative medicine. Strategic collaborations between technology developers and healthcare providers will be crucial for translating innovative products into clinical practice. Furthermore, aggressive market penetration in underserved regions, coupled with a focus on evidence-based outcomes and cost-effectiveness, will unlock significant future market potential, expected to contribute to the market's overall expansion by several hundred billion USD.
Vascular Embolization Agent Segmentation
-
1. Application
- 1.1. Hospital
- 1.2. Ambulatory Surgery Center
-
2. Types
- 2.1. Temporary
- 2.2. Permanent
Vascular Embolization Agent Segmentation By Geography
-
1. North America
- 1.1. United States
- 1.2. Canada
- 1.3. Mexico
-
2. South America
- 2.1. Brazil
- 2.2. Argentina
- 2.3. Rest of South America
-
3. Europe
- 3.1. United Kingdom
- 3.2. Germany
- 3.3. France
- 3.4. Italy
- 3.5. Spain
- 3.6. Russia
- 3.7. Benelux
- 3.8. Nordics
- 3.9. Rest of Europe
-
4. Middle East & Africa
- 4.1. Turkey
- 4.2. Israel
- 4.3. GCC
- 4.4. North Africa
- 4.5. South Africa
- 4.6. Rest of Middle East & Africa
-
5. Asia Pacific
- 5.1. China
- 5.2. India
- 5.3. Japan
- 5.4. South Korea
- 5.5. ASEAN
- 5.6. Oceania
- 5.7. Rest of Asia Pacific
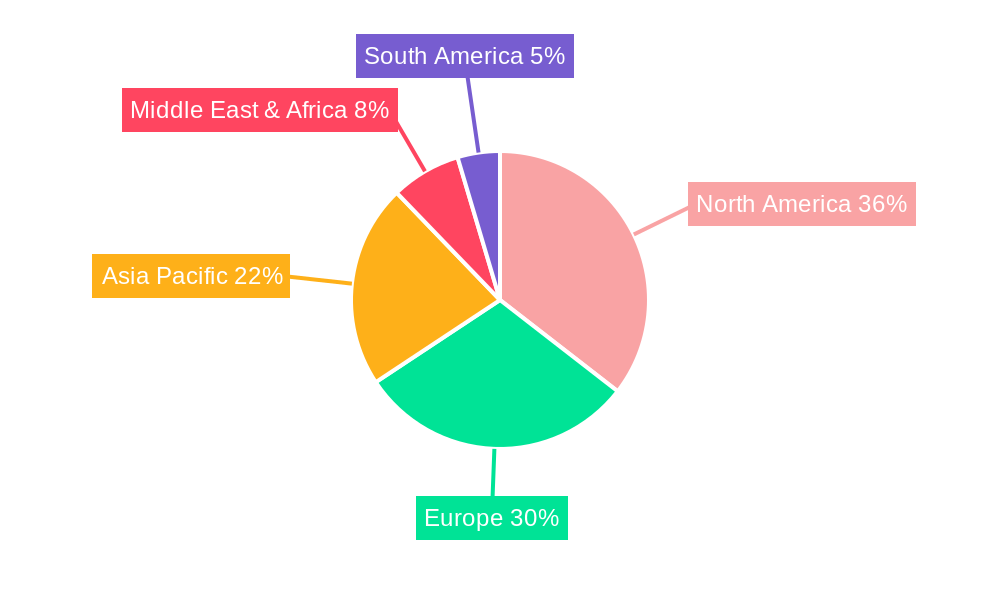
Vascular Embolization Agent Regional Market Share
Geographic Coverage of Vascular Embolization Agent
Vascular Embolization Agent REPORT HIGHLIGHTS
| Aspects | Details |
|---|---|
| Study Period | 2020-2034 |
| Base Year | 2025 |
| Estimated Year | 2026 |
| Forecast Period | 2026-2034 |
| Historical Period | 2020-2025 |
| Growth Rate | CAGR of 7.26% from 2020-2034 |
| Segmentation |
|
Table of Contents
- 1. Introduction
- 1.1. Research Scope
- 1.2. Market Segmentation
- 1.3. Research Objective
- 1.4. Definitions and Assumptions
- 2. Executive Summary
- 2.1. Market Snapshot
- 3. Market Dynamics
- 3.1. Market Drivers
- 3.2. Market Restrains
- 3.3. Market Trends
- 3.4. Market Opportunities
- 4. Market Factor Analysis
- 4.1. Porters Five Forces
- 4.1.1. Bargaining Power of Suppliers
- 4.1.2. Bargaining Power of Buyers
- 4.1.3. Threat of New Entrants
- 4.1.4. Threat of Substitutes
- 4.1.5. Competitive Rivalry
- 4.2. PESTEL analysis
- 4.3. BCG Analysis
- 4.3.1. Stars (High Growth, High Market Share)
- 4.3.2. Cash Cows (Low Growth, High Market Share)
- 4.3.3. Question Mark (High Growth, Low Market Share)
- 4.3.4. Dogs (Low Growth, Low Market Share)
- 4.4. Ansoff Matrix Analysis
- 4.5. Supply Chain Analysis
- 4.6. Regulatory Landscape
- 4.7. Current Market Potential and Opportunity Assessment (TAM–SAM–SOM Framework)
- 4.8. MDP Analyst Note
- 4.1. Porters Five Forces
- 5. Market Analysis, Insights and Forecast 2021-2033
- 5.1. Market Analysis, Insights and Forecast - by Application
- 5.1.1. Hospital
- 5.1.2. Ambulatory Surgery Center
- 5.2. Market Analysis, Insights and Forecast - by Types
- 5.2.1. Temporary
- 5.2.2. Permanent
- 5.3. Market Analysis, Insights and Forecast - by Region
- 5.3.1. North America
- 5.3.2. South America
- 5.3.3. Europe
- 5.3.4. Middle East & Africa
- 5.3.5. Asia Pacific
- 5.1. Market Analysis, Insights and Forecast - by Application
- 6. Global Vascular Embolization Agent Analysis, Insights and Forecast, 2021-2033
- 6.1. Market Analysis, Insights and Forecast - by Application
- 6.1.1. Hospital
- 6.1.2. Ambulatory Surgery Center
- 6.2. Market Analysis, Insights and Forecast - by Types
- 6.2.1. Temporary
- 6.2.2. Permanent
- 6.1. Market Analysis, Insights and Forecast - by Application
- 7. North America Vascular Embolization Agent Analysis, Insights and Forecast, 2020-2032
- 7.1. Market Analysis, Insights and Forecast - by Application
- 7.1.1. Hospital
- 7.1.2. Ambulatory Surgery Center
- 7.2. Market Analysis, Insights and Forecast - by Types
- 7.2.1. Temporary
- 7.2.2. Permanent
- 7.1. Market Analysis, Insights and Forecast - by Application
- 8. South America Vascular Embolization Agent Analysis, Insights and Forecast, 2020-2032
- 8.1. Market Analysis, Insights and Forecast - by Application
- 8.1.1. Hospital
- 8.1.2. Ambulatory Surgery Center
- 8.2. Market Analysis, Insights and Forecast - by Types
- 8.2.1. Temporary
- 8.2.2. Permanent
- 8.1. Market Analysis, Insights and Forecast - by Application
- 9. Europe Vascular Embolization Agent Analysis, Insights and Forecast, 2020-2032
- 9.1. Market Analysis, Insights and Forecast - by Application
- 9.1.1. Hospital
- 9.1.2. Ambulatory Surgery Center
- 9.2. Market Analysis, Insights and Forecast - by Types
- 9.2.1. Temporary
- 9.2.2. Permanent
- 9.1. Market Analysis, Insights and Forecast - by Application
- 10. Middle East & Africa Vascular Embolization Agent Analysis, Insights and Forecast, 2020-2032
- 10.1. Market Analysis, Insights and Forecast - by Application
- 10.1.1. Hospital
- 10.1.2. Ambulatory Surgery Center
- 10.2. Market Analysis, Insights and Forecast - by Types
- 10.2.1. Temporary
- 10.2.2. Permanent
- 10.1. Market Analysis, Insights and Forecast - by Application
- 11. Asia Pacific Vascular Embolization Agent Analysis, Insights and Forecast, 2020-2032
- 11.1. Market Analysis, Insights and Forecast - by Application
- 11.1.1. Hospital
- 11.1.2. Ambulatory Surgery Center
- 11.2. Market Analysis, Insights and Forecast - by Types
- 11.2.1. Temporary
- 11.2.2. Permanent
- 11.1. Market Analysis, Insights and Forecast - by Application
- 12. Competitive Analysis
- 12.1. Company Profiles
- 12.1.1 Abbott
- 12.1.1.1. Company Overview
- 12.1.1.2. Products
- 12.1.1.3. Company Financials
- 12.1.1.4. SWOT Analysis
- 12.1.2 Boston Scientific Corporation
- 12.1.2.1. Company Overview
- 12.1.2.2. Products
- 12.1.2.3. Company Financials
- 12.1.2.4. SWOT Analysis
- 12.1.3 Cook Medical LLC
- 12.1.3.1. Company Overview
- 12.1.3.2. Products
- 12.1.3.3. Company Financials
- 12.1.3.4. SWOT Analysis
- 12.1.4 Johnson & Johnson
- 12.1.4.1. Company Overview
- 12.1.4.2. Products
- 12.1.4.3. Company Financials
- 12.1.4.4. SWOT Analysis
- 12.1.5 Medtronic
- 12.1.5.1. Company Overview
- 12.1.5.2. Products
- 12.1.5.3. Company Financials
- 12.1.5.4. SWOT Analysis
- 12.1.6 Acandis GmbH
- 12.1.6.1. Company Overview
- 12.1.6.2. Products
- 12.1.6.3. Company Financials
- 12.1.6.4. SWOT Analysis
- 12.1.7 SSEM Mthembu Medical (Pty) Ltd
- 12.1.7.1. Company Overview
- 12.1.7.2. Products
- 12.1.7.3. Company Financials
- 12.1.7.4. SWOT Analysis
- 12.1.8 Balt USA LLC
- 12.1.8.1. Company Overview
- 12.1.8.2. Products
- 12.1.8.3. Company Financials
- 12.1.8.4. SWOT Analysis
- 12.1.9 Stryker
- 12.1.9.1. Company Overview
- 12.1.9.2. Products
- 12.1.9.3. Company Financials
- 12.1.9.4. SWOT Analysis
- 12.1.10 Guerbet LLC
- 12.1.10.1. Company Overview
- 12.1.10.2. Products
- 12.1.10.3. Company Financials
- 12.1.10.4. SWOT Analysis
- 12.1.11 Terumo Corporation
- 12.1.11.1. Company Overview
- 12.1.11.2. Products
- 12.1.11.3. Company Financials
- 12.1.11.4. SWOT Analysis
- 12.1.12 Penumbra
- 12.1.12.1. Company Overview
- 12.1.12.2. Products
- 12.1.12.3. Company Financials
- 12.1.12.4. SWOT Analysis
- 12.1.13 Grandpharma (Sirtex)
- 12.1.13.1. Company Overview
- 12.1.13.2. Products
- 12.1.13.3. Company Financials
- 12.1.13.4. SWOT Analysis
- 12.1.14 Merit Medical
- 12.1.14.1. Company Overview
- 12.1.14.2. Products
- 12.1.14.3. Company Financials
- 12.1.14.4. SWOT Analysis
- 12.1.15 Siemens Healthineers (Varian)
- 12.1.15.1. Company Overview
- 12.1.15.2. Products
- 12.1.15.3. Company Financials
- 12.1.15.4. SWOT Analysis
- 12.1.16 Jiangsu Hengrui Medicine
- 12.1.16.1. Company Overview
- 12.1.16.2. Products
- 12.1.16.3. Company Financials
- 12.1.16.4. SWOT Analysis
- 12.1.17 Kaneka
- 12.1.17.1. Company Overview
- 12.1.17.2. Products
- 12.1.17.3. Company Financials
- 12.1.17.4. SWOT Analysis
- 12.1.18 Meril Life Sciences
- 12.1.18.1. Company Overview
- 12.1.18.2. Products
- 12.1.18.3. Company Financials
- 12.1.18.4. SWOT Analysis
- 12.1.19 Peijia Medical
- 12.1.19.1. Company Overview
- 12.1.19.2. Products
- 12.1.19.3. Company Financials
- 12.1.19.4. SWOT Analysis
- 12.1.20 Wallaby Medical
- 12.1.20.1. Company Overview
- 12.1.20.2. Products
- 12.1.20.3. Company Financials
- 12.1.20.4. SWOT Analysis
- 12.1.21 MicroPort Scientific Corporation
- 12.1.21.1. Company Overview
- 12.1.21.2. Products
- 12.1.21.3. Company Financials
- 12.1.21.4. SWOT Analysis
- 12.1.22 Weihai Visee Medical Devices
- 12.1.22.1. Company Overview
- 12.1.22.2. Products
- 12.1.22.3. Company Financials
- 12.1.22.4. SWOT Analysis
- 12.1.23 Beijing Taijieweiye Technology
- 12.1.23.1. Company Overview
- 12.1.23.2. Products
- 12.1.23.3. Company Financials
- 12.1.23.4. SWOT Analysis
- 12.1.1 Abbott
- 12.2. Market Entropy
- 12.2.1 Company's Key Areas Served
- 12.2.2 Recent Developments
- 12.3. Company Market Share Analysis 2025
- 12.3.1 Top 5 Companies Market Share Analysis
- 12.3.2 Top 3 Companies Market Share Analysis
- 12.4. List of Potential Customers
- 13. Research Methodology
List of Figures
- Figure 1: Global Vascular Embolization Agent Revenue Breakdown (billion, %) by Region 2025 & 2033
- Figure 2: Global Vascular Embolization Agent Volume Breakdown (K, %) by Region 2025 & 2033
- Figure 3: North America Vascular Embolization Agent Revenue (billion), by Application 2025 & 2033
- Figure 4: North America Vascular Embolization Agent Volume (K), by Application 2025 & 2033
- Figure 5: North America Vascular Embolization Agent Revenue Share (%), by Application 2025 & 2033
- Figure 6: North America Vascular Embolization Agent Volume Share (%), by Application 2025 & 2033
- Figure 7: North America Vascular Embolization Agent Revenue (billion), by Types 2025 & 2033
- Figure 8: North America Vascular Embolization Agent Volume (K), by Types 2025 & 2033
- Figure 9: North America Vascular Embolization Agent Revenue Share (%), by Types 2025 & 2033
- Figure 10: North America Vascular Embolization Agent Volume Share (%), by Types 2025 & 2033
- Figure 11: North America Vascular Embolization Agent Revenue (billion), by Country 2025 & 2033
- Figure 12: North America Vascular Embolization Agent Volume (K), by Country 2025 & 2033
- Figure 13: North America Vascular Embolization Agent Revenue Share (%), by Country 2025 & 2033
- Figure 14: North America Vascular Embolization Agent Volume Share (%), by Country 2025 & 2033
- Figure 15: South America Vascular Embolization Agent Revenue (billion), by Application 2025 & 2033
- Figure 16: South America Vascular Embolization Agent Volume (K), by Application 2025 & 2033
- Figure 17: South America Vascular Embolization Agent Revenue Share (%), by Application 2025 & 2033
- Figure 18: South America Vascular Embolization Agent Volume Share (%), by Application 2025 & 2033
- Figure 19: South America Vascular Embolization Agent Revenue (billion), by Types 2025 & 2033
- Figure 20: South America Vascular Embolization Agent Volume (K), by Types 2025 & 2033
- Figure 21: South America Vascular Embolization Agent Revenue Share (%), by Types 2025 & 2033
- Figure 22: South America Vascular Embolization Agent Volume Share (%), by Types 2025 & 2033
- Figure 23: South America Vascular Embolization Agent Revenue (billion), by Country 2025 & 2033
- Figure 24: South America Vascular Embolization Agent Volume (K), by Country 2025 & 2033
- Figure 25: South America Vascular Embolization Agent Revenue Share (%), by Country 2025 & 2033
- Figure 26: South America Vascular Embolization Agent Volume Share (%), by Country 2025 & 2033
- Figure 27: Europe Vascular Embolization Agent Revenue (billion), by Application 2025 & 2033
- Figure 28: Europe Vascular Embolization Agent Volume (K), by Application 2025 & 2033
- Figure 29: Europe Vascular Embolization Agent Revenue Share (%), by Application 2025 & 2033
- Figure 30: Europe Vascular Embolization Agent Volume Share (%), by Application 2025 & 2033
- Figure 31: Europe Vascular Embolization Agent Revenue (billion), by Types 2025 & 2033
- Figure 32: Europe Vascular Embolization Agent Volume (K), by Types 2025 & 2033
- Figure 33: Europe Vascular Embolization Agent Revenue Share (%), by Types 2025 & 2033
- Figure 34: Europe Vascular Embolization Agent Volume Share (%), by Types 2025 & 2033
- Figure 35: Europe Vascular Embolization Agent Revenue (billion), by Country 2025 & 2033
- Figure 36: Europe Vascular Embolization Agent Volume (K), by Country 2025 & 2033
- Figure 37: Europe Vascular Embolization Agent Revenue Share (%), by Country 2025 & 2033
- Figure 38: Europe Vascular Embolization Agent Volume Share (%), by Country 2025 & 2033
- Figure 39: Middle East & Africa Vascular Embolization Agent Revenue (billion), by Application 2025 & 2033
- Figure 40: Middle East & Africa Vascular Embolization Agent Volume (K), by Application 2025 & 2033
- Figure 41: Middle East & Africa Vascular Embolization Agent Revenue Share (%), by Application 2025 & 2033
- Figure 42: Middle East & Africa Vascular Embolization Agent Volume Share (%), by Application 2025 & 2033
- Figure 43: Middle East & Africa Vascular Embolization Agent Revenue (billion), by Types 2025 & 2033
- Figure 44: Middle East & Africa Vascular Embolization Agent Volume (K), by Types 2025 & 2033
- Figure 45: Middle East & Africa Vascular Embolization Agent Revenue Share (%), by Types 2025 & 2033
- Figure 46: Middle East & Africa Vascular Embolization Agent Volume Share (%), by Types 2025 & 2033
- Figure 47: Middle East & Africa Vascular Embolization Agent Revenue (billion), by Country 2025 & 2033
- Figure 48: Middle East & Africa Vascular Embolization Agent Volume (K), by Country 2025 & 2033
- Figure 49: Middle East & Africa Vascular Embolization Agent Revenue Share (%), by Country 2025 & 2033
- Figure 50: Middle East & Africa Vascular Embolization Agent Volume Share (%), by Country 2025 & 2033
- Figure 51: Asia Pacific Vascular Embolization Agent Revenue (billion), by Application 2025 & 2033
- Figure 52: Asia Pacific Vascular Embolization Agent Volume (K), by Application 2025 & 2033
- Figure 53: Asia Pacific Vascular Embolization Agent Revenue Share (%), by Application 2025 & 2033
- Figure 54: Asia Pacific Vascular Embolization Agent Volume Share (%), by Application 2025 & 2033
- Figure 55: Asia Pacific Vascular Embolization Agent Revenue (billion), by Types 2025 & 2033
- Figure 56: Asia Pacific Vascular Embolization Agent Volume (K), by Types 2025 & 2033
- Figure 57: Asia Pacific Vascular Embolization Agent Revenue Share (%), by Types 2025 & 2033
- Figure 58: Asia Pacific Vascular Embolization Agent Volume Share (%), by Types 2025 & 2033
- Figure 59: Asia Pacific Vascular Embolization Agent Revenue (billion), by Country 2025 & 2033
- Figure 60: Asia Pacific Vascular Embolization Agent Volume (K), by Country 2025 & 2033
- Figure 61: Asia Pacific Vascular Embolization Agent Revenue Share (%), by Country 2025 & 2033
- Figure 62: Asia Pacific Vascular Embolization Agent Volume Share (%), by Country 2025 & 2033
List of Tables
- Table 1: Global Vascular Embolization Agent Revenue billion Forecast, by Application 2020 & 2033
- Table 2: Global Vascular Embolization Agent Volume K Forecast, by Application 2020 & 2033
- Table 3: Global Vascular Embolization Agent Revenue billion Forecast, by Types 2020 & 2033
- Table 4: Global Vascular Embolization Agent Volume K Forecast, by Types 2020 & 2033
- Table 5: Global Vascular Embolization Agent Revenue billion Forecast, by Region 2020 & 2033
- Table 6: Global Vascular Embolization Agent Volume K Forecast, by Region 2020 & 2033
- Table 7: Global Vascular Embolization Agent Revenue billion Forecast, by Application 2020 & 2033
- Table 8: Global Vascular Embolization Agent Volume K Forecast, by Application 2020 & 2033
- Table 9: Global Vascular Embolization Agent Revenue billion Forecast, by Types 2020 & 2033
- Table 10: Global Vascular Embolization Agent Volume K Forecast, by Types 2020 & 2033
- Table 11: Global Vascular Embolization Agent Revenue billion Forecast, by Country 2020 & 2033
- Table 12: Global Vascular Embolization Agent Volume K Forecast, by Country 2020 & 2033
- Table 13: United States Vascular Embolization Agent Revenue (billion) Forecast, by Application 2020 & 2033
- Table 14: United States Vascular Embolization Agent Volume (K) Forecast, by Application 2020 & 2033
- Table 15: Canada Vascular Embolization Agent Revenue (billion) Forecast, by Application 2020 & 2033
- Table 16: Canada Vascular Embolization Agent Volume (K) Forecast, by Application 2020 & 2033
- Table 17: Mexico Vascular Embolization Agent Revenue (billion) Forecast, by Application 2020 & 2033
- Table 18: Mexico Vascular Embolization Agent Volume (K) Forecast, by Application 2020 & 2033
- Table 19: Global Vascular Embolization Agent Revenue billion Forecast, by Application 2020 & 2033
- Table 20: Global Vascular Embolization Agent Volume K Forecast, by Application 2020 & 2033
- Table 21: Global Vascular Embolization Agent Revenue billion Forecast, by Types 2020 & 2033
- Table 22: Global Vascular Embolization Agent Volume K Forecast, by Types 2020 & 2033
- Table 23: Global Vascular Embolization Agent Revenue billion Forecast, by Country 2020 & 2033
- Table 24: Global Vascular Embolization Agent Volume K Forecast, by Country 2020 & 2033
- Table 25: Brazil Vascular Embolization Agent Revenue (billion) Forecast, by Application 2020 & 2033
- Table 26: Brazil Vascular Embolization Agent Volume (K) Forecast, by Application 2020 & 2033
- Table 27: Argentina Vascular Embolization Agent Revenue (billion) Forecast, by Application 2020 & 2033
- Table 28: Argentina Vascular Embolization Agent Volume (K) Forecast, by Application 2020 & 2033
- Table 29: Rest of South America Vascular Embolization Agent Revenue (billion) Forecast, by Application 2020 & 2033
- Table 30: Rest of South America Vascular Embolization Agent Volume (K) Forecast, by Application 2020 & 2033
- Table 31: Global Vascular Embolization Agent Revenue billion Forecast, by Application 2020 & 2033
- Table 32: Global Vascular Embolization Agent Volume K Forecast, by Application 2020 & 2033
- Table 33: Global Vascular Embolization Agent Revenue billion Forecast, by Types 2020 & 2033
- Table 34: Global Vascular Embolization Agent Volume K Forecast, by Types 2020 & 2033
- Table 35: Global Vascular Embolization Agent Revenue billion Forecast, by Country 2020 & 2033
- Table 36: Global Vascular Embolization Agent Volume K Forecast, by Country 2020 & 2033
- Table 37: United Kingdom Vascular Embolization Agent Revenue (billion) Forecast, by Application 2020 & 2033
- Table 38: United Kingdom Vascular Embolization Agent Volume (K) Forecast, by Application 2020 & 2033
- Table 39: Germany Vascular Embolization Agent Revenue (billion) Forecast, by Application 2020 & 2033
- Table 40: Germany Vascular Embolization Agent Volume (K) Forecast, by Application 2020 & 2033
- Table 41: France Vascular Embolization Agent Revenue (billion) Forecast, by Application 2020 & 2033
- Table 42: France Vascular Embolization Agent Volume (K) Forecast, by Application 2020 & 2033
- Table 43: Italy Vascular Embolization Agent Revenue (billion) Forecast, by Application 2020 & 2033
- Table 44: Italy Vascular Embolization Agent Volume (K) Forecast, by Application 2020 & 2033
- Table 45: Spain Vascular Embolization Agent Revenue (billion) Forecast, by Application 2020 & 2033
- Table 46: Spain Vascular Embolization Agent Volume (K) Forecast, by Application 2020 & 2033
- Table 47: Russia Vascular Embolization Agent Revenue (billion) Forecast, by Application 2020 & 2033
- Table 48: Russia Vascular Embolization Agent Volume (K) Forecast, by Application 2020 & 2033
- Table 49: Benelux Vascular Embolization Agent Revenue (billion) Forecast, by Application 2020 & 2033
- Table 50: Benelux Vascular Embolization Agent Volume (K) Forecast, by Application 2020 & 2033
- Table 51: Nordics Vascular Embolization Agent Revenue (billion) Forecast, by Application 2020 & 2033
- Table 52: Nordics Vascular Embolization Agent Volume (K) Forecast, by Application 2020 & 2033
- Table 53: Rest of Europe Vascular Embolization Agent Revenue (billion) Forecast, by Application 2020 & 2033
- Table 54: Rest of Europe Vascular Embolization Agent Volume (K) Forecast, by Application 2020 & 2033
- Table 55: Global Vascular Embolization Agent Revenue billion Forecast, by Application 2020 & 2033
- Table 56: Global Vascular Embolization Agent Volume K Forecast, by Application 2020 & 2033
- Table 57: Global Vascular Embolization Agent Revenue billion Forecast, by Types 2020 & 2033
- Table 58: Global Vascular Embolization Agent Volume K Forecast, by Types 2020 & 2033
- Table 59: Global Vascular Embolization Agent Revenue billion Forecast, by Country 2020 & 2033
- Table 60: Global Vascular Embolization Agent Volume K Forecast, by Country 2020 & 2033
- Table 61: Turkey Vascular Embolization Agent Revenue (billion) Forecast, by Application 2020 & 2033
- Table 62: Turkey Vascular Embolization Agent Volume (K) Forecast, by Application 2020 & 2033
- Table 63: Israel Vascular Embolization Agent Revenue (billion) Forecast, by Application 2020 & 2033
- Table 64: Israel Vascular Embolization Agent Volume (K) Forecast, by Application 2020 & 2033
- Table 65: GCC Vascular Embolization Agent Revenue (billion) Forecast, by Application 2020 & 2033
- Table 66: GCC Vascular Embolization Agent Volume (K) Forecast, by Application 2020 & 2033
- Table 67: North Africa Vascular Embolization Agent Revenue (billion) Forecast, by Application 2020 & 2033
- Table 68: North Africa Vascular Embolization Agent Volume (K) Forecast, by Application 2020 & 2033
- Table 69: South Africa Vascular Embolization Agent Revenue (billion) Forecast, by Application 2020 & 2033
- Table 70: South Africa Vascular Embolization Agent Volume (K) Forecast, by Application 2020 & 2033
- Table 71: Rest of Middle East & Africa Vascular Embolization Agent Revenue (billion) Forecast, by Application 2020 & 2033
- Table 72: Rest of Middle East & Africa Vascular Embolization Agent Volume (K) Forecast, by Application 2020 & 2033
- Table 73: Global Vascular Embolization Agent Revenue billion Forecast, by Application 2020 & 2033
- Table 74: Global Vascular Embolization Agent Volume K Forecast, by Application 2020 & 2033
- Table 75: Global Vascular Embolization Agent Revenue billion Forecast, by Types 2020 & 2033
- Table 76: Global Vascular Embolization Agent Volume K Forecast, by Types 2020 & 2033
- Table 77: Global Vascular Embolization Agent Revenue billion Forecast, by Country 2020 & 2033
- Table 78: Global Vascular Embolization Agent Volume K Forecast, by Country 2020 & 2033
- Table 79: China Vascular Embolization Agent Revenue (billion) Forecast, by Application 2020 & 2033
- Table 80: China Vascular Embolization Agent Volume (K) Forecast, by Application 2020 & 2033
- Table 81: India Vascular Embolization Agent Revenue (billion) Forecast, by Application 2020 & 2033
- Table 82: India Vascular Embolization Agent Volume (K) Forecast, by Application 2020 & 2033
- Table 83: Japan Vascular Embolization Agent Revenue (billion) Forecast, by Application 2020 & 2033
- Table 84: Japan Vascular Embolization Agent Volume (K) Forecast, by Application 2020 & 2033
- Table 85: South Korea Vascular Embolization Agent Revenue (billion) Forecast, by Application 2020 & 2033
- Table 86: South Korea Vascular Embolization Agent Volume (K) Forecast, by Application 2020 & 2033
- Table 87: ASEAN Vascular Embolization Agent Revenue (billion) Forecast, by Application 2020 & 2033
- Table 88: ASEAN Vascular Embolization Agent Volume (K) Forecast, by Application 2020 & 2033
- Table 89: Oceania Vascular Embolization Agent Revenue (billion) Forecast, by Application 2020 & 2033
- Table 90: Oceania Vascular Embolization Agent Volume (K) Forecast, by Application 2020 & 2033
- Table 91: Rest of Asia Pacific Vascular Embolization Agent Revenue (billion) Forecast, by Application 2020 & 2033
- Table 92: Rest of Asia Pacific Vascular Embolization Agent Volume (K) Forecast, by Application 2020 & 2033
Frequently Asked Questions
1. What is the projected Compound Annual Growth Rate (CAGR) of the Vascular Embolization Agent?
The projected CAGR is approximately 7.26%.
2. Which companies are prominent players in the Vascular Embolization Agent?
Key companies in the market include Abbott, Boston Scientific Corporation, Cook Medical LLC, Johnson & Johnson, Medtronic, Acandis GmbH, SSEM Mthembu Medical (Pty) Ltd, Balt USA LLC, Stryker, Guerbet LLC, Terumo Corporation, Penumbra, Grandpharma (Sirtex), Merit Medical, Siemens Healthineers (Varian), Jiangsu Hengrui Medicine, Kaneka, Meril Life Sciences, Peijia Medical, Wallaby Medical, MicroPort Scientific Corporation, Weihai Visee Medical Devices, Beijing Taijieweiye Technology.
3. What are the main segments of the Vascular Embolization Agent?
The market segments include Application, Types.
4. Can you provide details about the market size?
The market size is estimated to be USD 2.08 billion as of 2022.
5. What are some drivers contributing to market growth?
N/A
6. What are the notable trends driving market growth?
N/A
7. Are there any restraints impacting market growth?
N/A
8. Can you provide examples of recent developments in the market?
N/A
9. What pricing options are available for accessing the report?
Pricing options include single-user, multi-user, and enterprise licenses priced at USD 3950.00, USD 5925.00, and USD 7900.00 respectively.
10. Is the market size provided in terms of value or volume?
The market size is provided in terms of value, measured in billion and volume, measured in K.
11. Are there any specific market keywords associated with the report?
Yes, the market keyword associated with the report is "Vascular Embolization Agent," which aids in identifying and referencing the specific market segment covered.
12. How do I determine which pricing option suits my needs best?
The pricing options vary based on user requirements and access needs. Individual users may opt for single-user licenses, while businesses requiring broader access may choose multi-user or enterprise licenses for cost-effective access to the report.
13. Are there any additional resources or data provided in the Vascular Embolization Agent report?
While the report offers comprehensive insights, it's advisable to review the specific contents or supplementary materials provided to ascertain if additional resources or data are available.
14. How can I stay updated on further developments or reports in the Vascular Embolization Agent?
To stay informed about further developments, trends, and reports in the Vascular Embolization Agent, consider subscribing to industry newsletters, following relevant companies and organizations, or regularly checking reputable industry news sources and publications.
Methodology
Step 1 - Identification of Relevant Samples Size from Population Database


Step 2 - Approaches for Defining Global Market Size (Value, Volume* & Price*)

Note*: In applicable scenarios
Step 3 - Data Sources
Primary Research
- Web Analytics
- Survey Reports
- Research Institute
- Latest Research Reports
- Opinion Leaders
Secondary Research
- Annual Reports
- White Paper
- Latest Press Release
- Industry Association
- Paid Database
- Investor Presentations

Step 4 - Data Triangulation
Involves using different sources of information in order to increase the validity of a study
These sources are likely to be stakeholders in a program - participants, other researchers, program staff, other community members, and so on.
Then we put all data in single framework & apply various statistical tools to find out the dynamic on the market.
During the analysis stage, feedback from the stakeholder groups would be compared to determine areas of agreement as well as areas of divergence