

Key Insights
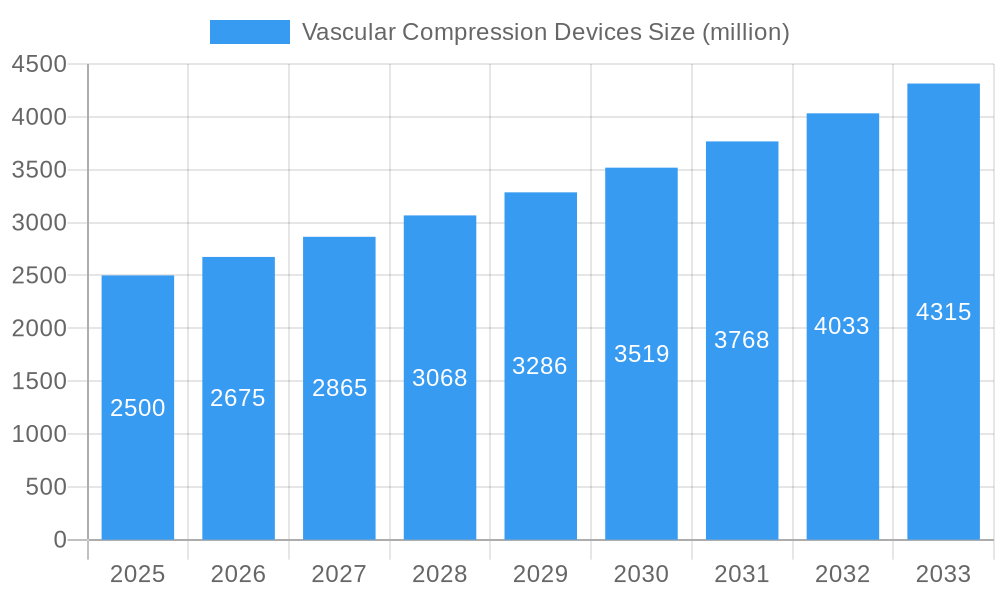
The global vascular compression devices market is experiencing robust growth, driven by an aging population with a higher prevalence of cardiovascular diseases, increasing demand for minimally invasive surgical procedures, and technological advancements leading to improved device efficacy and safety. The market, estimated at $2.5 billion in 2025, is projected to maintain a healthy Compound Annual Growth Rate (CAGR) of 7% from 2025 to 2033, reaching an estimated $4.2 billion by 2033. Key drivers include the rising incidence of venous thromboembolism (VTE), peripheral artery disease (PAD), and deep vein thrombosis (DVT), all conditions where vascular compression devices play a crucial role in treatment and prevention. Furthermore, the expanding application of these devices in various medical settings, such as hospitals, ambulatory surgical centers, and home healthcare, contributes significantly to market expansion. Major market players like Medtronic, Merit Medical, Perouse Medical, Medas Inc, Terumo Medical, and Trutech Medical are continually innovating and expanding their product portfolios to capture market share, fueling competition and driving market growth.
Vascular Compression Devices Market Size (In Billion)
However, market growth faces certain restraints. High costs associated with advanced vascular compression devices can limit accessibility, especially in developing economies. Furthermore, the potential for complications such as deep vein thrombosis or nerve damage associated with prolonged use necessitates stringent safety protocols and ongoing research to improve device design and efficacy. Despite these challenges, the market is expected to witness continued expansion driven by the rising prevalence of target conditions, increasing healthcare expenditure, and the development of more sophisticated and user-friendly devices. Market segmentation by device type (e.g., pneumatic compression devices, intermittent pneumatic compression devices, sequential compression devices), application (e.g., DVT prevention, edema reduction, wound healing), and end-user (hospitals, ambulatory surgical centers) reveals varied growth trajectories, offering further granular insights into market dynamics. Geographic analysis suggests strong market potential in North America and Europe, while emerging economies present considerable untapped opportunities for growth.
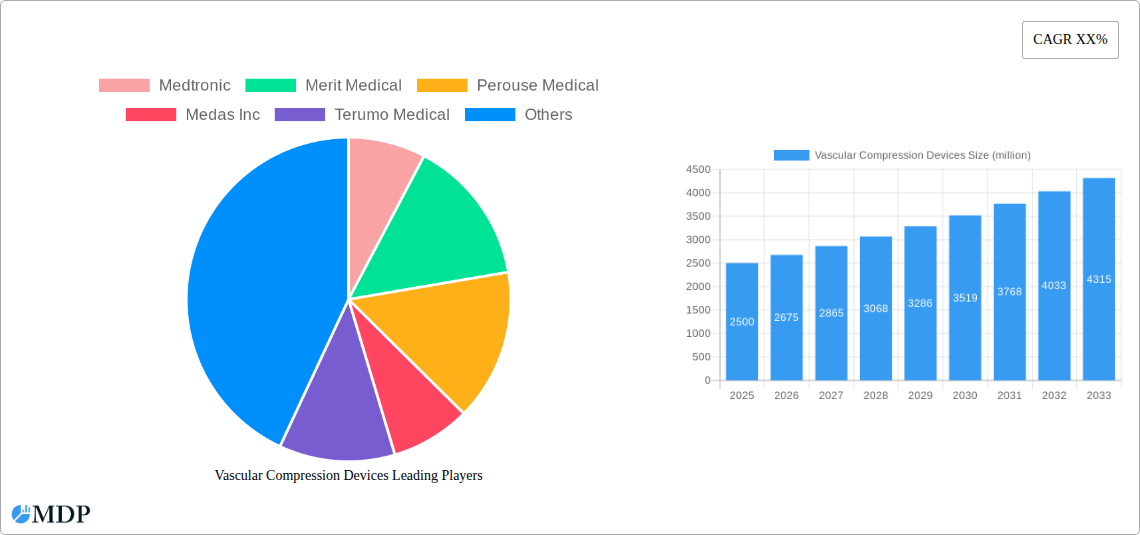
Vascular Compression Devices Company Market Share
Vascular Compression Devices Market Report: A Comprehensive Analysis (2019-2033)
This comprehensive report provides a detailed analysis of the global Vascular Compression Devices market, offering invaluable insights for stakeholders across the industry. The report covers the period from 2019 to 2033, with a focus on the forecast period from 2025 to 2033. The market is projected to reach $XX million by 2033, exhibiting a CAGR of XX% during the forecast period. This report analyzes market dynamics, leading players (including Medtronic, Merit Medical, Perouse Medical, Medas Inc, Terumo Medical, and Trutech Medical), technological advancements, and emerging opportunities, providing actionable intelligence to navigate this dynamic sector.
Vascular Compression Devices Market Dynamics & Concentration
The global vascular compression devices market is characterized by a moderately concentrated landscape, with a few major players holding significant market share. Medtronic and Terumo Medical are estimated to hold approximately XX% and YY% of the market share respectively in 2025, while other players like Merit Medical and Perouse Medical contribute with significantly smaller shares. Innovation is a key driver, with companies continually developing advanced materials and technologies to improve device performance and patient outcomes. Regulatory frameworks, particularly those concerning safety and efficacy, significantly influence market dynamics. The market also faces competition from alternative treatment methods, impacting overall growth. Mergers and acquisitions (M&A) activity within the sector has been relatively modest, with approximately XX M&A deals recorded between 2019 and 2024. End-user trends, driven by an aging population and increasing prevalence of vascular diseases, are expected to fuel market growth.
- Market Concentration: Moderately concentrated, with a few dominant players.
- Innovation Drivers: Advancements in materials, miniaturization, and improved functionality.
- Regulatory Frameworks: Stringent regulations impacting product development and market entry.
- Product Substitutes: Alternative therapies and treatment methods pose competitive pressures.
- End-User Trends: Aging population and rising prevalence of vascular diseases are driving demand.
- M&A Activity: XX deals between 2019 and 2024, indicating moderate consolidation.
Vascular Compression Devices Industry Trends & Analysis
The vascular compression devices market is witnessing significant growth driven by factors such as the rising prevalence of chronic venous insufficiency (CVI), the increasing geriatric population susceptible to venous disorders, and technological advancements leading to improved device efficacy and patient comfort. Technological disruptions, including the introduction of minimally invasive procedures and smart devices, are transforming the market landscape. Consumer preferences are shifting towards less invasive procedures with faster recovery times, impacting the demand for specific device types. The market exhibits intense competitive dynamics, with established players focusing on product innovation and expanding their geographical reach. The market's CAGR during the historical period (2019-2024) was estimated to be XX%, and market penetration is expected to increase significantly in developing economies. Specific technological trends include the development of biocompatible materials and advanced compression techniques to improve treatment outcomes.
Leading Markets & Segments in Vascular Compression Devices
North America currently dominates the global vascular compression devices market, driven by high healthcare expenditure, advanced medical infrastructure, and a large patient pool. This dominance is further propelled by favorable reimbursement policies and the high prevalence of vascular diseases in the region. The European market is also significant, though slightly smaller than North America, and is witnessing substantial growth.
Key Drivers of North American Market Dominance:
- High healthcare expenditure: Enabling greater access to advanced medical technologies.
- Advanced medical infrastructure: Supporting the widespread adoption of vascular compression devices.
- Large patient pool: High prevalence of venous disorders and other vascular diseases.
- Favorable reimbursement policies: Facilitating greater accessibility and affordability.
Detailed Dominance Analysis: The North American market's dominance is largely attributed to factors like increased awareness about vascular diseases, improved healthcare infrastructure, and a high density of specialized healthcare providers. The strong presence of key players, coupled with robust R&D activities, further strengthens this region's leading position. However, emerging markets in Asia-Pacific and Latin America are expected to exhibit higher growth rates in the coming years due to rising disposable incomes, improved healthcare infrastructure, and increasing awareness about vascular diseases.
Vascular Compression Devices Product Developments
Recent product innovations in vascular compression devices focus on enhanced comfort, improved efficacy, and minimally invasive applications. Manufacturers are developing smaller, lighter, and more comfortable devices that can be worn for extended periods. The incorporation of smart technologies, such as integrated sensors and data tracking capabilities, is also gaining traction, offering personalized treatment options. These advancements are improving patient compliance and driving overall market growth. The focus on ease of use and better therapeutic outcomes contributes to the growing adoption of these devices.
Key Drivers of Vascular Compression Devices Growth
Several factors are driving the growth of the vascular compression devices market. The increasing prevalence of venous disorders, such as deep vein thrombosis (DVT) and chronic venous insufficiency (CVI), is a primary driver. Furthermore, the rising geriatric population, which is more prone to vascular diseases, is significantly contributing to market expansion. Technological advancements, resulting in more effective and comfortable devices, are also stimulating market growth. Favorable reimbursement policies and supportive regulatory frameworks in certain regions further boost market expansion.
Challenges in the Vascular Compression Devices Market
The vascular compression devices market faces several challenges. Stringent regulatory approvals and compliance requirements can hinder product launches and increase development costs. Supply chain disruptions and material shortages can affect production and availability. Intense competition among established and emerging players can lead to price pressures and reduced profit margins. The market also faces challenges from the availability of alternative treatment methods, which can limit the adoption of vascular compression devices. These factors collectively impact the overall growth trajectory of the market. For instance, supply chain disruptions in 2022 resulted in a XX% decrease in production for some major manufacturers.
Emerging Opportunities in Vascular Compression Devices
Significant opportunities exist for growth in the vascular compression devices market. Advancements in material science, leading to biocompatible and more durable devices, will open new avenues for market expansion. Strategic partnerships between device manufacturers and healthcare providers can improve market penetration and access to wider patient populations. Expansion into emerging markets, where the prevalence of vascular diseases is high, presents significant growth potential. These opportunities offer substantial potential to drive market growth in the long term.
Leading Players in the Vascular Compression Devices Sector
- Medtronic
- Merit Medical
- Perouse Medical
- Medas Inc
- Terumo Medical
- Trutech Medical
Key Milestones in Vascular Compression Devices Industry
- 2020: Introduction of a new generation of compression stockings incorporating smart textile technology by Medtronic.
- 2021: Merit Medical acquires a smaller competitor, expanding its product portfolio and market share.
- 2022: FDA approval of a novel vascular compression device with improved patient comfort and efficacy.
- 2023: Launch of a minimally invasive vascular compression system by Terumo Medical.
- 2024: Significant investment in R&D by leading players to develop next-generation compression devices.
Strategic Outlook for Vascular Compression Devices Market
The vascular compression devices market holds substantial growth potential due to the increasing prevalence of vascular diseases, technological advancements, and favorable regulatory environments in key regions. Strategic opportunities include focusing on product innovation, expanding into new geographical markets, and forging strategic partnerships to enhance market access. Continued investment in R&D and exploring novel applications of compression technologies will be crucial to maintain a competitive edge. The market is expected to experience robust growth, driven by a combination of factors including demographic shifts and advances in medical technology.
Vascular Compression Devices Segmentation
-
1. Application
- 1.1. Pain Control
- 1.2. Edema
- 1.3. Lymphedema
- 1.4. Others
-
2. Types
- 2.1. Pneumatic Compression Pumps
- 2.2. DVT Prevention System
- 2.3. Others
Vascular Compression Devices Segmentation By Geography
-
1. North America
- 1.1. United States
- 1.2. Canada
- 1.3. Mexico
-
2. South America
- 2.1. Brazil
- 2.2. Argentina
- 2.3. Rest of South America
-
3. Europe
- 3.1. United Kingdom
- 3.2. Germany
- 3.3. France
- 3.4. Italy
- 3.5. Spain
- 3.6. Russia
- 3.7. Benelux
- 3.8. Nordics
- 3.9. Rest of Europe
-
4. Middle East & Africa
- 4.1. Turkey
- 4.2. Israel
- 4.3. GCC
- 4.4. North Africa
- 4.5. South Africa
- 4.6. Rest of Middle East & Africa
-
5. Asia Pacific
- 5.1. China
- 5.2. India
- 5.3. Japan
- 5.4. South Korea
- 5.5. ASEAN
- 5.6. Oceania
- 5.7. Rest of Asia Pacific
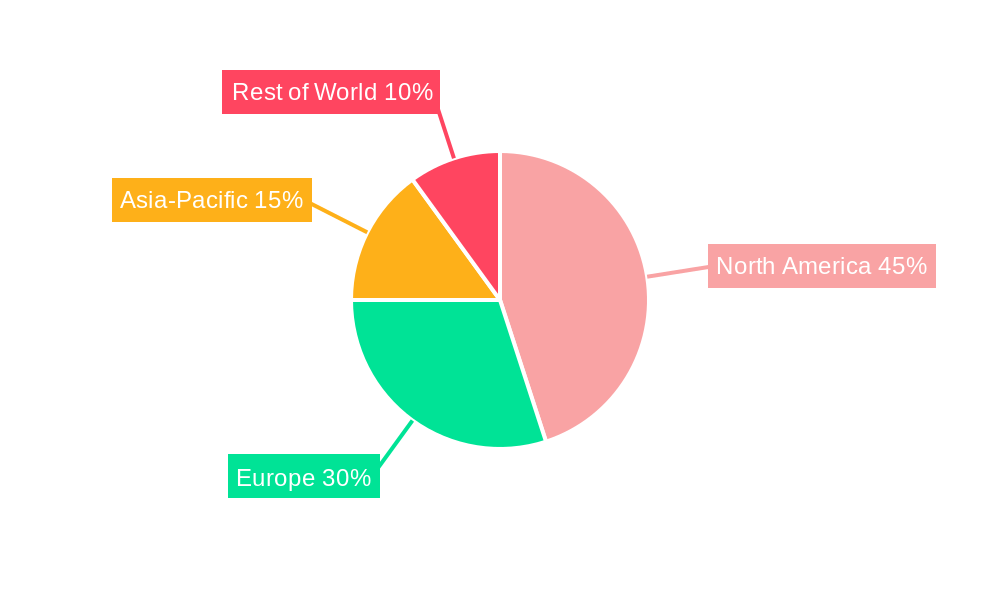
Vascular Compression Devices Regional Market Share
Geographic Coverage of Vascular Compression Devices
Vascular Compression Devices REPORT HIGHLIGHTS
| Aspects | Details |
|---|---|
| Study Period | 2020-2034 |
| Base Year | 2025 |
| Estimated Year | 2026 |
| Forecast Period | 2026-2034 |
| Historical Period | 2020-2025 |
| Growth Rate | CAGR of 5.7% from 2020-2034 |
| Segmentation |
|
Table of Contents
- 1. Introduction
- 1.1. Research Scope
- 1.2. Market Segmentation
- 1.3. Research Objective
- 1.4. Definitions and Assumptions
- 2. Executive Summary
- 2.1. Market Snapshot
- 3. Market Dynamics
- 3.1. Market Drivers
- 3.2. Market Restrains
- 3.3. Market Trends
- 3.4. Market Opportunities
- 4. Market Factor Analysis
- 4.1. Porters Five Forces
- 4.1.1. Bargaining Power of Suppliers
- 4.1.2. Bargaining Power of Buyers
- 4.1.3. Threat of New Entrants
- 4.1.4. Threat of Substitutes
- 4.1.5. Competitive Rivalry
- 4.2. PESTEL analysis
- 4.3. BCG Analysis
- 4.3.1. Stars (High Growth, High Market Share)
- 4.3.2. Cash Cows (Low Growth, High Market Share)
- 4.3.3. Question Mark (High Growth, Low Market Share)
- 4.3.4. Dogs (Low Growth, Low Market Share)
- 4.4. Ansoff Matrix Analysis
- 4.5. Supply Chain Analysis
- 4.6. Regulatory Landscape
- 4.7. Current Market Potential and Opportunity Assessment (TAM–SAM–SOM Framework)
- 4.8. MDP Analyst Note
- 4.1. Porters Five Forces
- 5. Market Analysis, Insights and Forecast 2021-2033
- 5.1. Market Analysis, Insights and Forecast - by Application
- 5.1.1. Pain Control
- 5.1.2. Edema
- 5.1.3. Lymphedema
- 5.1.4. Others
- 5.2. Market Analysis, Insights and Forecast - by Types
- 5.2.1. Pneumatic Compression Pumps
- 5.2.2. DVT Prevention System
- 5.2.3. Others
- 5.3. Market Analysis, Insights and Forecast - by Region
- 5.3.1. North America
- 5.3.2. South America
- 5.3.3. Europe
- 5.3.4. Middle East & Africa
- 5.3.5. Asia Pacific
- 5.1. Market Analysis, Insights and Forecast - by Application
- 6. Global Vascular Compression Devices Analysis, Insights and Forecast, 2021-2033
- 6.1. Market Analysis, Insights and Forecast - by Application
- 6.1.1. Pain Control
- 6.1.2. Edema
- 6.1.3. Lymphedema
- 6.1.4. Others
- 6.2. Market Analysis, Insights and Forecast - by Types
- 6.2.1. Pneumatic Compression Pumps
- 6.2.2. DVT Prevention System
- 6.2.3. Others
- 6.1. Market Analysis, Insights and Forecast - by Application
- 7. North America Vascular Compression Devices Analysis, Insights and Forecast, 2020-2032
- 7.1. Market Analysis, Insights and Forecast - by Application
- 7.1.1. Pain Control
- 7.1.2. Edema
- 7.1.3. Lymphedema
- 7.1.4. Others
- 7.2. Market Analysis, Insights and Forecast - by Types
- 7.2.1. Pneumatic Compression Pumps
- 7.2.2. DVT Prevention System
- 7.2.3. Others
- 7.1. Market Analysis, Insights and Forecast - by Application
- 8. South America Vascular Compression Devices Analysis, Insights and Forecast, 2020-2032
- 8.1. Market Analysis, Insights and Forecast - by Application
- 8.1.1. Pain Control
- 8.1.2. Edema
- 8.1.3. Lymphedema
- 8.1.4. Others
- 8.2. Market Analysis, Insights and Forecast - by Types
- 8.2.1. Pneumatic Compression Pumps
- 8.2.2. DVT Prevention System
- 8.2.3. Others
- 8.1. Market Analysis, Insights and Forecast - by Application
- 9. Europe Vascular Compression Devices Analysis, Insights and Forecast, 2020-2032
- 9.1. Market Analysis, Insights and Forecast - by Application
- 9.1.1. Pain Control
- 9.1.2. Edema
- 9.1.3. Lymphedema
- 9.1.4. Others
- 9.2. Market Analysis, Insights and Forecast - by Types
- 9.2.1. Pneumatic Compression Pumps
- 9.2.2. DVT Prevention System
- 9.2.3. Others
- 9.1. Market Analysis, Insights and Forecast - by Application
- 10. Middle East & Africa Vascular Compression Devices Analysis, Insights and Forecast, 2020-2032
- 10.1. Market Analysis, Insights and Forecast - by Application
- 10.1.1. Pain Control
- 10.1.2. Edema
- 10.1.3. Lymphedema
- 10.1.4. Others
- 10.2. Market Analysis, Insights and Forecast - by Types
- 10.2.1. Pneumatic Compression Pumps
- 10.2.2. DVT Prevention System
- 10.2.3. Others
- 10.1. Market Analysis, Insights and Forecast - by Application
- 11. Asia Pacific Vascular Compression Devices Analysis, Insights and Forecast, 2020-2032
- 11.1. Market Analysis, Insights and Forecast - by Application
- 11.1.1. Pain Control
- 11.1.2. Edema
- 11.1.3. Lymphedema
- 11.1.4. Others
- 11.2. Market Analysis, Insights and Forecast - by Types
- 11.2.1. Pneumatic Compression Pumps
- 11.2.2. DVT Prevention System
- 11.2.3. Others
- 11.1. Market Analysis, Insights and Forecast - by Application
- 12. Competitive Analysis
- 12.1. Company Profiles
- 12.1.1 Medtronic
- 12.1.1.1. Company Overview
- 12.1.1.2. Products
- 12.1.1.3. Company Financials
- 12.1.1.4. SWOT Analysis
- 12.1.2 Merit Medical
- 12.1.2.1. Company Overview
- 12.1.2.2. Products
- 12.1.2.3. Company Financials
- 12.1.2.4. SWOT Analysis
- 12.1.3 Perouse Medical
- 12.1.3.1. Company Overview
- 12.1.3.2. Products
- 12.1.3.3. Company Financials
- 12.1.3.4. SWOT Analysis
- 12.1.4 Medas Inc
- 12.1.4.1. Company Overview
- 12.1.4.2. Products
- 12.1.4.3. Company Financials
- 12.1.4.4. SWOT Analysis
- 12.1.5 Terumo Medical
- 12.1.5.1. Company Overview
- 12.1.5.2. Products
- 12.1.5.3. Company Financials
- 12.1.5.4. SWOT Analysis
- 12.1.6 Trutech Medical
- 12.1.6.1. Company Overview
- 12.1.6.2. Products
- 12.1.6.3. Company Financials
- 12.1.6.4. SWOT Analysis
- 12.1.1 Medtronic
- 12.2. Market Entropy
- 12.2.1 Company's Key Areas Served
- 12.2.2 Recent Developments
- 12.3. Company Market Share Analysis 2025
- 12.3.1 Top 5 Companies Market Share Analysis
- 12.3.2 Top 3 Companies Market Share Analysis
- 12.4. List of Potential Customers
- 13. Research Methodology
List of Figures
- Figure 1: Global Vascular Compression Devices Revenue Breakdown (undefined, %) by Region 2025 & 2033
- Figure 2: North America Vascular Compression Devices Revenue (undefined), by Application 2025 & 2033
- Figure 3: North America Vascular Compression Devices Revenue Share (%), by Application 2025 & 2033
- Figure 4: North America Vascular Compression Devices Revenue (undefined), by Types 2025 & 2033
- Figure 5: North America Vascular Compression Devices Revenue Share (%), by Types 2025 & 2033
- Figure 6: North America Vascular Compression Devices Revenue (undefined), by Country 2025 & 2033
- Figure 7: North America Vascular Compression Devices Revenue Share (%), by Country 2025 & 2033
- Figure 8: South America Vascular Compression Devices Revenue (undefined), by Application 2025 & 2033
- Figure 9: South America Vascular Compression Devices Revenue Share (%), by Application 2025 & 2033
- Figure 10: South America Vascular Compression Devices Revenue (undefined), by Types 2025 & 2033
- Figure 11: South America Vascular Compression Devices Revenue Share (%), by Types 2025 & 2033
- Figure 12: South America Vascular Compression Devices Revenue (undefined), by Country 2025 & 2033
- Figure 13: South America Vascular Compression Devices Revenue Share (%), by Country 2025 & 2033
- Figure 14: Europe Vascular Compression Devices Revenue (undefined), by Application 2025 & 2033
- Figure 15: Europe Vascular Compression Devices Revenue Share (%), by Application 2025 & 2033
- Figure 16: Europe Vascular Compression Devices Revenue (undefined), by Types 2025 & 2033
- Figure 17: Europe Vascular Compression Devices Revenue Share (%), by Types 2025 & 2033
- Figure 18: Europe Vascular Compression Devices Revenue (undefined), by Country 2025 & 2033
- Figure 19: Europe Vascular Compression Devices Revenue Share (%), by Country 2025 & 2033
- Figure 20: Middle East & Africa Vascular Compression Devices Revenue (undefined), by Application 2025 & 2033
- Figure 21: Middle East & Africa Vascular Compression Devices Revenue Share (%), by Application 2025 & 2033
- Figure 22: Middle East & Africa Vascular Compression Devices Revenue (undefined), by Types 2025 & 2033
- Figure 23: Middle East & Africa Vascular Compression Devices Revenue Share (%), by Types 2025 & 2033
- Figure 24: Middle East & Africa Vascular Compression Devices Revenue (undefined), by Country 2025 & 2033
- Figure 25: Middle East & Africa Vascular Compression Devices Revenue Share (%), by Country 2025 & 2033
- Figure 26: Asia Pacific Vascular Compression Devices Revenue (undefined), by Application 2025 & 2033
- Figure 27: Asia Pacific Vascular Compression Devices Revenue Share (%), by Application 2025 & 2033
- Figure 28: Asia Pacific Vascular Compression Devices Revenue (undefined), by Types 2025 & 2033
- Figure 29: Asia Pacific Vascular Compression Devices Revenue Share (%), by Types 2025 & 2033
- Figure 30: Asia Pacific Vascular Compression Devices Revenue (undefined), by Country 2025 & 2033
- Figure 31: Asia Pacific Vascular Compression Devices Revenue Share (%), by Country 2025 & 2033
List of Tables
- Table 1: Global Vascular Compression Devices Revenue undefined Forecast, by Application 2020 & 2033
- Table 2: Global Vascular Compression Devices Revenue undefined Forecast, by Types 2020 & 2033
- Table 3: Global Vascular Compression Devices Revenue undefined Forecast, by Region 2020 & 2033
- Table 4: Global Vascular Compression Devices Revenue undefined Forecast, by Application 2020 & 2033
- Table 5: Global Vascular Compression Devices Revenue undefined Forecast, by Types 2020 & 2033
- Table 6: Global Vascular Compression Devices Revenue undefined Forecast, by Country 2020 & 2033
- Table 7: United States Vascular Compression Devices Revenue (undefined) Forecast, by Application 2020 & 2033
- Table 8: Canada Vascular Compression Devices Revenue (undefined) Forecast, by Application 2020 & 2033
- Table 9: Mexico Vascular Compression Devices Revenue (undefined) Forecast, by Application 2020 & 2033
- Table 10: Global Vascular Compression Devices Revenue undefined Forecast, by Application 2020 & 2033
- Table 11: Global Vascular Compression Devices Revenue undefined Forecast, by Types 2020 & 2033
- Table 12: Global Vascular Compression Devices Revenue undefined Forecast, by Country 2020 & 2033
- Table 13: Brazil Vascular Compression Devices Revenue (undefined) Forecast, by Application 2020 & 2033
- Table 14: Argentina Vascular Compression Devices Revenue (undefined) Forecast, by Application 2020 & 2033
- Table 15: Rest of South America Vascular Compression Devices Revenue (undefined) Forecast, by Application 2020 & 2033
- Table 16: Global Vascular Compression Devices Revenue undefined Forecast, by Application 2020 & 2033
- Table 17: Global Vascular Compression Devices Revenue undefined Forecast, by Types 2020 & 2033
- Table 18: Global Vascular Compression Devices Revenue undefined Forecast, by Country 2020 & 2033
- Table 19: United Kingdom Vascular Compression Devices Revenue (undefined) Forecast, by Application 2020 & 2033
- Table 20: Germany Vascular Compression Devices Revenue (undefined) Forecast, by Application 2020 & 2033
- Table 21: France Vascular Compression Devices Revenue (undefined) Forecast, by Application 2020 & 2033
- Table 22: Italy Vascular Compression Devices Revenue (undefined) Forecast, by Application 2020 & 2033
- Table 23: Spain Vascular Compression Devices Revenue (undefined) Forecast, by Application 2020 & 2033
- Table 24: Russia Vascular Compression Devices Revenue (undefined) Forecast, by Application 2020 & 2033
- Table 25: Benelux Vascular Compression Devices Revenue (undefined) Forecast, by Application 2020 & 2033
- Table 26: Nordics Vascular Compression Devices Revenue (undefined) Forecast, by Application 2020 & 2033
- Table 27: Rest of Europe Vascular Compression Devices Revenue (undefined) Forecast, by Application 2020 & 2033
- Table 28: Global Vascular Compression Devices Revenue undefined Forecast, by Application 2020 & 2033
- Table 29: Global Vascular Compression Devices Revenue undefined Forecast, by Types 2020 & 2033
- Table 30: Global Vascular Compression Devices Revenue undefined Forecast, by Country 2020 & 2033
- Table 31: Turkey Vascular Compression Devices Revenue (undefined) Forecast, by Application 2020 & 2033
- Table 32: Israel Vascular Compression Devices Revenue (undefined) Forecast, by Application 2020 & 2033
- Table 33: GCC Vascular Compression Devices Revenue (undefined) Forecast, by Application 2020 & 2033
- Table 34: North Africa Vascular Compression Devices Revenue (undefined) Forecast, by Application 2020 & 2033
- Table 35: South Africa Vascular Compression Devices Revenue (undefined) Forecast, by Application 2020 & 2033
- Table 36: Rest of Middle East & Africa Vascular Compression Devices Revenue (undefined) Forecast, by Application 2020 & 2033
- Table 37: Global Vascular Compression Devices Revenue undefined Forecast, by Application 2020 & 2033
- Table 38: Global Vascular Compression Devices Revenue undefined Forecast, by Types 2020 & 2033
- Table 39: Global Vascular Compression Devices Revenue undefined Forecast, by Country 2020 & 2033
- Table 40: China Vascular Compression Devices Revenue (undefined) Forecast, by Application 2020 & 2033
- Table 41: India Vascular Compression Devices Revenue (undefined) Forecast, by Application 2020 & 2033
- Table 42: Japan Vascular Compression Devices Revenue (undefined) Forecast, by Application 2020 & 2033
- Table 43: South Korea Vascular Compression Devices Revenue (undefined) Forecast, by Application 2020 & 2033
- Table 44: ASEAN Vascular Compression Devices Revenue (undefined) Forecast, by Application 2020 & 2033
- Table 45: Oceania Vascular Compression Devices Revenue (undefined) Forecast, by Application 2020 & 2033
- Table 46: Rest of Asia Pacific Vascular Compression Devices Revenue (undefined) Forecast, by Application 2020 & 2033
Frequently Asked Questions
1. What is the projected Compound Annual Growth Rate (CAGR) of the Vascular Compression Devices?
The projected CAGR is approximately 5.7%.
2. Which companies are prominent players in the Vascular Compression Devices?
Key companies in the market include Medtronic, Merit Medical, Perouse Medical, Medas Inc, Terumo Medical, Trutech Medical.
3. What are the main segments of the Vascular Compression Devices?
The market segments include Application, Types.
4. Can you provide details about the market size?
The market size is estimated to be USD XXX N/A as of 2022.
5. What are some drivers contributing to market growth?
N/A
6. What are the notable trends driving market growth?
N/A
7. Are there any restraints impacting market growth?
N/A
8. Can you provide examples of recent developments in the market?
N/A
9. What pricing options are available for accessing the report?
Pricing options include single-user, multi-user, and enterprise licenses priced at USD 2900.00, USD 4350.00, and USD 5800.00 respectively.
10. Is the market size provided in terms of value or volume?
The market size is provided in terms of value, measured in N/A.
11. Are there any specific market keywords associated with the report?
Yes, the market keyword associated with the report is "Vascular Compression Devices," which aids in identifying and referencing the specific market segment covered.
12. How do I determine which pricing option suits my needs best?
The pricing options vary based on user requirements and access needs. Individual users may opt for single-user licenses, while businesses requiring broader access may choose multi-user or enterprise licenses for cost-effective access to the report.
13. Are there any additional resources or data provided in the Vascular Compression Devices report?
While the report offers comprehensive insights, it's advisable to review the specific contents or supplementary materials provided to ascertain if additional resources or data are available.
14. How can I stay updated on further developments or reports in the Vascular Compression Devices?
To stay informed about further developments, trends, and reports in the Vascular Compression Devices, consider subscribing to industry newsletters, following relevant companies and organizations, or regularly checking reputable industry news sources and publications.
Methodology
Step 1 - Identification of Relevant Samples Size from Population Database


Step 2 - Approaches for Defining Global Market Size (Value, Volume* & Price*)

Note*: In applicable scenarios
Step 3 - Data Sources
Primary Research
- Web Analytics
- Survey Reports
- Research Institute
- Latest Research Reports
- Opinion Leaders
Secondary Research
- Annual Reports
- White Paper
- Latest Press Release
- Industry Association
- Paid Database
- Investor Presentations

Step 4 - Data Triangulation
Involves using different sources of information in order to increase the validity of a study
These sources are likely to be stakeholders in a program - participants, other researchers, program staff, other community members, and so on.
Then we put all data in single framework & apply various statistical tools to find out the dynamic on the market.
During the analysis stage, feedback from the stakeholder groups would be compared to determine areas of agreement as well as areas of divergence