

Key Insights
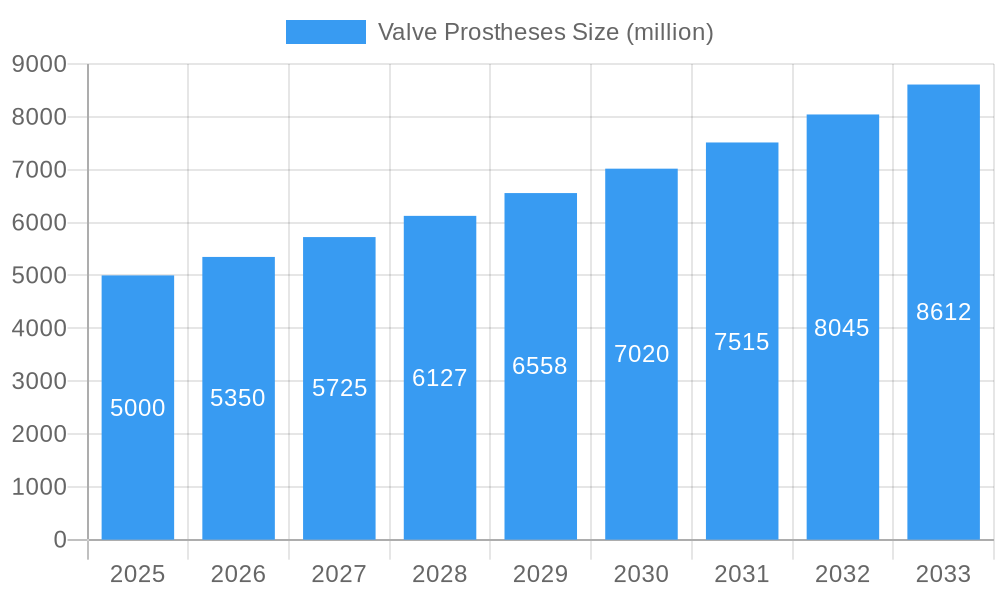
The global valve prostheses market is experiencing robust growth, driven by an aging population, increasing prevalence of cardiovascular diseases, and advancements in minimally invasive surgical techniques. The market, estimated at $5 billion in 2025, is projected to exhibit a compound annual growth rate (CAGR) of approximately 7% from 2025 to 2033, reaching a value exceeding $9 billion by 2033. Key drivers include rising healthcare expenditure in developing nations, technological innovations leading to improved device durability and efficacy (e.g., bioprosthetic valves with enhanced longevity), and a growing preference for transcatheter aortic valve replacement (TAVR) procedures due to their minimally invasive nature and shorter recovery times. Significant market players like Medtronic, On-X Life Technologies, and Lepu Medical Technology (having acquired Comed) are actively engaged in R&D and strategic acquisitions to expand their market share. However, the market faces restraints such as high procedure costs, potential complications associated with valve replacement surgeries, and the need for rigorous post-operative care. Market segmentation includes various valve types (e.g., aortic, mitral, tricuspid), materials (e.g., bioprosthetic, mechanical), and delivery methods (surgical vs. transcatheter). Regional variations in market growth are expected, with North America and Europe currently dominating, while Asia-Pacific is projected to witness significant expansion driven by increasing healthcare infrastructure development and rising disposable incomes.
Valve Prostheses Market Size (In Billion)
The competitive landscape is characterized by a mix of established players and emerging companies vying for market leadership through product innovation and strategic partnerships. Companies are focusing on developing next-generation valves with improved hemodynamics, reduced thrombosis risk, and enhanced patient outcomes. The ongoing development and adoption of less invasive procedures and improved imaging technologies further fuels market growth. Furthermore, increasing awareness campaigns about cardiovascular diseases and the availability of advanced diagnostic tools contribute to earlier detection and treatment, thus positively impacting the demand for valve prostheses. Despite the challenges, the long-term outlook for the valve prostheses market remains positive, driven by consistent technological advancements, an expanding patient population, and the growing preference for minimally invasive procedures.
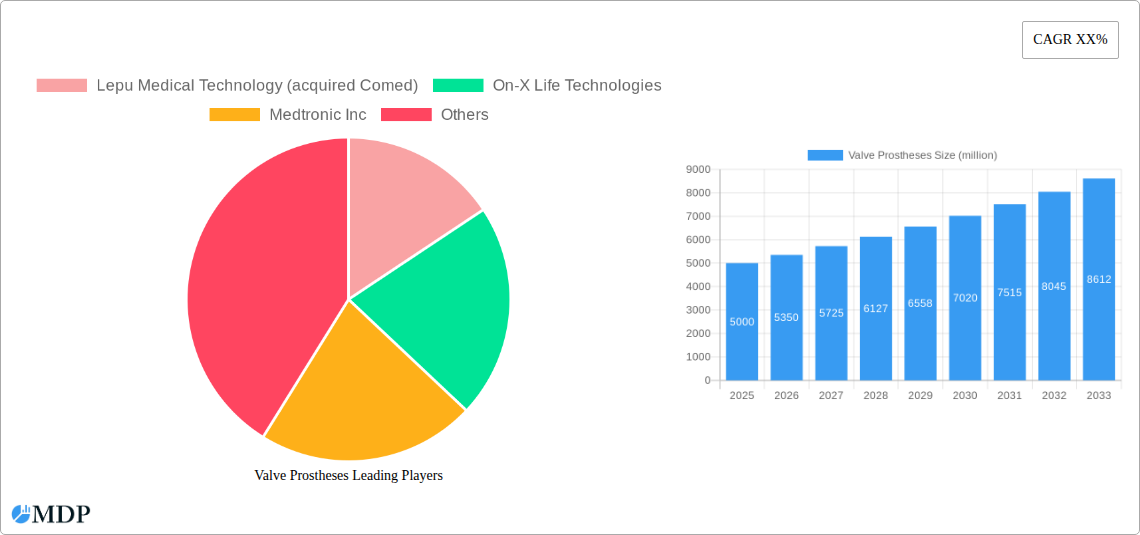
Valve Prostheses Company Market Share
Valve Prostheses Market Report: 2019-2033 - A Comprehensive Analysis
This comprehensive report provides an in-depth analysis of the global valve prostheses market, offering invaluable insights for stakeholders across the medical device industry. Covering the period from 2019 to 2033, with a focus on 2025, this report meticulously examines market dynamics, leading players, and future growth opportunities. Projected to reach xx million by 2033, the market presents significant potential for investment and expansion. This report leverages detailed data analysis and expert insights to provide actionable strategies for success in this dynamic sector.
Valve Prostheses Market Dynamics & Concentration
The global valve prostheses market is characterized by moderate concentration, with key players like Medtronic Inc, On-X Life Technologies, and Lepu Medical Technology (which acquired Comed) holding significant market share. The market share of these top three companies is estimated at xx% in 2025. Innovation is a key driver, fueled by advancements in biomaterials, minimally invasive surgical techniques, and transcatheter technologies. Stringent regulatory frameworks, particularly from the FDA and EMA, shape product development and market access. The existence of surgical and transcatheter alternatives contributes to competitive dynamics. End-user trends show a preference for less invasive procedures and improved long-term outcomes. M&A activity in the sector has been moderate over the past five years, with an estimated xx major deals completed during the historical period (2019-2024). This consolidation trend is expected to continue, driving further market concentration.
- Market Concentration: Moderately concentrated, with top three players holding xx% market share in 2025.
- Innovation Drivers: Biomaterials, minimally invasive surgery, transcatheter technologies.
- Regulatory Frameworks: Stringent FDA and EMA regulations.
- Product Substitutes: Surgical and transcatheter alternatives.
- End-User Trends: Preference for minimally invasive procedures and improved outcomes.
- M&A Activity: Approximately xx major deals (2019-2024).
Valve Prostheses Industry Trends & Analysis
The global valve prostheses market is experiencing robust growth, driven by the rising prevalence of cardiovascular diseases, an aging population, and increasing healthcare expenditure globally. The market is projected to witness a Compound Annual Growth Rate (CAGR) of xx% during the forecast period (2025-2033). Technological advancements such as the development of biocompatible materials, improved valve designs, and minimally invasive surgical techniques are significantly contributing to market expansion. Consumer preferences are shifting towards less invasive procedures with shorter recovery times and improved patient outcomes. The competitive landscape is dynamic, with established players and emerging companies vying for market share through innovation, strategic partnerships, and acquisitions. Market penetration for transcatheter aortic valve replacement (TAVR) procedures is steadily increasing, further fueling market growth.
Leading Markets & Segments in Valve Prostheses
North America currently dominates the valve prostheses market, accounting for approximately xx% of the global revenue in 2025. This dominance is primarily attributed to factors such as high healthcare expenditure, advanced healthcare infrastructure, and a high prevalence of cardiovascular diseases.
- Key Drivers in North America:
- High healthcare expenditure.
- Advanced medical infrastructure.
- High prevalence of cardiovascular diseases.
- Strong regulatory support for new technologies.
Europe holds a significant share, though slightly lower than North America. The Asia-Pacific region is projected to witness the fastest growth rate during the forecast period, fueled by rising disposable incomes, increasing healthcare awareness, and expanding healthcare infrastructure. The aortic valve segment holds the largest share within the overall valve prostheses market, owing to its higher incidence rate compared to other valvular heart diseases.
Valve Prostheses Product Developments
Recent product innovations focus on enhancing durability, reducing thrombosis risk, and improving patient outcomes. The development of biocompatible materials, such as polymers and novel alloys, and improved valve designs is crucial. Transcatheter valve technologies continue to advance, offering less invasive treatment options. The emphasis on minimizing post-operative complications and improving long-term device performance defines the competitive landscape. This focus on patient-centric innovation drives market growth.
Key Drivers of Valve Prostheses Growth
Several factors drive the growth of the valve prostheses market. The increasing prevalence of cardiovascular diseases, particularly among the aging population, represents a major driver. Technological advancements in minimally invasive procedures and biocompatible materials continue to enhance treatment options, stimulating market expansion. Favorable reimbursement policies and rising healthcare expenditure in developed and developing economies also contribute significantly.
Challenges in the Valve Prostheses Market
The market faces challenges, including high device costs, stringent regulatory requirements leading to lengthy approval processes, and potential supply chain disruptions. The intense competition among established players and emerging companies also presents significant challenges. The potential for adverse events and product recalls can impact market confidence and adoption rates, imposing financial and reputational risks on manufacturers. These factors can impact market growth and profitability.
Emerging Opportunities in Valve Prostheses
The valve prostheses market presents several emerging opportunities. Advancements in biomaterials, particularly in the development of bio-engineered valves, are creating promising new therapeutic modalities. Strategic partnerships between device manufacturers, hospitals, and research institutions are paving the way for accelerated innovation and market penetration. Expansion into untapped markets, particularly in developing countries with increasing cardiovascular disease burdens, offers significant growth potential.
Leading Players in the Valve Prostheses Sector
- Lepu Medical Technology (acquired Comed)
- On-X Life Technologies
- Medtronic Inc
Key Milestones in Valve Prostheses Industry
- 2020: FDA approval of a novel transcatheter aortic valve.
- 2022: Launch of a new generation bioprosthetic heart valve with improved durability.
- 2023: Major acquisition of a smaller valve prostheses company by a leading player.
- 2024: Publication of landmark clinical trial data demonstrating improved outcomes with a new valve design.
Strategic Outlook for Valve Prostheses Market
The valve prostheses market is poised for continued growth driven by technological innovation, expanding treatment access, and a growing aging population. Strategic partnerships, geographic expansion into emerging markets, and a focus on developing less invasive, patient-centric technologies will be crucial for success. Companies focusing on improved patient outcomes, cost-effectiveness, and streamlined regulatory pathways will be well-positioned for market leadership in the coming years.
Valve Prostheses Segmentation
-
1. Application
- 1.1. Aortic
- 1.2. Mitral
-
2. Types
- 2.1. Mechanical Type
- 2.2. Biological Type
Valve Prostheses Segmentation By Geography
-
1. North America
- 1.1. United States
- 1.2. Canada
- 1.3. Mexico
-
2. South America
- 2.1. Brazil
- 2.2. Argentina
- 2.3. Rest of South America
-
3. Europe
- 3.1. United Kingdom
- 3.2. Germany
- 3.3. France
- 3.4. Italy
- 3.5. Spain
- 3.6. Russia
- 3.7. Benelux
- 3.8. Nordics
- 3.9. Rest of Europe
-
4. Middle East & Africa
- 4.1. Turkey
- 4.2. Israel
- 4.3. GCC
- 4.4. North Africa
- 4.5. South Africa
- 4.6. Rest of Middle East & Africa
-
5. Asia Pacific
- 5.1. China
- 5.2. India
- 5.3. Japan
- 5.4. South Korea
- 5.5. ASEAN
- 5.6. Oceania
- 5.7. Rest of Asia Pacific
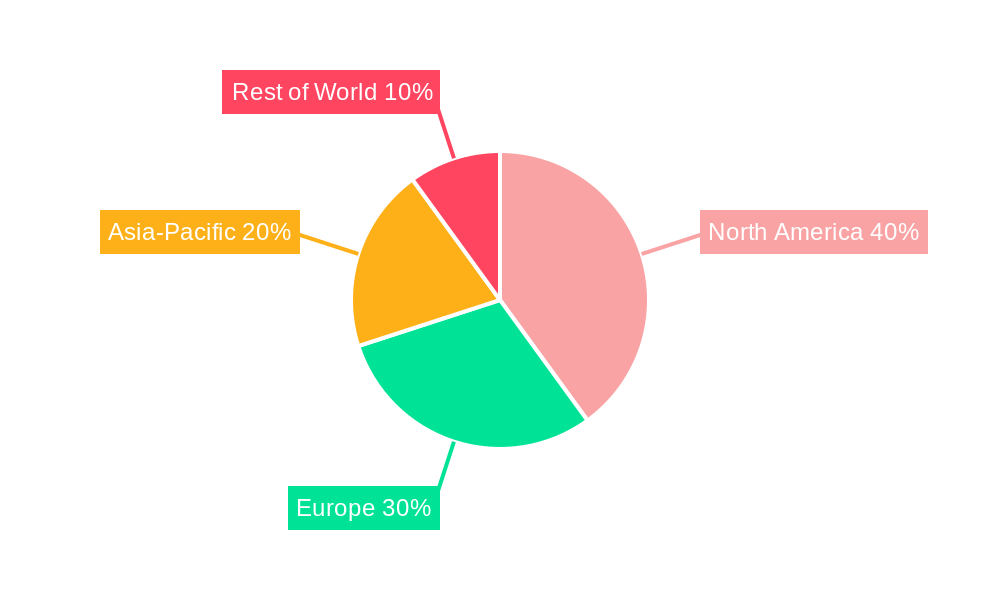
Valve Prostheses Regional Market Share
Geographic Coverage of Valve Prostheses
Valve Prostheses REPORT HIGHLIGHTS
| Aspects | Details |
|---|---|
| Study Period | 2020-2034 |
| Base Year | 2025 |
| Estimated Year | 2026 |
| Forecast Period | 2026-2034 |
| Historical Period | 2020-2025 |
| Growth Rate | CAGR of XX% from 2020-2034 |
| Segmentation |
|
Table of Contents
- 1. Introduction
- 1.1. Research Scope
- 1.2. Market Segmentation
- 1.3. Research Objective
- 1.4. Definitions and Assumptions
- 2. Executive Summary
- 2.1. Market Snapshot
- 3. Market Dynamics
- 3.1. Market Drivers
- 3.2. Market Restrains
- 3.3. Market Trends
- 3.4. Market Opportunities
- 4. Market Factor Analysis
- 4.1. Porters Five Forces
- 4.1.1. Bargaining Power of Suppliers
- 4.1.2. Bargaining Power of Buyers
- 4.1.3. Threat of New Entrants
- 4.1.4. Threat of Substitutes
- 4.1.5. Competitive Rivalry
- 4.2. PESTEL analysis
- 4.3. BCG Analysis
- 4.3.1. Stars (High Growth, High Market Share)
- 4.3.2. Cash Cows (Low Growth, High Market Share)
- 4.3.3. Question Mark (High Growth, Low Market Share)
- 4.3.4. Dogs (Low Growth, Low Market Share)
- 4.4. Ansoff Matrix Analysis
- 4.5. Supply Chain Analysis
- 4.6. Regulatory Landscape
- 4.7. Current Market Potential and Opportunity Assessment (TAM–SAM–SOM Framework)
- 4.8. MDP Analyst Note
- 4.1. Porters Five Forces
- 5. Market Analysis, Insights and Forecast 2021-2033
- 5.1. Market Analysis, Insights and Forecast - by Application
- 5.1.1. Aortic
- 5.1.2. Mitral
- 5.2. Market Analysis, Insights and Forecast - by Types
- 5.2.1. Mechanical Type
- 5.2.2. Biological Type
- 5.3. Market Analysis, Insights and Forecast - by Region
- 5.3.1. North America
- 5.3.2. South America
- 5.3.3. Europe
- 5.3.4. Middle East & Africa
- 5.3.5. Asia Pacific
- 5.1. Market Analysis, Insights and Forecast - by Application
- 6. Global Valve Prostheses Analysis, Insights and Forecast, 2021-2033
- 6.1. Market Analysis, Insights and Forecast - by Application
- 6.1.1. Aortic
- 6.1.2. Mitral
- 6.2. Market Analysis, Insights and Forecast - by Types
- 6.2.1. Mechanical Type
- 6.2.2. Biological Type
- 6.1. Market Analysis, Insights and Forecast - by Application
- 7. North America Valve Prostheses Analysis, Insights and Forecast, 2020-2032
- 7.1. Market Analysis, Insights and Forecast - by Application
- 7.1.1. Aortic
- 7.1.2. Mitral
- 7.2. Market Analysis, Insights and Forecast - by Types
- 7.2.1. Mechanical Type
- 7.2.2. Biological Type
- 7.1. Market Analysis, Insights and Forecast - by Application
- 8. South America Valve Prostheses Analysis, Insights and Forecast, 2020-2032
- 8.1. Market Analysis, Insights and Forecast - by Application
- 8.1.1. Aortic
- 8.1.2. Mitral
- 8.2. Market Analysis, Insights and Forecast - by Types
- 8.2.1. Mechanical Type
- 8.2.2. Biological Type
- 8.1. Market Analysis, Insights and Forecast - by Application
- 9. Europe Valve Prostheses Analysis, Insights and Forecast, 2020-2032
- 9.1. Market Analysis, Insights and Forecast - by Application
- 9.1.1. Aortic
- 9.1.2. Mitral
- 9.2. Market Analysis, Insights and Forecast - by Types
- 9.2.1. Mechanical Type
- 9.2.2. Biological Type
- 9.1. Market Analysis, Insights and Forecast - by Application
- 10. Middle East & Africa Valve Prostheses Analysis, Insights and Forecast, 2020-2032
- 10.1. Market Analysis, Insights and Forecast - by Application
- 10.1.1. Aortic
- 10.1.2. Mitral
- 10.2. Market Analysis, Insights and Forecast - by Types
- 10.2.1. Mechanical Type
- 10.2.2. Biological Type
- 10.1. Market Analysis, Insights and Forecast - by Application
- 11. Asia Pacific Valve Prostheses Analysis, Insights and Forecast, 2020-2032
- 11.1. Market Analysis, Insights and Forecast - by Application
- 11.1.1. Aortic
- 11.1.2. Mitral
- 11.2. Market Analysis, Insights and Forecast - by Types
- 11.2.1. Mechanical Type
- 11.2.2. Biological Type
- 11.1. Market Analysis, Insights and Forecast - by Application
- 12. Competitive Analysis
- 12.1. Company Profiles
- 12.1.1 Lepu Medical Technology (acquired Comed)
- 12.1.1.1. Company Overview
- 12.1.1.2. Products
- 12.1.1.3. Company Financials
- 12.1.1.4. SWOT Analysis
- 12.1.2 On-X Life Technologies
- 12.1.2.1. Company Overview
- 12.1.2.2. Products
- 12.1.2.3. Company Financials
- 12.1.2.4. SWOT Analysis
- 12.1.3 Medtronic Inc
- 12.1.3.1. Company Overview
- 12.1.3.2. Products
- 12.1.3.3. Company Financials
- 12.1.3.4. SWOT Analysis
- 12.1.1 Lepu Medical Technology (acquired Comed)
- 12.2. Market Entropy
- 12.2.1 Company's Key Areas Served
- 12.2.2 Recent Developments
- 12.3. Company Market Share Analysis 2025
- 12.3.1 Top 5 Companies Market Share Analysis
- 12.3.2 Top 3 Companies Market Share Analysis
- 12.4. List of Potential Customers
- 13. Research Methodology
List of Figures
- Figure 1: Global Valve Prostheses Revenue Breakdown (million, %) by Region 2025 & 2033
- Figure 2: North America Valve Prostheses Revenue (million), by Application 2025 & 2033
- Figure 3: North America Valve Prostheses Revenue Share (%), by Application 2025 & 2033
- Figure 4: North America Valve Prostheses Revenue (million), by Types 2025 & 2033
- Figure 5: North America Valve Prostheses Revenue Share (%), by Types 2025 & 2033
- Figure 6: North America Valve Prostheses Revenue (million), by Country 2025 & 2033
- Figure 7: North America Valve Prostheses Revenue Share (%), by Country 2025 & 2033
- Figure 8: South America Valve Prostheses Revenue (million), by Application 2025 & 2033
- Figure 9: South America Valve Prostheses Revenue Share (%), by Application 2025 & 2033
- Figure 10: South America Valve Prostheses Revenue (million), by Types 2025 & 2033
- Figure 11: South America Valve Prostheses Revenue Share (%), by Types 2025 & 2033
- Figure 12: South America Valve Prostheses Revenue (million), by Country 2025 & 2033
- Figure 13: South America Valve Prostheses Revenue Share (%), by Country 2025 & 2033
- Figure 14: Europe Valve Prostheses Revenue (million), by Application 2025 & 2033
- Figure 15: Europe Valve Prostheses Revenue Share (%), by Application 2025 & 2033
- Figure 16: Europe Valve Prostheses Revenue (million), by Types 2025 & 2033
- Figure 17: Europe Valve Prostheses Revenue Share (%), by Types 2025 & 2033
- Figure 18: Europe Valve Prostheses Revenue (million), by Country 2025 & 2033
- Figure 19: Europe Valve Prostheses Revenue Share (%), by Country 2025 & 2033
- Figure 20: Middle East & Africa Valve Prostheses Revenue (million), by Application 2025 & 2033
- Figure 21: Middle East & Africa Valve Prostheses Revenue Share (%), by Application 2025 & 2033
- Figure 22: Middle East & Africa Valve Prostheses Revenue (million), by Types 2025 & 2033
- Figure 23: Middle East & Africa Valve Prostheses Revenue Share (%), by Types 2025 & 2033
- Figure 24: Middle East & Africa Valve Prostheses Revenue (million), by Country 2025 & 2033
- Figure 25: Middle East & Africa Valve Prostheses Revenue Share (%), by Country 2025 & 2033
- Figure 26: Asia Pacific Valve Prostheses Revenue (million), by Application 2025 & 2033
- Figure 27: Asia Pacific Valve Prostheses Revenue Share (%), by Application 2025 & 2033
- Figure 28: Asia Pacific Valve Prostheses Revenue (million), by Types 2025 & 2033
- Figure 29: Asia Pacific Valve Prostheses Revenue Share (%), by Types 2025 & 2033
- Figure 30: Asia Pacific Valve Prostheses Revenue (million), by Country 2025 & 2033
- Figure 31: Asia Pacific Valve Prostheses Revenue Share (%), by Country 2025 & 2033
List of Tables
- Table 1: Global Valve Prostheses Revenue million Forecast, by Application 2020 & 2033
- Table 2: Global Valve Prostheses Revenue million Forecast, by Types 2020 & 2033
- Table 3: Global Valve Prostheses Revenue million Forecast, by Region 2020 & 2033
- Table 4: Global Valve Prostheses Revenue million Forecast, by Application 2020 & 2033
- Table 5: Global Valve Prostheses Revenue million Forecast, by Types 2020 & 2033
- Table 6: Global Valve Prostheses Revenue million Forecast, by Country 2020 & 2033
- Table 7: United States Valve Prostheses Revenue (million) Forecast, by Application 2020 & 2033
- Table 8: Canada Valve Prostheses Revenue (million) Forecast, by Application 2020 & 2033
- Table 9: Mexico Valve Prostheses Revenue (million) Forecast, by Application 2020 & 2033
- Table 10: Global Valve Prostheses Revenue million Forecast, by Application 2020 & 2033
- Table 11: Global Valve Prostheses Revenue million Forecast, by Types 2020 & 2033
- Table 12: Global Valve Prostheses Revenue million Forecast, by Country 2020 & 2033
- Table 13: Brazil Valve Prostheses Revenue (million) Forecast, by Application 2020 & 2033
- Table 14: Argentina Valve Prostheses Revenue (million) Forecast, by Application 2020 & 2033
- Table 15: Rest of South America Valve Prostheses Revenue (million) Forecast, by Application 2020 & 2033
- Table 16: Global Valve Prostheses Revenue million Forecast, by Application 2020 & 2033
- Table 17: Global Valve Prostheses Revenue million Forecast, by Types 2020 & 2033
- Table 18: Global Valve Prostheses Revenue million Forecast, by Country 2020 & 2033
- Table 19: United Kingdom Valve Prostheses Revenue (million) Forecast, by Application 2020 & 2033
- Table 20: Germany Valve Prostheses Revenue (million) Forecast, by Application 2020 & 2033
- Table 21: France Valve Prostheses Revenue (million) Forecast, by Application 2020 & 2033
- Table 22: Italy Valve Prostheses Revenue (million) Forecast, by Application 2020 & 2033
- Table 23: Spain Valve Prostheses Revenue (million) Forecast, by Application 2020 & 2033
- Table 24: Russia Valve Prostheses Revenue (million) Forecast, by Application 2020 & 2033
- Table 25: Benelux Valve Prostheses Revenue (million) Forecast, by Application 2020 & 2033
- Table 26: Nordics Valve Prostheses Revenue (million) Forecast, by Application 2020 & 2033
- Table 27: Rest of Europe Valve Prostheses Revenue (million) Forecast, by Application 2020 & 2033
- Table 28: Global Valve Prostheses Revenue million Forecast, by Application 2020 & 2033
- Table 29: Global Valve Prostheses Revenue million Forecast, by Types 2020 & 2033
- Table 30: Global Valve Prostheses Revenue million Forecast, by Country 2020 & 2033
- Table 31: Turkey Valve Prostheses Revenue (million) Forecast, by Application 2020 & 2033
- Table 32: Israel Valve Prostheses Revenue (million) Forecast, by Application 2020 & 2033
- Table 33: GCC Valve Prostheses Revenue (million) Forecast, by Application 2020 & 2033
- Table 34: North Africa Valve Prostheses Revenue (million) Forecast, by Application 2020 & 2033
- Table 35: South Africa Valve Prostheses Revenue (million) Forecast, by Application 2020 & 2033
- Table 36: Rest of Middle East & Africa Valve Prostheses Revenue (million) Forecast, by Application 2020 & 2033
- Table 37: Global Valve Prostheses Revenue million Forecast, by Application 2020 & 2033
- Table 38: Global Valve Prostheses Revenue million Forecast, by Types 2020 & 2033
- Table 39: Global Valve Prostheses Revenue million Forecast, by Country 2020 & 2033
- Table 40: China Valve Prostheses Revenue (million) Forecast, by Application 2020 & 2033
- Table 41: India Valve Prostheses Revenue (million) Forecast, by Application 2020 & 2033
- Table 42: Japan Valve Prostheses Revenue (million) Forecast, by Application 2020 & 2033
- Table 43: South Korea Valve Prostheses Revenue (million) Forecast, by Application 2020 & 2033
- Table 44: ASEAN Valve Prostheses Revenue (million) Forecast, by Application 2020 & 2033
- Table 45: Oceania Valve Prostheses Revenue (million) Forecast, by Application 2020 & 2033
- Table 46: Rest of Asia Pacific Valve Prostheses Revenue (million) Forecast, by Application 2020 & 2033
Frequently Asked Questions
1. What is the projected Compound Annual Growth Rate (CAGR) of the Valve Prostheses?
The projected CAGR is approximately XX%.
2. Which companies are prominent players in the Valve Prostheses?
Key companies in the market include Lepu Medical Technology (acquired Comed), On-X Life Technologies, Medtronic Inc.
3. What are the main segments of the Valve Prostheses?
The market segments include Application, Types.
4. Can you provide details about the market size?
The market size is estimated to be USD XXX million as of 2022.
5. What are some drivers contributing to market growth?
N/A
6. What are the notable trends driving market growth?
N/A
7. Are there any restraints impacting market growth?
N/A
8. Can you provide examples of recent developments in the market?
N/A
9. What pricing options are available for accessing the report?
Pricing options include single-user, multi-user, and enterprise licenses priced at USD 2900.00, USD 4350.00, and USD 5800.00 respectively.
10. Is the market size provided in terms of value or volume?
The market size is provided in terms of value, measured in million.
11. Are there any specific market keywords associated with the report?
Yes, the market keyword associated with the report is "Valve Prostheses," which aids in identifying and referencing the specific market segment covered.
12. How do I determine which pricing option suits my needs best?
The pricing options vary based on user requirements and access needs. Individual users may opt for single-user licenses, while businesses requiring broader access may choose multi-user or enterprise licenses for cost-effective access to the report.
13. Are there any additional resources or data provided in the Valve Prostheses report?
While the report offers comprehensive insights, it's advisable to review the specific contents or supplementary materials provided to ascertain if additional resources or data are available.
14. How can I stay updated on further developments or reports in the Valve Prostheses?
To stay informed about further developments, trends, and reports in the Valve Prostheses, consider subscribing to industry newsletters, following relevant companies and organizations, or regularly checking reputable industry news sources and publications.
Methodology
Step 1 - Identification of Relevant Samples Size from Population Database


Step 2 - Approaches for Defining Global Market Size (Value, Volume* & Price*)

Note*: In applicable scenarios
Step 3 - Data Sources
Primary Research
- Web Analytics
- Survey Reports
- Research Institute
- Latest Research Reports
- Opinion Leaders
Secondary Research
- Annual Reports
- White Paper
- Latest Press Release
- Industry Association
- Paid Database
- Investor Presentations

Step 4 - Data Triangulation
Involves using different sources of information in order to increase the validity of a study
These sources are likely to be stakeholders in a program - participants, other researchers, program staff, other community members, and so on.
Then we put all data in single framework & apply various statistical tools to find out the dynamic on the market.
During the analysis stage, feedback from the stakeholder groups would be compared to determine areas of agreement as well as areas of divergence