

Key Insights
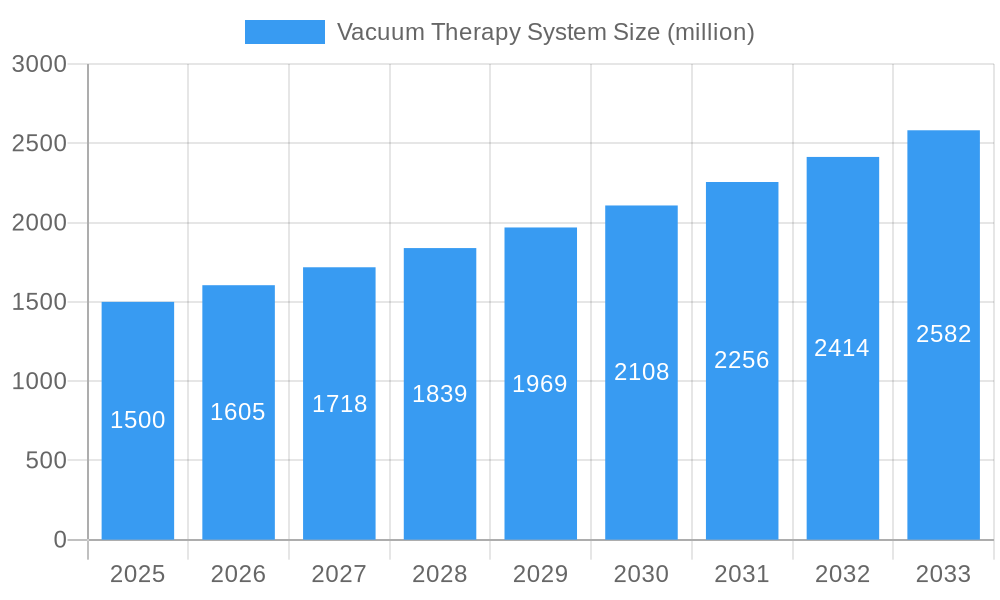
The global vacuum therapy system market is experiencing robust growth, driven by increasing prevalence of chronic wounds, rising geriatric population, and advancements in wound care technologies. The market, estimated at $1.5 billion in 2025, is projected to witness a compound annual growth rate (CAGR) of 7% from 2025 to 2033, reaching approximately $2.8 billion by 2033. This growth is fueled by several key factors. The aging population globally leads to increased incidence of chronic wounds requiring sophisticated treatment, making vacuum-assisted closure (VAC) therapy a critical component of wound management. Furthermore, technological advancements in VAC systems, such as improved portability, ease of use, and enhanced efficacy, are driving adoption among healthcare professionals. The market is segmented based on product type (e.g., disposable and reusable systems), application (e.g., diabetic foot ulcers, pressure ulcers), and end-user (hospitals, clinics, home care settings). Competition is intense, with key players like Enraf Nonius, Iskra Medical, DJO International, Acelity, Molnlycke Healthcare, Johnson & Johnson, Coloplast, Augustus Medical, and Boston Scientific vying for market share through product innovation and strategic partnerships. However, high initial costs associated with VAC therapy and the potential for complications can restrain market growth to some extent.
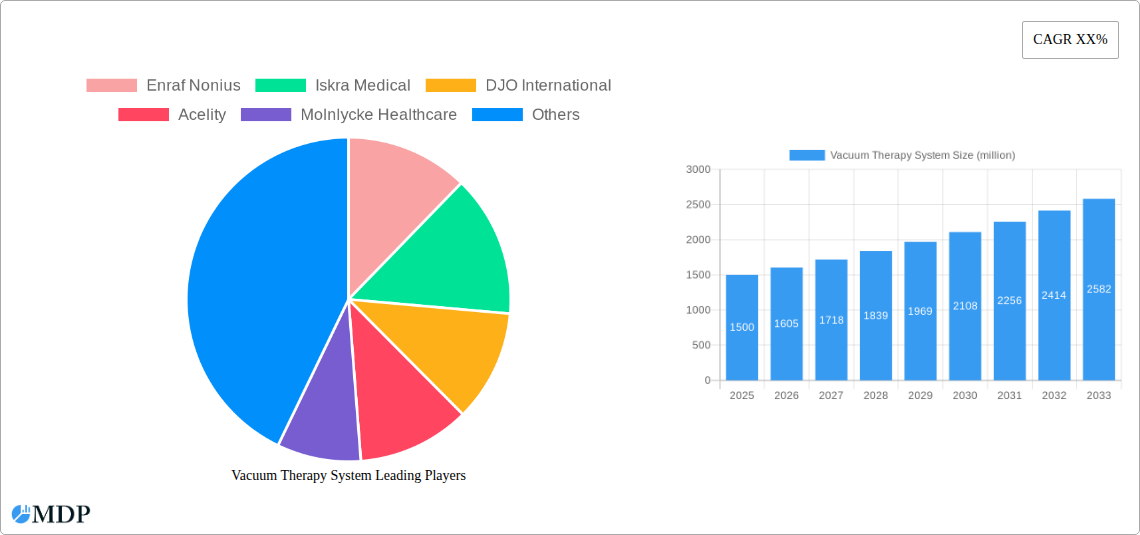
Vacuum Therapy System Market Size (In Billion)
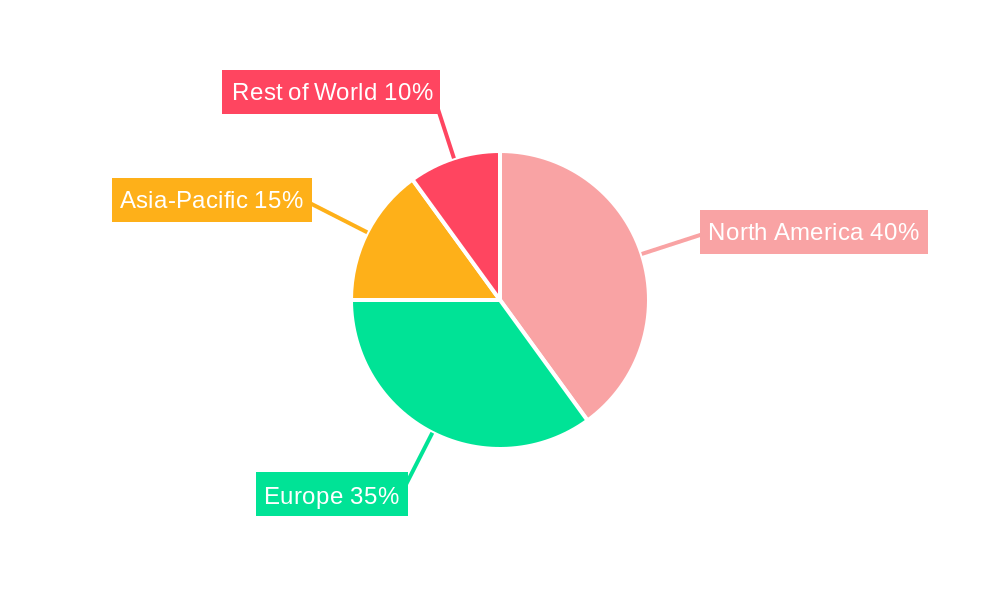
Despite these challenges, the market outlook remains positive due to ongoing research and development efforts focused on improving the safety and effectiveness of vacuum therapy. The increasing focus on value-based healthcare, coupled with the rising demand for efficient and cost-effective wound management solutions, is expected to create significant opportunities for market expansion. Regionally, North America and Europe currently hold a dominant share, but emerging economies in Asia-Pacific are exhibiting strong growth potential driven by increasing healthcare infrastructure development and growing awareness about advanced wound care options. The strategic collaborations and mergers among key players further consolidate the market and contribute to technological advancements. This dynamic landscape presents a significant opportunity for companies involved in developing and supplying innovative vacuum therapy systems.
Vacuum Therapy System Company Market Share
Vacuum Therapy System Market Report: A Comprehensive Analysis (2019-2033)
This in-depth report provides a comprehensive analysis of the global Vacuum Therapy System market, projecting a market value exceeding $XX million by 2033. The report covers the period from 2019 to 2033, with 2025 serving as the base and estimated year. It offers crucial insights for industry stakeholders, investors, and businesses seeking to navigate this dynamic market. The study meticulously examines market dynamics, industry trends, leading players, and future growth prospects.
Vacuum Therapy System Market Dynamics & Concentration
The global Vacuum Therapy System market, valued at $XX million in 2025, exhibits a moderately concentrated landscape. While a few major players such as Enraf Nonius, Iskra Medical, DJO International, Acelity, Molnlycke Healthcare, Johnson & Johnson, Coloplast, Augustus Medical, and Boston Scientific hold significant market share, numerous smaller companies contribute to the overall market size. Innovation, driven by advancements in materials science and miniaturization, is a key driver. Stringent regulatory frameworks, particularly concerning safety and efficacy, influence market growth. Substitutes, such as compression therapy, exist, but Vacuum Therapy Systems often offer superior outcomes for specific applications. End-user trends, including a rising preference for minimally invasive procedures and improved patient outcomes, fuel market expansion. The M&A activity in the sector has been moderate, with approximately XX deals recorded between 2019 and 2024, leading to market consolidation and increased competition.
- Market Concentration: Moderately concentrated, with a few dominant players.
- Innovation Drivers: Advancements in materials, miniaturization.
- Regulatory Framework: Stringent regulations on safety and efficacy.
- Product Substitutes: Compression therapy.
- End-User Trends: Preference for minimally invasive procedures.
- M&A Activity: Approximately XX deals between 2019 and 2024.
Vacuum Therapy System Industry Trends & Analysis
The Vacuum Therapy System market is experiencing robust growth, with a projected Compound Annual Growth Rate (CAGR) of XX% during the forecast period (2025-2033). Market penetration is increasing across various healthcare segments, driven by several key factors. Technological disruptions, such as the development of smart systems with integrated monitoring capabilities, are enhancing treatment effectiveness and patient experience. Consumer preferences are shifting toward convenient, portable, and user-friendly devices. Competitive dynamics are characterized by ongoing product innovation, strategic partnerships, and efforts to differentiate offerings based on features, efficacy, and cost-effectiveness. This dynamic interplay between technological advancements, evolving consumer preferences, and intense competition is shaping the future trajectory of the market. The market growth is further propelled by increasing awareness about the benefits of vacuum therapy and rising prevalence of chronic diseases that require this treatment modality. The rising geriatric population is another key driver that adds impetus to the market expansion.
Leading Markets & Segments in Vacuum Therapy System
The North American region currently dominates the Vacuum Therapy System market, accounting for approximately XX% of global revenue in 2025. This dominance can be attributed to:
- Robust Healthcare Infrastructure: Advanced healthcare infrastructure and high healthcare expenditure.
- High Adoption Rates: Higher adoption rates due to increased awareness and technological advancements.
- Favorable Regulatory Environment: Supportive regulatory environment fostering innovation and market growth.
- Strong R&D Investment: Significant investment in research and development leading to innovative product offerings.
The key segment driving market growth is the treatment of wounds and edema, which accounts for a significant portion of the overall market share. This is largely driven by the increased effectiveness and reduced complications associated with Vacuum Therapy Systems compared to traditional methods.
Vacuum Therapy System Product Developments
Recent product innovations include the development of portable and wireless systems, improved pressure control mechanisms, and integration with smart devices for remote monitoring. These advancements enhance user convenience, treatment accuracy, and overall patient experience. The integration of advanced sensors and data analytics allows for personalized treatment protocols and more effective monitoring. These innovations are enhancing the competitiveness of Vacuum Therapy Systems and broadening their applications across various medical fields.
Key Drivers of Vacuum Therapy System Growth
The Vacuum Therapy System market's growth is fueled by several key factors: The rising prevalence of chronic wounds, along with increasing awareness regarding minimally invasive procedures and improved patient outcomes, significantly fuels market expansion. Technological advancements lead to the development of more efficient and user-friendly systems, expanding the market further. Favorable regulatory frameworks also support growth by facilitating faster approvals for new products. Moreover, the aging global population contributes to the increasing demand for treatment options that improve wound healing and manage edema.
Challenges in the Vacuum Therapy System Market
Challenges include the high initial cost of the systems, which can be a barrier to adoption, particularly in resource-constrained healthcare settings. The complex regulatory landscape and lengthy approval processes can also hinder market expansion. Furthermore, intense competition among established players and the emergence of new entrants put downward pressure on pricing. Supply chain disruptions and fluctuations in raw material costs also pose a challenge for manufacturers.
Emerging Opportunities in Vacuum Therapy System
Significant opportunities lie in expanding applications into new therapeutic areas, developing innovative systems with integrated telehealth capabilities, and penetrating emerging markets with unmet needs. Strategic partnerships with healthcare providers and distributors can also drive market growth. Technological breakthroughs like the development of biocompatible materials and advanced sensors offer immense potential to enhance the performance and safety of Vacuum Therapy Systems.
Leading Players in the Vacuum Therapy System Sector
- Enraf Nonius
- Iskra Medical
- DJO International
- Acelity
- Molnlycke Healthcare
- Johnson & Johnson
- Coloplast
- Augustus Medical
- Boston Scientific
Key Milestones in Vacuum Therapy System Industry
- 2020: Launch of a new portable vacuum therapy system by Company X.
- 2022: Acquisition of Company Y by Company Z, expanding market reach.
- 2023: Approval of a novel vacuum therapy system for a new therapeutic application.
- 2024: Introduction of a smart vacuum therapy system with integrated monitoring capabilities.
Strategic Outlook for Vacuum Therapy System Market
The Vacuum Therapy System market presents significant long-term growth potential, driven by technological advancements, increasing healthcare spending, and a growing global population requiring advanced wound care solutions. Strategic investments in research and development, expansion into new geographical markets, and strategic partnerships with key stakeholders will be crucial for success in this dynamic market. Focusing on value-added services and data analytics to improve patient outcomes will also be key differentiators.
Vacuum Therapy System Segmentation
-
1. Application
- 1.1. Hospitals
- 1.2. Clinics
- 1.3. Other
-
2. Types
- 2.1. Portable
- 2.2. Stationary
Vacuum Therapy System Segmentation By Geography
-
1. North America
- 1.1. United States
- 1.2. Canada
- 1.3. Mexico
-
2. South America
- 2.1. Brazil
- 2.2. Argentina
- 2.3. Rest of South America
-
3. Europe
- 3.1. United Kingdom
- 3.2. Germany
- 3.3. France
- 3.4. Italy
- 3.5. Spain
- 3.6. Russia
- 3.7. Benelux
- 3.8. Nordics
- 3.9. Rest of Europe
-
4. Middle East & Africa
- 4.1. Turkey
- 4.2. Israel
- 4.3. GCC
- 4.4. North Africa
- 4.5. South Africa
- 4.6. Rest of Middle East & Africa
-
5. Asia Pacific
- 5.1. China
- 5.2. India
- 5.3. Japan
- 5.4. South Korea
- 5.5. ASEAN
- 5.6. Oceania
- 5.7. Rest of Asia Pacific
Vacuum Therapy System Regional Market Share
Geographic Coverage of Vacuum Therapy System
Vacuum Therapy System REPORT HIGHLIGHTS
| Aspects | Details |
|---|---|
| Study Period | 2020-2034 |
| Base Year | 2025 |
| Estimated Year | 2026 |
| Forecast Period | 2026-2034 |
| Historical Period | 2020-2025 |
| Growth Rate | CAGR of 5% from 2020-2034 |
| Segmentation |
|
Table of Contents
- 1. Introduction
- 1.1. Research Scope
- 1.2. Market Segmentation
- 1.3. Research Objective
- 1.4. Definitions and Assumptions
- 2. Executive Summary
- 2.1. Market Snapshot
- 3. Market Dynamics
- 3.1. Market Drivers
- 3.2. Market Restrains
- 3.3. Market Trends
- 3.4. Market Opportunities
- 4. Market Factor Analysis
- 4.1. Porters Five Forces
- 4.1.1. Bargaining Power of Suppliers
- 4.1.2. Bargaining Power of Buyers
- 4.1.3. Threat of New Entrants
- 4.1.4. Threat of Substitutes
- 4.1.5. Competitive Rivalry
- 4.2. PESTEL analysis
- 4.3. BCG Analysis
- 4.3.1. Stars (High Growth, High Market Share)
- 4.3.2. Cash Cows (Low Growth, High Market Share)
- 4.3.3. Question Mark (High Growth, Low Market Share)
- 4.3.4. Dogs (Low Growth, Low Market Share)
- 4.4. Ansoff Matrix Analysis
- 4.5. Supply Chain Analysis
- 4.6. Regulatory Landscape
- 4.7. Current Market Potential and Opportunity Assessment (TAM–SAM–SOM Framework)
- 4.8. MDP Analyst Note
- 4.1. Porters Five Forces
- 5. Market Analysis, Insights and Forecast 2021-2033
- 5.1. Market Analysis, Insights and Forecast - by Application
- 5.1.1. Hospitals
- 5.1.2. Clinics
- 5.1.3. Other
- 5.2. Market Analysis, Insights and Forecast - by Types
- 5.2.1. Portable
- 5.2.2. Stationary
- 5.3. Market Analysis, Insights and Forecast - by Region
- 5.3.1. North America
- 5.3.2. South America
- 5.3.3. Europe
- 5.3.4. Middle East & Africa
- 5.3.5. Asia Pacific
- 5.1. Market Analysis, Insights and Forecast - by Application
- 6. Global Vacuum Therapy System Analysis, Insights and Forecast, 2021-2033
- 6.1. Market Analysis, Insights and Forecast - by Application
- 6.1.1. Hospitals
- 6.1.2. Clinics
- 6.1.3. Other
- 6.2. Market Analysis, Insights and Forecast - by Types
- 6.2.1. Portable
- 6.2.2. Stationary
- 6.1. Market Analysis, Insights and Forecast - by Application
- 7. North America Vacuum Therapy System Analysis, Insights and Forecast, 2020-2032
- 7.1. Market Analysis, Insights and Forecast - by Application
- 7.1.1. Hospitals
- 7.1.2. Clinics
- 7.1.3. Other
- 7.2. Market Analysis, Insights and Forecast - by Types
- 7.2.1. Portable
- 7.2.2. Stationary
- 7.1. Market Analysis, Insights and Forecast - by Application
- 8. South America Vacuum Therapy System Analysis, Insights and Forecast, 2020-2032
- 8.1. Market Analysis, Insights and Forecast - by Application
- 8.1.1. Hospitals
- 8.1.2. Clinics
- 8.1.3. Other
- 8.2. Market Analysis, Insights and Forecast - by Types
- 8.2.1. Portable
- 8.2.2. Stationary
- 8.1. Market Analysis, Insights and Forecast - by Application
- 9. Europe Vacuum Therapy System Analysis, Insights and Forecast, 2020-2032
- 9.1. Market Analysis, Insights and Forecast - by Application
- 9.1.1. Hospitals
- 9.1.2. Clinics
- 9.1.3. Other
- 9.2. Market Analysis, Insights and Forecast - by Types
- 9.2.1. Portable
- 9.2.2. Stationary
- 9.1. Market Analysis, Insights and Forecast - by Application
- 10. Middle East & Africa Vacuum Therapy System Analysis, Insights and Forecast, 2020-2032
- 10.1. Market Analysis, Insights and Forecast - by Application
- 10.1.1. Hospitals
- 10.1.2. Clinics
- 10.1.3. Other
- 10.2. Market Analysis, Insights and Forecast - by Types
- 10.2.1. Portable
- 10.2.2. Stationary
- 10.1. Market Analysis, Insights and Forecast - by Application
- 11. Asia Pacific Vacuum Therapy System Analysis, Insights and Forecast, 2020-2032
- 11.1. Market Analysis, Insights and Forecast - by Application
- 11.1.1. Hospitals
- 11.1.2. Clinics
- 11.1.3. Other
- 11.2. Market Analysis, Insights and Forecast - by Types
- 11.2.1. Portable
- 11.2.2. Stationary
- 11.1. Market Analysis, Insights and Forecast - by Application
- 12. Competitive Analysis
- 12.1. Company Profiles
- 12.1.1 Enraf Nonius
- 12.1.1.1. Company Overview
- 12.1.1.2. Products
- 12.1.1.3. Company Financials
- 12.1.1.4. SWOT Analysis
- 12.1.2 Iskra Medical
- 12.1.2.1. Company Overview
- 12.1.2.2. Products
- 12.1.2.3. Company Financials
- 12.1.2.4. SWOT Analysis
- 12.1.3 DJO International
- 12.1.3.1. Company Overview
- 12.1.3.2. Products
- 12.1.3.3. Company Financials
- 12.1.3.4. SWOT Analysis
- 12.1.4 Acelity
- 12.1.4.1. Company Overview
- 12.1.4.2. Products
- 12.1.4.3. Company Financials
- 12.1.4.4. SWOT Analysis
- 12.1.5 Molnlycke Healthcare
- 12.1.5.1. Company Overview
- 12.1.5.2. Products
- 12.1.5.3. Company Financials
- 12.1.5.4. SWOT Analysis
- 12.1.6 Johnson&Johnson
- 12.1.6.1. Company Overview
- 12.1.6.2. Products
- 12.1.6.3. Company Financials
- 12.1.6.4. SWOT Analysis
- 12.1.7 Coloplast
- 12.1.7.1. Company Overview
- 12.1.7.2. Products
- 12.1.7.3. Company Financials
- 12.1.7.4. SWOT Analysis
- 12.1.8 Augustus Medical
- 12.1.8.1. Company Overview
- 12.1.8.2. Products
- 12.1.8.3. Company Financials
- 12.1.8.4. SWOT Analysis
- 12.1.9 Boston Scientific
- 12.1.9.1. Company Overview
- 12.1.9.2. Products
- 12.1.9.3. Company Financials
- 12.1.9.4. SWOT Analysis
- 12.1.1 Enraf Nonius
- 12.2. Market Entropy
- 12.2.1 Company's Key Areas Served
- 12.2.2 Recent Developments
- 12.3. Company Market Share Analysis 2025
- 12.3.1 Top 5 Companies Market Share Analysis
- 12.3.2 Top 3 Companies Market Share Analysis
- 12.4. List of Potential Customers
- 13. Research Methodology
List of Figures
- Figure 1: Global Vacuum Therapy System Revenue Breakdown (undefined, %) by Region 2025 & 2033
- Figure 2: Global Vacuum Therapy System Volume Breakdown (K, %) by Region 2025 & 2033
- Figure 3: North America Vacuum Therapy System Revenue (undefined), by Application 2025 & 2033
- Figure 4: North America Vacuum Therapy System Volume (K), by Application 2025 & 2033
- Figure 5: North America Vacuum Therapy System Revenue Share (%), by Application 2025 & 2033
- Figure 6: North America Vacuum Therapy System Volume Share (%), by Application 2025 & 2033
- Figure 7: North America Vacuum Therapy System Revenue (undefined), by Types 2025 & 2033
- Figure 8: North America Vacuum Therapy System Volume (K), by Types 2025 & 2033
- Figure 9: North America Vacuum Therapy System Revenue Share (%), by Types 2025 & 2033
- Figure 10: North America Vacuum Therapy System Volume Share (%), by Types 2025 & 2033
- Figure 11: North America Vacuum Therapy System Revenue (undefined), by Country 2025 & 2033
- Figure 12: North America Vacuum Therapy System Volume (K), by Country 2025 & 2033
- Figure 13: North America Vacuum Therapy System Revenue Share (%), by Country 2025 & 2033
- Figure 14: North America Vacuum Therapy System Volume Share (%), by Country 2025 & 2033
- Figure 15: South America Vacuum Therapy System Revenue (undefined), by Application 2025 & 2033
- Figure 16: South America Vacuum Therapy System Volume (K), by Application 2025 & 2033
- Figure 17: South America Vacuum Therapy System Revenue Share (%), by Application 2025 & 2033
- Figure 18: South America Vacuum Therapy System Volume Share (%), by Application 2025 & 2033
- Figure 19: South America Vacuum Therapy System Revenue (undefined), by Types 2025 & 2033
- Figure 20: South America Vacuum Therapy System Volume (K), by Types 2025 & 2033
- Figure 21: South America Vacuum Therapy System Revenue Share (%), by Types 2025 & 2033
- Figure 22: South America Vacuum Therapy System Volume Share (%), by Types 2025 & 2033
- Figure 23: South America Vacuum Therapy System Revenue (undefined), by Country 2025 & 2033
- Figure 24: South America Vacuum Therapy System Volume (K), by Country 2025 & 2033
- Figure 25: South America Vacuum Therapy System Revenue Share (%), by Country 2025 & 2033
- Figure 26: South America Vacuum Therapy System Volume Share (%), by Country 2025 & 2033
- Figure 27: Europe Vacuum Therapy System Revenue (undefined), by Application 2025 & 2033
- Figure 28: Europe Vacuum Therapy System Volume (K), by Application 2025 & 2033
- Figure 29: Europe Vacuum Therapy System Revenue Share (%), by Application 2025 & 2033
- Figure 30: Europe Vacuum Therapy System Volume Share (%), by Application 2025 & 2033
- Figure 31: Europe Vacuum Therapy System Revenue (undefined), by Types 2025 & 2033
- Figure 32: Europe Vacuum Therapy System Volume (K), by Types 2025 & 2033
- Figure 33: Europe Vacuum Therapy System Revenue Share (%), by Types 2025 & 2033
- Figure 34: Europe Vacuum Therapy System Volume Share (%), by Types 2025 & 2033
- Figure 35: Europe Vacuum Therapy System Revenue (undefined), by Country 2025 & 2033
- Figure 36: Europe Vacuum Therapy System Volume (K), by Country 2025 & 2033
- Figure 37: Europe Vacuum Therapy System Revenue Share (%), by Country 2025 & 2033
- Figure 38: Europe Vacuum Therapy System Volume Share (%), by Country 2025 & 2033
- Figure 39: Middle East & Africa Vacuum Therapy System Revenue (undefined), by Application 2025 & 2033
- Figure 40: Middle East & Africa Vacuum Therapy System Volume (K), by Application 2025 & 2033
- Figure 41: Middle East & Africa Vacuum Therapy System Revenue Share (%), by Application 2025 & 2033
- Figure 42: Middle East & Africa Vacuum Therapy System Volume Share (%), by Application 2025 & 2033
- Figure 43: Middle East & Africa Vacuum Therapy System Revenue (undefined), by Types 2025 & 2033
- Figure 44: Middle East & Africa Vacuum Therapy System Volume (K), by Types 2025 & 2033
- Figure 45: Middle East & Africa Vacuum Therapy System Revenue Share (%), by Types 2025 & 2033
- Figure 46: Middle East & Africa Vacuum Therapy System Volume Share (%), by Types 2025 & 2033
- Figure 47: Middle East & Africa Vacuum Therapy System Revenue (undefined), by Country 2025 & 2033
- Figure 48: Middle East & Africa Vacuum Therapy System Volume (K), by Country 2025 & 2033
- Figure 49: Middle East & Africa Vacuum Therapy System Revenue Share (%), by Country 2025 & 2033
- Figure 50: Middle East & Africa Vacuum Therapy System Volume Share (%), by Country 2025 & 2033
- Figure 51: Asia Pacific Vacuum Therapy System Revenue (undefined), by Application 2025 & 2033
- Figure 52: Asia Pacific Vacuum Therapy System Volume (K), by Application 2025 & 2033
- Figure 53: Asia Pacific Vacuum Therapy System Revenue Share (%), by Application 2025 & 2033
- Figure 54: Asia Pacific Vacuum Therapy System Volume Share (%), by Application 2025 & 2033
- Figure 55: Asia Pacific Vacuum Therapy System Revenue (undefined), by Types 2025 & 2033
- Figure 56: Asia Pacific Vacuum Therapy System Volume (K), by Types 2025 & 2033
- Figure 57: Asia Pacific Vacuum Therapy System Revenue Share (%), by Types 2025 & 2033
- Figure 58: Asia Pacific Vacuum Therapy System Volume Share (%), by Types 2025 & 2033
- Figure 59: Asia Pacific Vacuum Therapy System Revenue (undefined), by Country 2025 & 2033
- Figure 60: Asia Pacific Vacuum Therapy System Volume (K), by Country 2025 & 2033
- Figure 61: Asia Pacific Vacuum Therapy System Revenue Share (%), by Country 2025 & 2033
- Figure 62: Asia Pacific Vacuum Therapy System Volume Share (%), by Country 2025 & 2033
List of Tables
- Table 1: Global Vacuum Therapy System Revenue undefined Forecast, by Application 2020 & 2033
- Table 2: Global Vacuum Therapy System Volume K Forecast, by Application 2020 & 2033
- Table 3: Global Vacuum Therapy System Revenue undefined Forecast, by Types 2020 & 2033
- Table 4: Global Vacuum Therapy System Volume K Forecast, by Types 2020 & 2033
- Table 5: Global Vacuum Therapy System Revenue undefined Forecast, by Region 2020 & 2033
- Table 6: Global Vacuum Therapy System Volume K Forecast, by Region 2020 & 2033
- Table 7: Global Vacuum Therapy System Revenue undefined Forecast, by Application 2020 & 2033
- Table 8: Global Vacuum Therapy System Volume K Forecast, by Application 2020 & 2033
- Table 9: Global Vacuum Therapy System Revenue undefined Forecast, by Types 2020 & 2033
- Table 10: Global Vacuum Therapy System Volume K Forecast, by Types 2020 & 2033
- Table 11: Global Vacuum Therapy System Revenue undefined Forecast, by Country 2020 & 2033
- Table 12: Global Vacuum Therapy System Volume K Forecast, by Country 2020 & 2033
- Table 13: United States Vacuum Therapy System Revenue (undefined) Forecast, by Application 2020 & 2033
- Table 14: United States Vacuum Therapy System Volume (K) Forecast, by Application 2020 & 2033
- Table 15: Canada Vacuum Therapy System Revenue (undefined) Forecast, by Application 2020 & 2033
- Table 16: Canada Vacuum Therapy System Volume (K) Forecast, by Application 2020 & 2033
- Table 17: Mexico Vacuum Therapy System Revenue (undefined) Forecast, by Application 2020 & 2033
- Table 18: Mexico Vacuum Therapy System Volume (K) Forecast, by Application 2020 & 2033
- Table 19: Global Vacuum Therapy System Revenue undefined Forecast, by Application 2020 & 2033
- Table 20: Global Vacuum Therapy System Volume K Forecast, by Application 2020 & 2033
- Table 21: Global Vacuum Therapy System Revenue undefined Forecast, by Types 2020 & 2033
- Table 22: Global Vacuum Therapy System Volume K Forecast, by Types 2020 & 2033
- Table 23: Global Vacuum Therapy System Revenue undefined Forecast, by Country 2020 & 2033
- Table 24: Global Vacuum Therapy System Volume K Forecast, by Country 2020 & 2033
- Table 25: Brazil Vacuum Therapy System Revenue (undefined) Forecast, by Application 2020 & 2033
- Table 26: Brazil Vacuum Therapy System Volume (K) Forecast, by Application 2020 & 2033
- Table 27: Argentina Vacuum Therapy System Revenue (undefined) Forecast, by Application 2020 & 2033
- Table 28: Argentina Vacuum Therapy System Volume (K) Forecast, by Application 2020 & 2033
- Table 29: Rest of South America Vacuum Therapy System Revenue (undefined) Forecast, by Application 2020 & 2033
- Table 30: Rest of South America Vacuum Therapy System Volume (K) Forecast, by Application 2020 & 2033
- Table 31: Global Vacuum Therapy System Revenue undefined Forecast, by Application 2020 & 2033
- Table 32: Global Vacuum Therapy System Volume K Forecast, by Application 2020 & 2033
- Table 33: Global Vacuum Therapy System Revenue undefined Forecast, by Types 2020 & 2033
- Table 34: Global Vacuum Therapy System Volume K Forecast, by Types 2020 & 2033
- Table 35: Global Vacuum Therapy System Revenue undefined Forecast, by Country 2020 & 2033
- Table 36: Global Vacuum Therapy System Volume K Forecast, by Country 2020 & 2033
- Table 37: United Kingdom Vacuum Therapy System Revenue (undefined) Forecast, by Application 2020 & 2033
- Table 38: United Kingdom Vacuum Therapy System Volume (K) Forecast, by Application 2020 & 2033
- Table 39: Germany Vacuum Therapy System Revenue (undefined) Forecast, by Application 2020 & 2033
- Table 40: Germany Vacuum Therapy System Volume (K) Forecast, by Application 2020 & 2033
- Table 41: France Vacuum Therapy System Revenue (undefined) Forecast, by Application 2020 & 2033
- Table 42: France Vacuum Therapy System Volume (K) Forecast, by Application 2020 & 2033
- Table 43: Italy Vacuum Therapy System Revenue (undefined) Forecast, by Application 2020 & 2033
- Table 44: Italy Vacuum Therapy System Volume (K) Forecast, by Application 2020 & 2033
- Table 45: Spain Vacuum Therapy System Revenue (undefined) Forecast, by Application 2020 & 2033
- Table 46: Spain Vacuum Therapy System Volume (K) Forecast, by Application 2020 & 2033
- Table 47: Russia Vacuum Therapy System Revenue (undefined) Forecast, by Application 2020 & 2033
- Table 48: Russia Vacuum Therapy System Volume (K) Forecast, by Application 2020 & 2033
- Table 49: Benelux Vacuum Therapy System Revenue (undefined) Forecast, by Application 2020 & 2033
- Table 50: Benelux Vacuum Therapy System Volume (K) Forecast, by Application 2020 & 2033
- Table 51: Nordics Vacuum Therapy System Revenue (undefined) Forecast, by Application 2020 & 2033
- Table 52: Nordics Vacuum Therapy System Volume (K) Forecast, by Application 2020 & 2033
- Table 53: Rest of Europe Vacuum Therapy System Revenue (undefined) Forecast, by Application 2020 & 2033
- Table 54: Rest of Europe Vacuum Therapy System Volume (K) Forecast, by Application 2020 & 2033
- Table 55: Global Vacuum Therapy System Revenue undefined Forecast, by Application 2020 & 2033
- Table 56: Global Vacuum Therapy System Volume K Forecast, by Application 2020 & 2033
- Table 57: Global Vacuum Therapy System Revenue undefined Forecast, by Types 2020 & 2033
- Table 58: Global Vacuum Therapy System Volume K Forecast, by Types 2020 & 2033
- Table 59: Global Vacuum Therapy System Revenue undefined Forecast, by Country 2020 & 2033
- Table 60: Global Vacuum Therapy System Volume K Forecast, by Country 2020 & 2033
- Table 61: Turkey Vacuum Therapy System Revenue (undefined) Forecast, by Application 2020 & 2033
- Table 62: Turkey Vacuum Therapy System Volume (K) Forecast, by Application 2020 & 2033
- Table 63: Israel Vacuum Therapy System Revenue (undefined) Forecast, by Application 2020 & 2033
- Table 64: Israel Vacuum Therapy System Volume (K) Forecast, by Application 2020 & 2033
- Table 65: GCC Vacuum Therapy System Revenue (undefined) Forecast, by Application 2020 & 2033
- Table 66: GCC Vacuum Therapy System Volume (K) Forecast, by Application 2020 & 2033
- Table 67: North Africa Vacuum Therapy System Revenue (undefined) Forecast, by Application 2020 & 2033
- Table 68: North Africa Vacuum Therapy System Volume (K) Forecast, by Application 2020 & 2033
- Table 69: South Africa Vacuum Therapy System Revenue (undefined) Forecast, by Application 2020 & 2033
- Table 70: South Africa Vacuum Therapy System Volume (K) Forecast, by Application 2020 & 2033
- Table 71: Rest of Middle East & Africa Vacuum Therapy System Revenue (undefined) Forecast, by Application 2020 & 2033
- Table 72: Rest of Middle East & Africa Vacuum Therapy System Volume (K) Forecast, by Application 2020 & 2033
- Table 73: Global Vacuum Therapy System Revenue undefined Forecast, by Application 2020 & 2033
- Table 74: Global Vacuum Therapy System Volume K Forecast, by Application 2020 & 2033
- Table 75: Global Vacuum Therapy System Revenue undefined Forecast, by Types 2020 & 2033
- Table 76: Global Vacuum Therapy System Volume K Forecast, by Types 2020 & 2033
- Table 77: Global Vacuum Therapy System Revenue undefined Forecast, by Country 2020 & 2033
- Table 78: Global Vacuum Therapy System Volume K Forecast, by Country 2020 & 2033
- Table 79: China Vacuum Therapy System Revenue (undefined) Forecast, by Application 2020 & 2033
- Table 80: China Vacuum Therapy System Volume (K) Forecast, by Application 2020 & 2033
- Table 81: India Vacuum Therapy System Revenue (undefined) Forecast, by Application 2020 & 2033
- Table 82: India Vacuum Therapy System Volume (K) Forecast, by Application 2020 & 2033
- Table 83: Japan Vacuum Therapy System Revenue (undefined) Forecast, by Application 2020 & 2033
- Table 84: Japan Vacuum Therapy System Volume (K) Forecast, by Application 2020 & 2033
- Table 85: South Korea Vacuum Therapy System Revenue (undefined) Forecast, by Application 2020 & 2033
- Table 86: South Korea Vacuum Therapy System Volume (K) Forecast, by Application 2020 & 2033
- Table 87: ASEAN Vacuum Therapy System Revenue (undefined) Forecast, by Application 2020 & 2033
- Table 88: ASEAN Vacuum Therapy System Volume (K) Forecast, by Application 2020 & 2033
- Table 89: Oceania Vacuum Therapy System Revenue (undefined) Forecast, by Application 2020 & 2033
- Table 90: Oceania Vacuum Therapy System Volume (K) Forecast, by Application 2020 & 2033
- Table 91: Rest of Asia Pacific Vacuum Therapy System Revenue (undefined) Forecast, by Application 2020 & 2033
- Table 92: Rest of Asia Pacific Vacuum Therapy System Volume (K) Forecast, by Application 2020 & 2033
Frequently Asked Questions
1. What is the projected Compound Annual Growth Rate (CAGR) of the Vacuum Therapy System?
The projected CAGR is approximately 5%.
2. Which companies are prominent players in the Vacuum Therapy System?
Key companies in the market include Enraf Nonius, Iskra Medical, DJO International, Acelity, Molnlycke Healthcare, Johnson&Johnson, Coloplast, Augustus Medical, Boston Scientific.
3. What are the main segments of the Vacuum Therapy System?
The market segments include Application, Types.
4. Can you provide details about the market size?
The market size is estimated to be USD XXX N/A as of 2022.
5. What are some drivers contributing to market growth?
N/A
6. What are the notable trends driving market growth?
N/A
7. Are there any restraints impacting market growth?
N/A
8. Can you provide examples of recent developments in the market?
N/A
9. What pricing options are available for accessing the report?
Pricing options include single-user, multi-user, and enterprise licenses priced at USD 3950.00, USD 5925.00, and USD 7900.00 respectively.
10. Is the market size provided in terms of value or volume?
The market size is provided in terms of value, measured in N/A and volume, measured in K.
11. Are there any specific market keywords associated with the report?
Yes, the market keyword associated with the report is "Vacuum Therapy System," which aids in identifying and referencing the specific market segment covered.
12. How do I determine which pricing option suits my needs best?
The pricing options vary based on user requirements and access needs. Individual users may opt for single-user licenses, while businesses requiring broader access may choose multi-user or enterprise licenses for cost-effective access to the report.
13. Are there any additional resources or data provided in the Vacuum Therapy System report?
While the report offers comprehensive insights, it's advisable to review the specific contents or supplementary materials provided to ascertain if additional resources or data are available.
14. How can I stay updated on further developments or reports in the Vacuum Therapy System?
To stay informed about further developments, trends, and reports in the Vacuum Therapy System, consider subscribing to industry newsletters, following relevant companies and organizations, or regularly checking reputable industry news sources and publications.
Methodology
Step 1 - Identification of Relevant Samples Size from Population Database


Step 2 - Approaches for Defining Global Market Size (Value, Volume* & Price*)

Note*: In applicable scenarios
Step 3 - Data Sources
Primary Research
- Web Analytics
- Survey Reports
- Research Institute
- Latest Research Reports
- Opinion Leaders
Secondary Research
- Annual Reports
- White Paper
- Latest Press Release
- Industry Association
- Paid Database
- Investor Presentations

Step 4 - Data Triangulation
Involves using different sources of information in order to increase the validity of a study
These sources are likely to be stakeholders in a program - participants, other researchers, program staff, other community members, and so on.
Then we put all data in single framework & apply various statistical tools to find out the dynamic on the market.
During the analysis stage, feedback from the stakeholder groups would be compared to determine areas of agreement as well as areas of divergence