

Key Insights
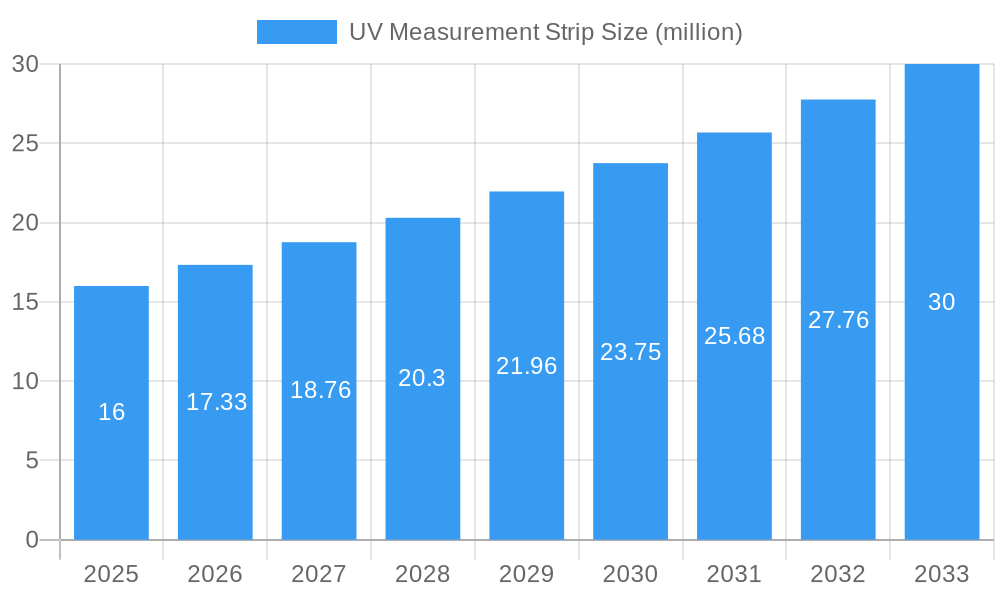
The UV Measurement Strip market is experiencing robust growth, projected to reach a market size of $16 million in 2025 and exhibiting a Compound Annual Growth Rate (CAGR) of 8.2% from 2025 to 2033. This expansion is driven by several key factors. Increasing demand for precise UV intensity monitoring across various industries, including healthcare (UV sterilization), manufacturing (UV curing), and environmental monitoring (UV index measurement), fuels market growth. Technological advancements leading to more compact, cost-effective, and user-friendly UV measurement strips are also contributing significantly. Furthermore, stringent regulatory compliance requirements related to UV exposure in workplaces and the growing awareness of the health impacts of excessive UV radiation are driving adoption. The market is segmented by application (healthcare, industrial, environmental, etc.), technology (photodiode-based, chemical-based, etc.), and geography. Key players such as UV-Technik International, FUJIFILM Corporation, Epak Electronics, Quanta X Technology, UV-Design, and Propper Manufacturing are actively shaping the market through innovation and expansion.
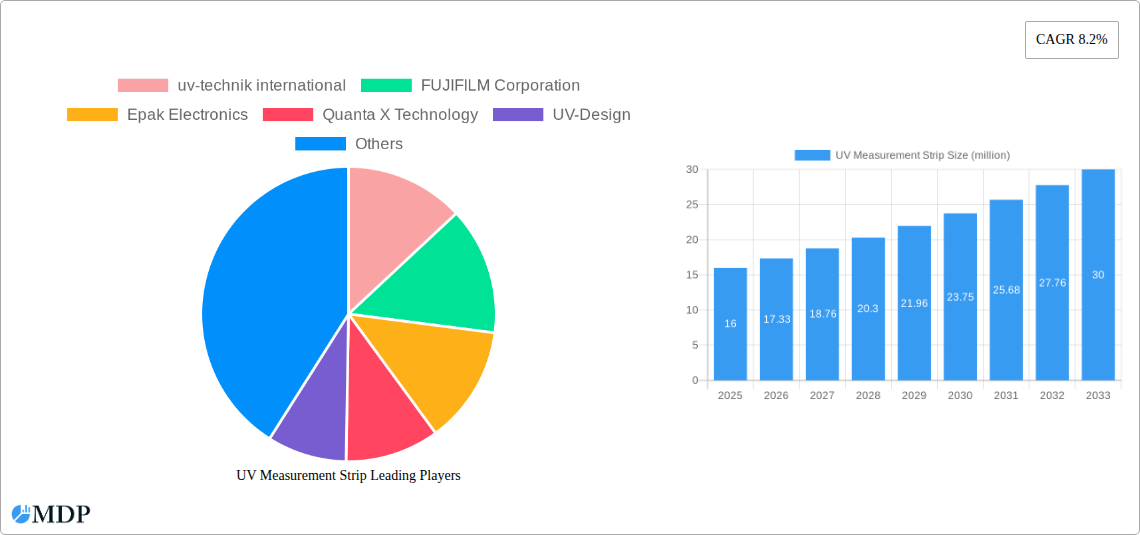
UV Measurement Strip Market Size (In Million)
The competitive landscape is characterized by both established players and emerging companies. Established players benefit from brand recognition and extensive distribution networks, while newer entrants bring innovative products and disruptive technologies. However, challenges remain, including the need for improved accuracy and reliability in certain applications and the potential for price competition. The future trajectory of the market appears positive, with continued growth driven by the increasing adoption of UV technologies across various sectors. Further market segmentation and geographic expansion, particularly in developing economies, will offer lucrative growth opportunities for market participants. Advancements in sensor technology and integration with smart devices will likely enhance the functionality and accessibility of UV measurement strips.
UV Measurement Strip Company Market Share
UV Measurement Strip Market Report: A Comprehensive Analysis (2019-2033)
This comprehensive report provides an in-depth analysis of the global UV Measurement Strip market, offering invaluable insights for industry stakeholders, investors, and strategic decision-makers. The report covers the period from 2019 to 2033, with a focus on the estimated year 2025 and a forecast period spanning 2025-2033. The study meticulously analyzes market dynamics, industry trends, leading players, and future growth opportunities, presenting data in a clear, actionable format. Millions are used as units for all values.
UV Measurement Strip Market Dynamics & Concentration
The global UV Measurement Strip market exhibits a moderately consolidated structure, with a few key players holding significant market share. In 2024, the top five companies held an estimated xx% of the market, indicating room for both expansion and competitive pressures. Innovation is a key driver, with companies continually striving to improve accuracy, sensitivity, and ease of use. Stringent regulatory frameworks, particularly concerning safety and environmental impact, play a significant role in shaping market dynamics. Substitutes, such as spectrophotometers, exist but often lack the convenience and cost-effectiveness of UV measurement strips. End-user trends indicate a growing preference for rapid, portable, and user-friendly solutions. M&A activity has been moderate, with approximately xx deals recorded in the historical period (2019-2024), primarily focused on enhancing technological capabilities and expanding market reach.
- Market Concentration: Top 5 companies hold approximately xx% market share (2024).
- Innovation Drivers: Improved accuracy, sensitivity, portability, and ease of use.
- Regulatory Frameworks: Stringent safety and environmental regulations influence market dynamics.
- Product Substitutes: Spectrophotometers represent a primary substitute, though with limitations.
- End-User Trends: Demand for user-friendly, rapid, and portable solutions is increasing.
- M&A Activity: Approximately xx mergers and acquisitions occurred between 2019 and 2024.
UV Measurement Strip Industry Trends & Analysis
The UV Measurement Strip market is experiencing robust growth, driven by increasing demand across diverse sectors. The Compound Annual Growth Rate (CAGR) from 2025 to 2033 is projected to be xx%, reflecting strong market expansion. This growth is fueled by advancements in UV sensing technology, which have significantly enhanced the accuracy and reliability of UV measurement strips. Consumer preferences are shifting towards environmentally friendly and sustainable solutions, which is driving innovation in strip material and manufacturing processes. Competitive dynamics are intense, with companies focusing on product differentiation, cost optimization, and strategic partnerships to gain a market edge. Market penetration in key sectors like healthcare, environmental monitoring, and industrial applications continues to grow, contributing to the overall market expansion. Technological disruptions, such as the development of more sophisticated and miniaturized sensors, are accelerating the adoption of UV measurement strips.
Leading Markets & Segments in UV Measurement Strip
The North American region currently holds the dominant position in the global UV Measurement Strip market. This dominance is primarily attributed to the high adoption rate in various industrial sectors and strong regulatory support for UV safety measures. The robust healthcare infrastructure and significant research funding also contribute to this regional leadership.
- Key Drivers in North America:
- Strong regulatory frameworks promoting UV safety.
- High adoption in healthcare, industrial, and environmental sectors.
- Robust research and development funding.
- Advanced infrastructure supporting market expansion.
- Dominance Analysis: North America's mature market and strong technological advancements contribute to its leading position. The region’s established industrial base and regulatory environment actively support the proliferation of UV measurement strip technologies. Further market penetration is anticipated in developing economies spurred by increasing industrial activity and improving healthcare infrastructure.
UV Measurement Strip Product Developments
Recent product innovations focus on enhancing sensitivity, accuracy, and durability, leading to better measurement results in diverse applications. Miniaturization and integration with other technologies, such as smart devices, enhance usability and data analysis capabilities. The competitive advantage lies in offering higher accuracy, lower cost, greater portability, and user-friendly design features. Technological trends suggest a movement toward advanced materials, improved sensors, and more sophisticated data interpretation software. The market is seeing a strong fit for UV measurement strips in applications requiring rapid, on-site UV intensity assessment.
Key Drivers of UV Measurement Strip Growth
Technological advancements in sensor technology and miniaturization are primary drivers of market growth. Economic factors, such as increased industrial activity and rising disposable incomes, particularly in developing economies, fuel demand. Stringent government regulations related to UV exposure and safety standards are also crucial in driving adoption. Examples include new environmental monitoring regulations and increased safety protocols in industrial settings.
Challenges in the UV Measurement Strip Market
Regulatory hurdles, such as varying standards across different regions, create compliance complexities and increase costs for manufacturers. Supply chain disruptions can impact production and availability, particularly concerning specialized components. Intense competition from existing and emerging players necessitates continuous innovation and cost optimization to maintain profitability and market share. These challenges cumulatively impact market growth, causing limitations and influencing strategic decision-making.
Emerging Opportunities in UV Measurement Strip
Technological breakthroughs in material science and sensor technology are creating new possibilities for more sensitive, accurate, and cost-effective UV measurement strips. Strategic partnerships between manufacturers, research institutions, and end-users can facilitate faster product development and market penetration. Expanding into new and emerging markets offers significant growth potential, particularly in regions experiencing rapid industrialization and increased awareness of UV-related health risks. These advancements create opportunities for sustained and robust growth in the coming years.
Leading Players in the UV Measurement Strip Sector
- uv-technik international
- FUJIFILM Corporation
- Epak Electronics
- Quanta X Technology
- UV-Design
- Propper Manufacturing
Key Milestones in UV Measurement Strip Industry
- 2020: Introduction of a new UV measurement strip with significantly improved accuracy by uv-technik international.
- 2022: FUJIFILM Corporation launched a biodegradable UV measurement strip.
- 2023: A major patent was filed by Quanta X Technology for a novel sensor design.
- 2024: Epak Electronics and UV-Design announced a strategic partnership for joint product development.
Strategic Outlook for UV Measurement Strip Market
The UV Measurement Strip market is poised for continued growth, driven by technological innovation, expanding applications, and increasing regulatory pressures. Strategic opportunities exist in developing advanced sensor technologies, expanding into niche markets, and forging strategic alliances. The focus on sustainable and cost-effective solutions will be crucial for achieving long-term market leadership. Further market expansion is expected in developing economies as awareness of UV-related risks increases.
UV Measurement Strip Segmentation
-
1. Application
- 1.1. Hospitals
- 1.2. Pharmaceutical
- 1.3. Food Industry
- 1.4. Other
-
2. Types
- 2.1. UVA
- 2.2. UVB
- 2.3. UVC
- 2.4. Other
UV Measurement Strip Segmentation By Geography
-
1. North America
- 1.1. United States
- 1.2. Canada
- 1.3. Mexico
-
2. South America
- 2.1. Brazil
- 2.2. Argentina
- 2.3. Rest of South America
-
3. Europe
- 3.1. United Kingdom
- 3.2. Germany
- 3.3. France
- 3.4. Italy
- 3.5. Spain
- 3.6. Russia
- 3.7. Benelux
- 3.8. Nordics
- 3.9. Rest of Europe
-
4. Middle East & Africa
- 4.1. Turkey
- 4.2. Israel
- 4.3. GCC
- 4.4. North Africa
- 4.5. South Africa
- 4.6. Rest of Middle East & Africa
-
5. Asia Pacific
- 5.1. China
- 5.2. India
- 5.3. Japan
- 5.4. South Korea
- 5.5. ASEAN
- 5.6. Oceania
- 5.7. Rest of Asia Pacific
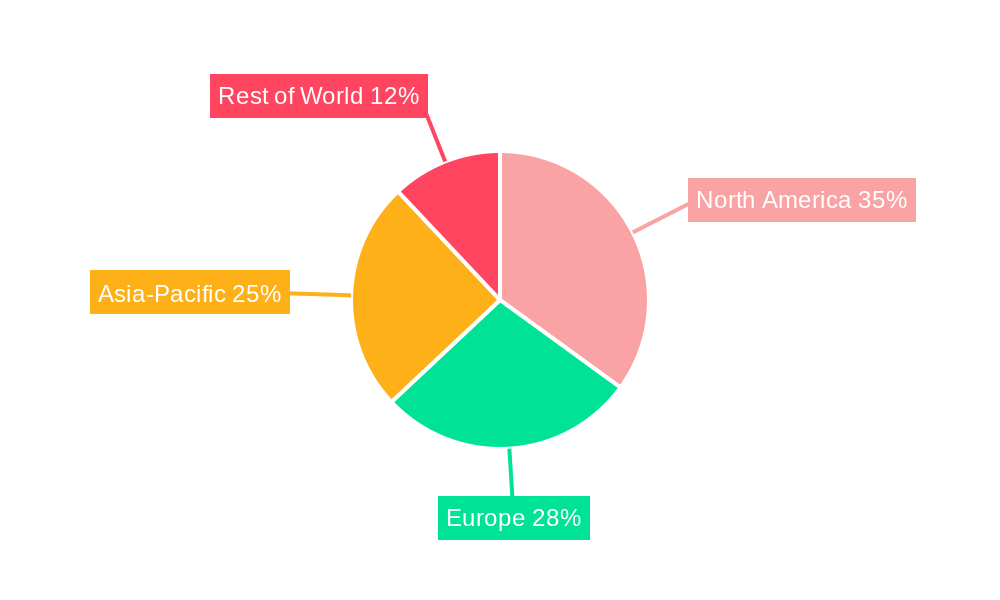
UV Measurement Strip Regional Market Share
Geographic Coverage of UV Measurement Strip
UV Measurement Strip REPORT HIGHLIGHTS
| Aspects | Details |
|---|---|
| Study Period | 2020-2034 |
| Base Year | 2025 |
| Estimated Year | 2026 |
| Forecast Period | 2026-2034 |
| Historical Period | 2020-2025 |
| Growth Rate | CAGR of 8.2% from 2020-2034 |
| Segmentation |
|
Table of Contents
- 1. Introduction
- 1.1. Research Scope
- 1.2. Market Segmentation
- 1.3. Research Objective
- 1.4. Definitions and Assumptions
- 2. Executive Summary
- 2.1. Market Snapshot
- 3. Market Dynamics
- 3.1. Market Drivers
- 3.2. Market Restrains
- 3.3. Market Trends
- 3.4. Market Opportunities
- 4. Market Factor Analysis
- 4.1. Porters Five Forces
- 4.1.1. Bargaining Power of Suppliers
- 4.1.2. Bargaining Power of Buyers
- 4.1.3. Threat of New Entrants
- 4.1.4. Threat of Substitutes
- 4.1.5. Competitive Rivalry
- 4.2. PESTEL analysis
- 4.3. BCG Analysis
- 4.3.1. Stars (High Growth, High Market Share)
- 4.3.2. Cash Cows (Low Growth, High Market Share)
- 4.3.3. Question Mark (High Growth, Low Market Share)
- 4.3.4. Dogs (Low Growth, Low Market Share)
- 4.4. Ansoff Matrix Analysis
- 4.5. Supply Chain Analysis
- 4.6. Regulatory Landscape
- 4.7. Current Market Potential and Opportunity Assessment (TAM–SAM–SOM Framework)
- 4.8. MDP Analyst Note
- 4.1. Porters Five Forces
- 5. Market Analysis, Insights and Forecast 2021-2033
- 5.1. Market Analysis, Insights and Forecast - by Application
- 5.1.1. Hospitals
- 5.1.2. Pharmaceutical
- 5.1.3. Food Industry
- 5.1.4. Other
- 5.2. Market Analysis, Insights and Forecast - by Types
- 5.2.1. UVA
- 5.2.2. UVB
- 5.2.3. UVC
- 5.2.4. Other
- 5.3. Market Analysis, Insights and Forecast - by Region
- 5.3.1. North America
- 5.3.2. South America
- 5.3.3. Europe
- 5.3.4. Middle East & Africa
- 5.3.5. Asia Pacific
- 5.1. Market Analysis, Insights and Forecast - by Application
- 6. Global UV Measurement Strip Analysis, Insights and Forecast, 2021-2033
- 6.1. Market Analysis, Insights and Forecast - by Application
- 6.1.1. Hospitals
- 6.1.2. Pharmaceutical
- 6.1.3. Food Industry
- 6.1.4. Other
- 6.2. Market Analysis, Insights and Forecast - by Types
- 6.2.1. UVA
- 6.2.2. UVB
- 6.2.3. UVC
- 6.2.4. Other
- 6.1. Market Analysis, Insights and Forecast - by Application
- 7. North America UV Measurement Strip Analysis, Insights and Forecast, 2020-2032
- 7.1. Market Analysis, Insights and Forecast - by Application
- 7.1.1. Hospitals
- 7.1.2. Pharmaceutical
- 7.1.3. Food Industry
- 7.1.4. Other
- 7.2. Market Analysis, Insights and Forecast - by Types
- 7.2.1. UVA
- 7.2.2. UVB
- 7.2.3. UVC
- 7.2.4. Other
- 7.1. Market Analysis, Insights and Forecast - by Application
- 8. South America UV Measurement Strip Analysis, Insights and Forecast, 2020-2032
- 8.1. Market Analysis, Insights and Forecast - by Application
- 8.1.1. Hospitals
- 8.1.2. Pharmaceutical
- 8.1.3. Food Industry
- 8.1.4. Other
- 8.2. Market Analysis, Insights and Forecast - by Types
- 8.2.1. UVA
- 8.2.2. UVB
- 8.2.3. UVC
- 8.2.4. Other
- 8.1. Market Analysis, Insights and Forecast - by Application
- 9. Europe UV Measurement Strip Analysis, Insights and Forecast, 2020-2032
- 9.1. Market Analysis, Insights and Forecast - by Application
- 9.1.1. Hospitals
- 9.1.2. Pharmaceutical
- 9.1.3. Food Industry
- 9.1.4. Other
- 9.2. Market Analysis, Insights and Forecast - by Types
- 9.2.1. UVA
- 9.2.2. UVB
- 9.2.3. UVC
- 9.2.4. Other
- 9.1. Market Analysis, Insights and Forecast - by Application
- 10. Middle East & Africa UV Measurement Strip Analysis, Insights and Forecast, 2020-2032
- 10.1. Market Analysis, Insights and Forecast - by Application
- 10.1.1. Hospitals
- 10.1.2. Pharmaceutical
- 10.1.3. Food Industry
- 10.1.4. Other
- 10.2. Market Analysis, Insights and Forecast - by Types
- 10.2.1. UVA
- 10.2.2. UVB
- 10.2.3. UVC
- 10.2.4. Other
- 10.1. Market Analysis, Insights and Forecast - by Application
- 11. Asia Pacific UV Measurement Strip Analysis, Insights and Forecast, 2020-2032
- 11.1. Market Analysis, Insights and Forecast - by Application
- 11.1.1. Hospitals
- 11.1.2. Pharmaceutical
- 11.1.3. Food Industry
- 11.1.4. Other
- 11.2. Market Analysis, Insights and Forecast - by Types
- 11.2.1. UVA
- 11.2.2. UVB
- 11.2.3. UVC
- 11.2.4. Other
- 11.1. Market Analysis, Insights and Forecast - by Application
- 12. Competitive Analysis
- 12.1. Company Profiles
- 12.1.1 uv-technik international
- 12.1.1.1. Company Overview
- 12.1.1.2. Products
- 12.1.1.3. Company Financials
- 12.1.1.4. SWOT Analysis
- 12.1.2 FUJIFILM Corporation
- 12.1.2.1. Company Overview
- 12.1.2.2. Products
- 12.1.2.3. Company Financials
- 12.1.2.4. SWOT Analysis
- 12.1.3 Epak Electronics
- 12.1.3.1. Company Overview
- 12.1.3.2. Products
- 12.1.3.3. Company Financials
- 12.1.3.4. SWOT Analysis
- 12.1.4 Quanta X Technology
- 12.1.4.1. Company Overview
- 12.1.4.2. Products
- 12.1.4.3. Company Financials
- 12.1.4.4. SWOT Analysis
- 12.1.5 UV-Design
- 12.1.5.1. Company Overview
- 12.1.5.2. Products
- 12.1.5.3. Company Financials
- 12.1.5.4. SWOT Analysis
- 12.1.6 Propper Manufacturing
- 12.1.6.1. Company Overview
- 12.1.6.2. Products
- 12.1.6.3. Company Financials
- 12.1.6.4. SWOT Analysis
- 12.1.1 uv-technik international
- 12.2. Market Entropy
- 12.2.1 Company's Key Areas Served
- 12.2.2 Recent Developments
- 12.3. Company Market Share Analysis 2025
- 12.3.1 Top 5 Companies Market Share Analysis
- 12.3.2 Top 3 Companies Market Share Analysis
- 12.4. List of Potential Customers
- 13. Research Methodology
List of Figures
- Figure 1: Global UV Measurement Strip Revenue Breakdown (million, %) by Region 2025 & 2033
- Figure 2: North America UV Measurement Strip Revenue (million), by Application 2025 & 2033
- Figure 3: North America UV Measurement Strip Revenue Share (%), by Application 2025 & 2033
- Figure 4: North America UV Measurement Strip Revenue (million), by Types 2025 & 2033
- Figure 5: North America UV Measurement Strip Revenue Share (%), by Types 2025 & 2033
- Figure 6: North America UV Measurement Strip Revenue (million), by Country 2025 & 2033
- Figure 7: North America UV Measurement Strip Revenue Share (%), by Country 2025 & 2033
- Figure 8: South America UV Measurement Strip Revenue (million), by Application 2025 & 2033
- Figure 9: South America UV Measurement Strip Revenue Share (%), by Application 2025 & 2033
- Figure 10: South America UV Measurement Strip Revenue (million), by Types 2025 & 2033
- Figure 11: South America UV Measurement Strip Revenue Share (%), by Types 2025 & 2033
- Figure 12: South America UV Measurement Strip Revenue (million), by Country 2025 & 2033
- Figure 13: South America UV Measurement Strip Revenue Share (%), by Country 2025 & 2033
- Figure 14: Europe UV Measurement Strip Revenue (million), by Application 2025 & 2033
- Figure 15: Europe UV Measurement Strip Revenue Share (%), by Application 2025 & 2033
- Figure 16: Europe UV Measurement Strip Revenue (million), by Types 2025 & 2033
- Figure 17: Europe UV Measurement Strip Revenue Share (%), by Types 2025 & 2033
- Figure 18: Europe UV Measurement Strip Revenue (million), by Country 2025 & 2033
- Figure 19: Europe UV Measurement Strip Revenue Share (%), by Country 2025 & 2033
- Figure 20: Middle East & Africa UV Measurement Strip Revenue (million), by Application 2025 & 2033
- Figure 21: Middle East & Africa UV Measurement Strip Revenue Share (%), by Application 2025 & 2033
- Figure 22: Middle East & Africa UV Measurement Strip Revenue (million), by Types 2025 & 2033
- Figure 23: Middle East & Africa UV Measurement Strip Revenue Share (%), by Types 2025 & 2033
- Figure 24: Middle East & Africa UV Measurement Strip Revenue (million), by Country 2025 & 2033
- Figure 25: Middle East & Africa UV Measurement Strip Revenue Share (%), by Country 2025 & 2033
- Figure 26: Asia Pacific UV Measurement Strip Revenue (million), by Application 2025 & 2033
- Figure 27: Asia Pacific UV Measurement Strip Revenue Share (%), by Application 2025 & 2033
- Figure 28: Asia Pacific UV Measurement Strip Revenue (million), by Types 2025 & 2033
- Figure 29: Asia Pacific UV Measurement Strip Revenue Share (%), by Types 2025 & 2033
- Figure 30: Asia Pacific UV Measurement Strip Revenue (million), by Country 2025 & 2033
- Figure 31: Asia Pacific UV Measurement Strip Revenue Share (%), by Country 2025 & 2033
List of Tables
- Table 1: Global UV Measurement Strip Revenue million Forecast, by Application 2020 & 2033
- Table 2: Global UV Measurement Strip Revenue million Forecast, by Types 2020 & 2033
- Table 3: Global UV Measurement Strip Revenue million Forecast, by Region 2020 & 2033
- Table 4: Global UV Measurement Strip Revenue million Forecast, by Application 2020 & 2033
- Table 5: Global UV Measurement Strip Revenue million Forecast, by Types 2020 & 2033
- Table 6: Global UV Measurement Strip Revenue million Forecast, by Country 2020 & 2033
- Table 7: United States UV Measurement Strip Revenue (million) Forecast, by Application 2020 & 2033
- Table 8: Canada UV Measurement Strip Revenue (million) Forecast, by Application 2020 & 2033
- Table 9: Mexico UV Measurement Strip Revenue (million) Forecast, by Application 2020 & 2033
- Table 10: Global UV Measurement Strip Revenue million Forecast, by Application 2020 & 2033
- Table 11: Global UV Measurement Strip Revenue million Forecast, by Types 2020 & 2033
- Table 12: Global UV Measurement Strip Revenue million Forecast, by Country 2020 & 2033
- Table 13: Brazil UV Measurement Strip Revenue (million) Forecast, by Application 2020 & 2033
- Table 14: Argentina UV Measurement Strip Revenue (million) Forecast, by Application 2020 & 2033
- Table 15: Rest of South America UV Measurement Strip Revenue (million) Forecast, by Application 2020 & 2033
- Table 16: Global UV Measurement Strip Revenue million Forecast, by Application 2020 & 2033
- Table 17: Global UV Measurement Strip Revenue million Forecast, by Types 2020 & 2033
- Table 18: Global UV Measurement Strip Revenue million Forecast, by Country 2020 & 2033
- Table 19: United Kingdom UV Measurement Strip Revenue (million) Forecast, by Application 2020 & 2033
- Table 20: Germany UV Measurement Strip Revenue (million) Forecast, by Application 2020 & 2033
- Table 21: France UV Measurement Strip Revenue (million) Forecast, by Application 2020 & 2033
- Table 22: Italy UV Measurement Strip Revenue (million) Forecast, by Application 2020 & 2033
- Table 23: Spain UV Measurement Strip Revenue (million) Forecast, by Application 2020 & 2033
- Table 24: Russia UV Measurement Strip Revenue (million) Forecast, by Application 2020 & 2033
- Table 25: Benelux UV Measurement Strip Revenue (million) Forecast, by Application 2020 & 2033
- Table 26: Nordics UV Measurement Strip Revenue (million) Forecast, by Application 2020 & 2033
- Table 27: Rest of Europe UV Measurement Strip Revenue (million) Forecast, by Application 2020 & 2033
- Table 28: Global UV Measurement Strip Revenue million Forecast, by Application 2020 & 2033
- Table 29: Global UV Measurement Strip Revenue million Forecast, by Types 2020 & 2033
- Table 30: Global UV Measurement Strip Revenue million Forecast, by Country 2020 & 2033
- Table 31: Turkey UV Measurement Strip Revenue (million) Forecast, by Application 2020 & 2033
- Table 32: Israel UV Measurement Strip Revenue (million) Forecast, by Application 2020 & 2033
- Table 33: GCC UV Measurement Strip Revenue (million) Forecast, by Application 2020 & 2033
- Table 34: North Africa UV Measurement Strip Revenue (million) Forecast, by Application 2020 & 2033
- Table 35: South Africa UV Measurement Strip Revenue (million) Forecast, by Application 2020 & 2033
- Table 36: Rest of Middle East & Africa UV Measurement Strip Revenue (million) Forecast, by Application 2020 & 2033
- Table 37: Global UV Measurement Strip Revenue million Forecast, by Application 2020 & 2033
- Table 38: Global UV Measurement Strip Revenue million Forecast, by Types 2020 & 2033
- Table 39: Global UV Measurement Strip Revenue million Forecast, by Country 2020 & 2033
- Table 40: China UV Measurement Strip Revenue (million) Forecast, by Application 2020 & 2033
- Table 41: India UV Measurement Strip Revenue (million) Forecast, by Application 2020 & 2033
- Table 42: Japan UV Measurement Strip Revenue (million) Forecast, by Application 2020 & 2033
- Table 43: South Korea UV Measurement Strip Revenue (million) Forecast, by Application 2020 & 2033
- Table 44: ASEAN UV Measurement Strip Revenue (million) Forecast, by Application 2020 & 2033
- Table 45: Oceania UV Measurement Strip Revenue (million) Forecast, by Application 2020 & 2033
- Table 46: Rest of Asia Pacific UV Measurement Strip Revenue (million) Forecast, by Application 2020 & 2033
Frequently Asked Questions
1. What is the projected Compound Annual Growth Rate (CAGR) of the UV Measurement Strip?
The projected CAGR is approximately 8.2%.
2. Which companies are prominent players in the UV Measurement Strip?
Key companies in the market include uv-technik international, FUJIFILM Corporation, Epak Electronics, Quanta X Technology, UV-Design, Propper Manufacturing.
3. What are the main segments of the UV Measurement Strip?
The market segments include Application, Types.
4. Can you provide details about the market size?
The market size is estimated to be USD 16 million as of 2022.
5. What are some drivers contributing to market growth?
N/A
6. What are the notable trends driving market growth?
N/A
7. Are there any restraints impacting market growth?
N/A
8. Can you provide examples of recent developments in the market?
N/A
9. What pricing options are available for accessing the report?
Pricing options include single-user, multi-user, and enterprise licenses priced at USD 2900.00, USD 4350.00, and USD 5800.00 respectively.
10. Is the market size provided in terms of value or volume?
The market size is provided in terms of value, measured in million.
11. Are there any specific market keywords associated with the report?
Yes, the market keyword associated with the report is "UV Measurement Strip," which aids in identifying and referencing the specific market segment covered.
12. How do I determine which pricing option suits my needs best?
The pricing options vary based on user requirements and access needs. Individual users may opt for single-user licenses, while businesses requiring broader access may choose multi-user or enterprise licenses for cost-effective access to the report.
13. Are there any additional resources or data provided in the UV Measurement Strip report?
While the report offers comprehensive insights, it's advisable to review the specific contents or supplementary materials provided to ascertain if additional resources or data are available.
14. How can I stay updated on further developments or reports in the UV Measurement Strip?
To stay informed about further developments, trends, and reports in the UV Measurement Strip, consider subscribing to industry newsletters, following relevant companies and organizations, or regularly checking reputable industry news sources and publications.
Methodology
Step 1 - Identification of Relevant Samples Size from Population Database


Step 2 - Approaches for Defining Global Market Size (Value, Volume* & Price*)

Note*: In applicable scenarios
Step 3 - Data Sources
Primary Research
- Web Analytics
- Survey Reports
- Research Institute
- Latest Research Reports
- Opinion Leaders
Secondary Research
- Annual Reports
- White Paper
- Latest Press Release
- Industry Association
- Paid Database
- Investor Presentations

Step 4 - Data Triangulation
Involves using different sources of information in order to increase the validity of a study
These sources are likely to be stakeholders in a program - participants, other researchers, program staff, other community members, and so on.
Then we put all data in single framework & apply various statistical tools to find out the dynamic on the market.
During the analysis stage, feedback from the stakeholder groups would be compared to determine areas of agreement as well as areas of divergence