

Key Insights
The global Utility Asset Management market is poised for robust expansion, projected to reach $2751.3 million by 2033, driven by a Compound Annual Growth Rate (CAGR) of 6.6%. This significant growth is fueled by an increasing need for efficient management of aging energy infrastructure, the imperative to reduce operational costs, and the growing adoption of advanced technologies like IoT and AI for predictive maintenance. Utilities worldwide are investing heavily in sophisticated asset management systems to enhance reliability, extend the lifespan of critical components such as transformers, sub-stations, and transmission & distribution lines, and ensure compliance with stringent regulatory standards. The shift towards smart grids and renewable energy integration further amplifies the demand for comprehensive utility asset management solutions to monitor and maintain a diverse and distributed asset base.
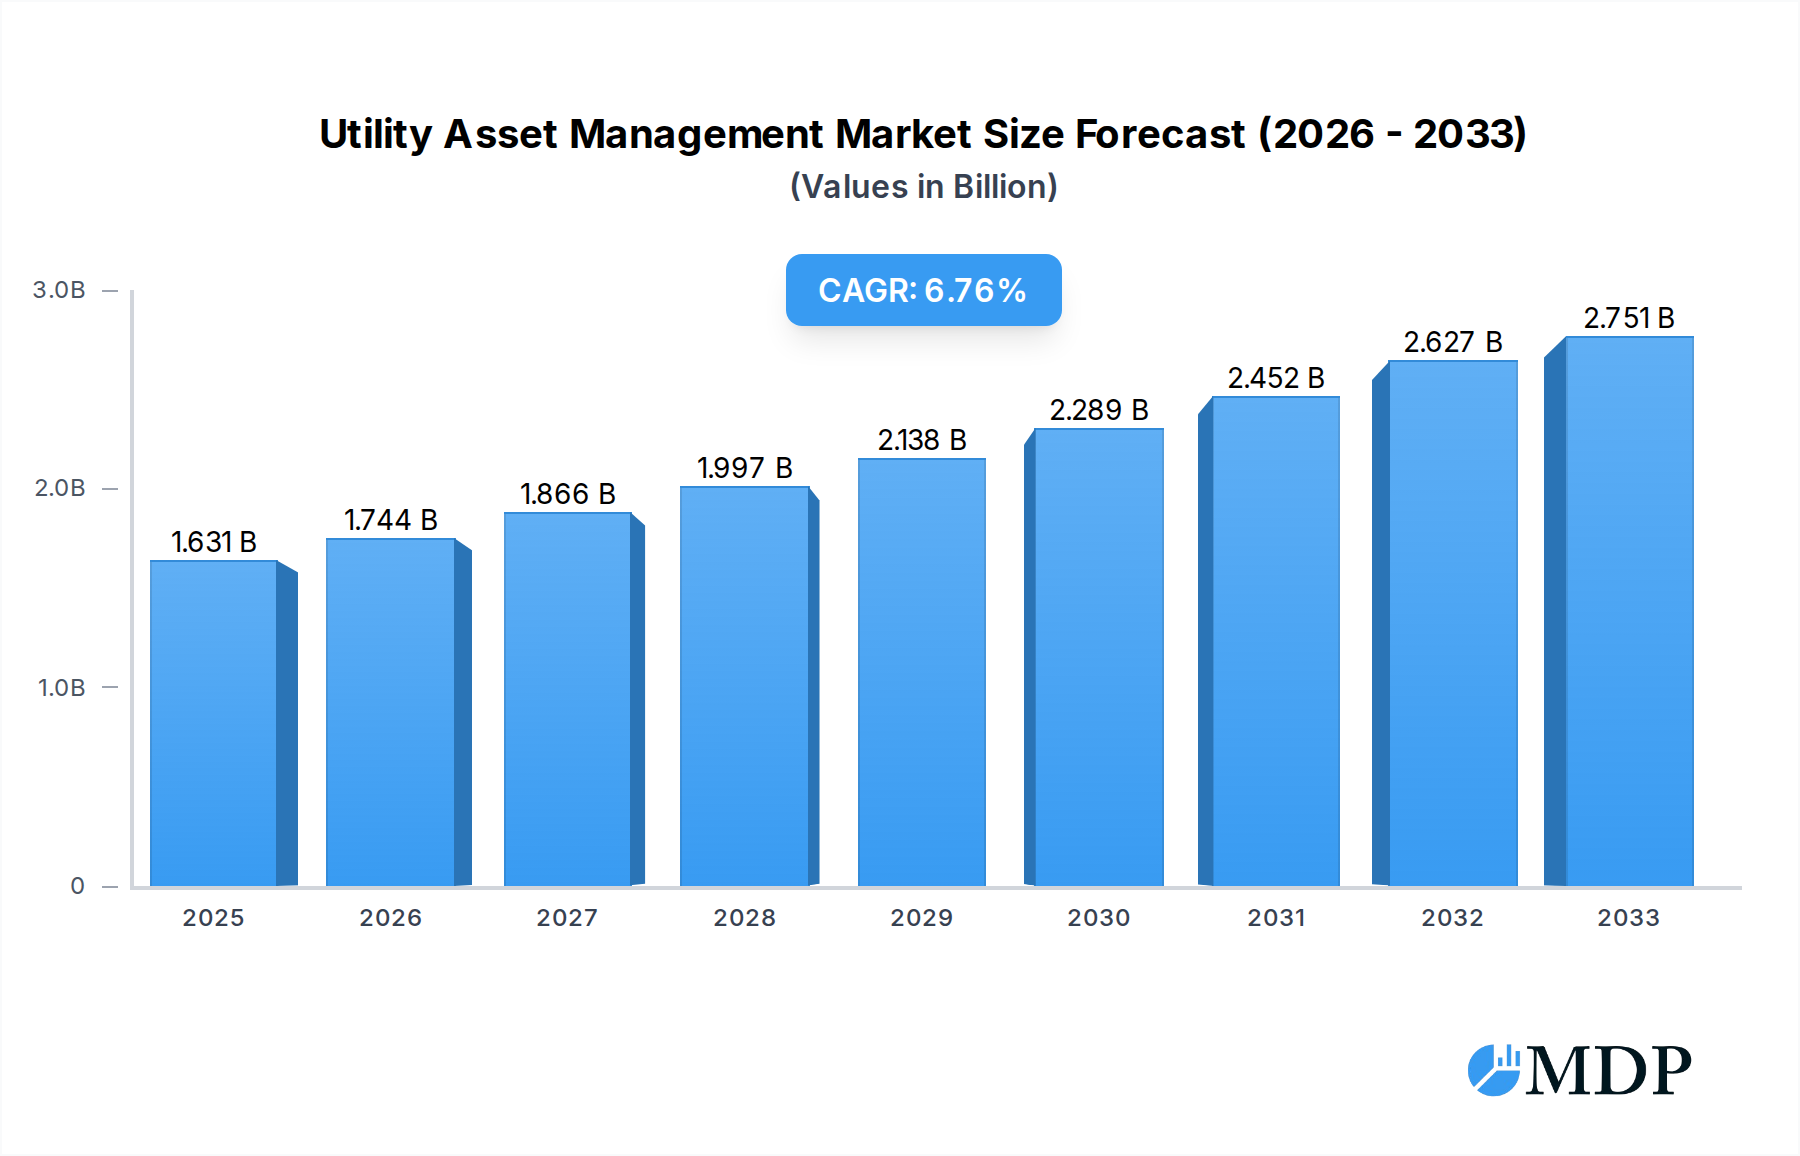
Utility Asset Management Market Size (In Billion)
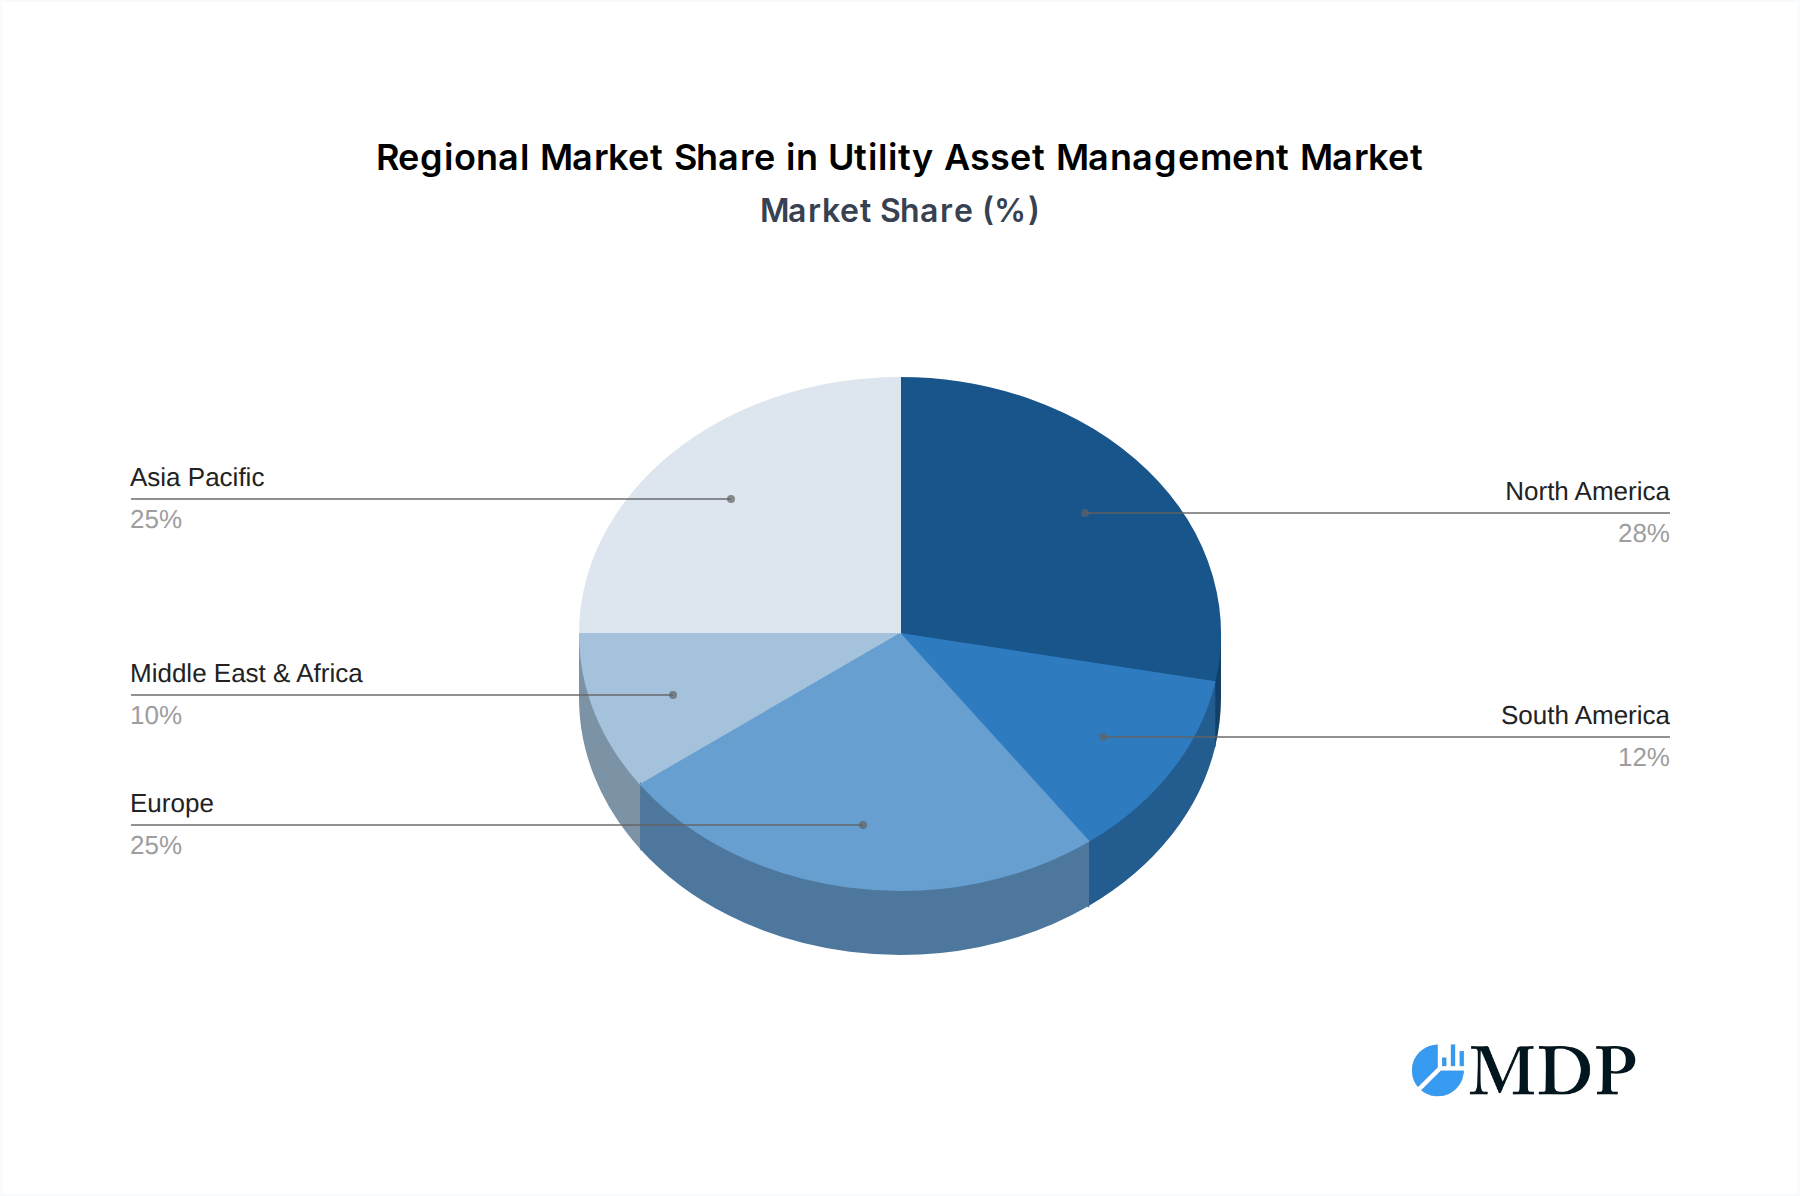
The market is segmented into key applications including Transformers, Sub-Stations, Transmission & Distribution Lines, and Others, with Hardware and Software comprising the primary types of solutions. Leading companies like ABB, Siemens, and General Electric are at the forefront, offering innovative software platforms and hardware components designed to optimize asset performance and minimize downtime. Geographically, Asia Pacific is expected to emerge as a dominant region due to rapid industrialization and increasing energy demand, closely followed by North America and Europe, which are characterized by significant investments in grid modernization and the replacement of aging infrastructure. Emerging markets in South America and the Middle East & Africa also present substantial growth opportunities as these regions focus on developing and upgrading their energy networks. The market's trajectory is marked by a strong emphasis on digitalization and the pursuit of operational excellence in the utility sector.

Utility Asset Management Company Market Share
Invest in the evolution of critical infrastructure. This in-depth report provides essential insights into the burgeoning Utility Asset Management market, a sector projected to reach a staggering $500 billion by 2033. Discover the strategies, innovations, and market dynamics shaping the future of power grids, transmission, and distribution networks. This analysis covers the historical period of 2019–2024, with a base year of 2025 and a comprehensive forecast period from 2025–2033, offering a 10-year strategic outlook.
Utility Asset Management Market Dynamics & Concentration
The Utility Asset Management market is characterized by a dynamic interplay of innovation, evolving regulatory landscapes, and a growing demand for operational efficiency. Market concentration remains moderate, with key players like ABB, Siemens, and General Electric holding significant influence, alongside specialized firms such as Sentient Energy, Aclara, and Emerson. Innovation is primarily driven by the imperative to enhance grid reliability, reduce operational costs, and integrate renewable energy sources seamlessly. Regulatory frameworks, particularly those focused on grid modernization and decarbonization, are increasingly shaping investment priorities. Product substitutes, while not direct replacements, are emerging in the form of advanced analytics and IoT solutions that optimize existing assets. End-user trends reveal a strong preference for predictive maintenance and digital twin technologies to extend asset lifecycles and prevent failures. Mergers and acquisitions (M&A) activities are on the rise, with an estimated XX M&A deals in the past five years, reflecting a strategic consolidation to acquire new technologies and expand market reach. Key players are investing heavily in research and development, aiming to capitalize on the projected market growth.
- Market Share Snapshot: Major players like ABB and Siemens collectively hold an estimated 35% market share.
- M&A Trends: XX strategic acquisitions in the last five years, indicating a push for technological integration and market consolidation.
- Innovation Focus: Predictive analytics, AI-powered diagnostics, and cybersecurity for critical infrastructure are paramount.
- Regulatory Impact: Mandates for grid resilience and carbon emission reductions are significant growth catalysts.
Utility Asset Management Industry Trends & Analysis
The Utility Asset Management industry is experiencing robust growth, projected to expand at a Compound Annual Growth Rate (CAGR) of approximately 12% from 2025 to 2033. This expansion is fueled by a confluence of factors, including the aging infrastructure of power grids worldwide, the increasing complexity of energy networks due to the integration of distributed energy resources (DERs) like solar and wind power, and the growing imperative for enhanced grid reliability and resilience in the face of climate change and extreme weather events. Technological disruptions are at the forefront of this transformation. The adoption of the Internet of Things (IoT) devices, advanced sensor technologies, and big data analytics is enabling utility companies to gain unprecedented visibility into the health and performance of their assets, from transformers and substations to transmission and distribution lines. Artificial intelligence (AI) and machine learning (ML) are revolutionizing predictive maintenance, allowing for early detection of potential failures and proactive interventions, thereby minimizing costly downtime and extending asset lifecycles. Consumer preferences are also shifting, with an increased demand for uninterrupted power supply and greater transparency in energy consumption, pushing utilities to invest in more robust and responsive asset management systems. Competitive dynamics are intensifying, with established players and emerging tech companies vying for market share by offering integrated solutions that combine hardware, software, and data analytics. The market penetration of advanced utility asset management solutions is expected to reach XX% by 2033. The global market size for utility asset management is estimated to reach $500 billion by 2033, a significant increase from $250 billion in 2024. The increasing focus on smart grid technologies and the digitalization of energy infrastructure are key drivers underpinning this substantial market expansion.
Leading Markets & Segments in Utility Asset Management
The Utility Asset Management market exhibits significant regional dominance, with North America currently leading due to its mature grid infrastructure, substantial investments in grid modernization, and stringent regulatory requirements for reliability. The United States, in particular, is a powerhouse in this segment, driven by its vast transmission and distribution networks and a proactive approach to adopting advanced technologies. Economically, strong government initiatives and utility investments in upgrading aging infrastructure, estimated at over $100 billion annually, are key drivers. In terms of Applications, the Transformer segment is experiencing substantial growth, driven by the need for advanced monitoring and maintenance to ensure optimal performance and prevent costly failures, projected to account for 30% of the market by 2033. The Sub-Station segment also holds significant market share, estimated at 25%, due to the critical role substations play in power distribution and the increasing integration of smart grid technologies. Transmission & Distribution Lines are another crucial segment, representing 35% of the market, as utilities focus on enhancing their efficiency, reliability, and resilience against environmental factors. The Others segment, encompassing assets like generation facilities and energy storage systems, is growing at a faster pace, driven by the rise of renewable energy integration.
In terms of Types, Hardware solutions, including sensors, monitoring devices, and communication equipment, currently dominate the market, accounting for approximately 55% of the total market value. This is driven by the foundational need for data collection and real-time monitoring capabilities. However, the Software segment is exhibiting the highest growth rate, projected to grow at a CAGR of 15%, fueled by the increasing demand for advanced analytics, AI-powered predictive maintenance platforms, asset performance management (APM) systems, and cloud-based solutions. This shift signifies a move towards data-driven decision-making and sophisticated operational intelligence. The development of integrated hardware and software solutions further enhances their competitive advantage.
- Dominant Region: North America, driven by the USA's extensive grid infrastructure and modernization initiatives.
- Key Application Drivers:
- Transformers: Aging assets, critical role in power flow, demand for predictive maintenance.
- Sub-Stations: Integration of smart grid technologies, cybersecurity needs.
- Transmission & Distribution Lines: Resilience against weather, efficiency improvements.
- Dominant Type: Hardware, with significant ongoing investment in advanced sensors and monitoring devices.
- Fastest Growing Type: Software, propelled by AI, ML, and cloud-based analytics solutions.
Utility Asset Management Product Developments
Product development in Utility Asset Management is characterized by a relentless pursuit of enhanced predictive capabilities, improved data analytics, and seamless integration. Companies like Sentient Energy are leading with advanced sensor technologies for real-time grid monitoring, while Aclara offers sophisticated meter data management solutions that provide granular insights into energy consumption and asset performance. Emerson is innovating in the realm of condition monitoring for critical assets, and Siemens and ABB are continuously developing integrated software platforms that leverage AI for proactive maintenance and optimized grid operations. The competitive advantage lies in offering solutions that not only identify potential issues but also prescribe optimal mitigation strategies, thereby reducing downtime and operational costs.
Key Drivers of Utility Asset Management Growth
The utility asset management market is propelled by several powerful drivers. Technological advancements, particularly in IoT, AI, and big data analytics, are enabling more sophisticated monitoring, diagnostics, and predictive maintenance. Aging infrastructure globally necessitates significant investment in upgrades and replacements to ensure grid reliability and prevent failures. Increasing demand for grid reliability and resilience is paramount, driven by factors like climate change, extreme weather events, and the need for uninterrupted power supply. Furthermore, regulatory mandates pushing for grid modernization, decarbonization, and improved safety standards are accelerating adoption. The rise of distributed energy resources (DERs) and the complexity of integrating them into the grid also require advanced asset management capabilities.
Challenges in the Utility Asset Management Market
Despite its growth, the Utility Asset Management market faces several challenges. High initial investment costs for advanced hardware and software solutions can be a barrier for some utilities. Cybersecurity threats to critical infrastructure are a growing concern, requiring robust security protocols and continuous vigilance. Integration complexity with legacy systems can pose significant technical hurdles. Lack of skilled workforce to manage and interpret the vast amounts of data generated by these systems is another constraint. Furthermore, resistance to change within established utility organizations can slow down the adoption of new technologies and processes. Regulatory uncertainties and evolving compliance requirements can also create adoption delays.
Emerging Opportunities in Utility Asset Management
Emerging opportunities in Utility Asset Management are abundant, primarily driven by technological breakthroughs and evolving market needs. The expansion of smart grid initiatives worldwide presents a significant avenue for growth, as utilities invest in digital technologies for enhanced grid control and efficiency. The increasing adoption of renewable energy sources, such as solar and wind power, necessitates sophisticated asset management to ensure grid stability and integration. Data analytics and AI-driven insights offer immense potential for optimizing asset performance, reducing maintenance costs, and improving operational efficiency. Strategic partnerships between technology providers and utility companies are fostering innovation and creating integrated solutions. Furthermore, the growing focus on sustainability and decarbonization is creating opportunities for asset management solutions that support the transition to a cleaner energy future. The global market is also seeing increased investment in predictive maintenance as a proactive approach to asset upkeep.
Leading Players in the Utility Asset Management Sector
- ABB
- Siemens
- General Electric
- S&C Electric Company
- Sentient Energy
- Aclara
- Emerson
- Enetics
- Lindsey Manufacturing
- Netcontrol
- Cniguard
- Vaisala
Key Milestones in Utility Asset Management Industry
- 2019: Increased adoption of AI for predictive maintenance in transformers and substations.
- 2020: Rise in IoT deployments for real-time monitoring of transmission lines.
- 2021: Major utility companies launch initiatives for digital twin implementations.
- 2022: Significant M&A activity as larger tech firms acquire specialized asset management startups.
- 2023: Enhanced focus on cybersecurity for grid management systems.
- 2024: Growing demand for cloud-based asset performance management (APM) solutions.
Strategic Outlook for Utility Asset Management Market
The strategic outlook for the Utility Asset Management market is exceptionally positive, driven by the continued need for grid modernization, enhanced reliability, and the integration of renewable energy. The market will witness sustained growth fueled by technological innovation in AI, IoT, and advanced analytics, enabling utilities to transition from reactive to proactive asset management. Strategic opportunities lie in developing integrated solutions that encompass hardware, software, and data services, offering end-to-end asset lifecycle management. Furthermore, fostering collaborations between technology providers and utilities, coupled with strategic acquisitions, will be crucial for market expansion. The increasing global focus on sustainable energy infrastructure and smart grid development presents a substantial long-term growth trajectory for this vital sector.
Utility Asset Management Segmentation
-
1. Application
- 1.1. Transformer
- 1.2. Sub-Station
- 1.3. Transmission & Distribution Lines
- 1.4. Others
-
2. Types
- 2.1. Hardware
- 2.2. Software
Utility Asset Management Segmentation By Geography
-
1. North America
- 1.1. United States
- 1.2. Canada
- 1.3. Mexico
-
2. South America
- 2.1. Brazil
- 2.2. Argentina
- 2.3. Rest of South America
-
3. Europe
- 3.1. United Kingdom
- 3.2. Germany
- 3.3. France
- 3.4. Italy
- 3.5. Spain
- 3.6. Russia
- 3.7. Benelux
- 3.8. Nordics
- 3.9. Rest of Europe
-
4. Middle East & Africa
- 4.1. Turkey
- 4.2. Israel
- 4.3. GCC
- 4.4. North Africa
- 4.5. South Africa
- 4.6. Rest of Middle East & Africa
-
5. Asia Pacific
- 5.1. China
- 5.2. India
- 5.3. Japan
- 5.4. South Korea
- 5.5. ASEAN
- 5.6. Oceania
- 5.7. Rest of Asia Pacific
Utility Asset Management Regional Market Share
Geographic Coverage of Utility Asset Management
Utility Asset Management REPORT HIGHLIGHTS
| Aspects | Details |
|---|---|
| Study Period | 2020-2034 |
| Base Year | 2025 |
| Estimated Year | 2026 |
| Forecast Period | 2026-2034 |
| Historical Period | 2020-2025 |
| Growth Rate | CAGR of 6.6% from 2020-2034 |
| Segmentation |
|
Table of Contents
- 1. Introduction
- 1.1. Research Scope
- 1.2. Market Segmentation
- 1.3. Research Methodology
- 1.4. Definitions and Assumptions
- 2. Executive Summary
- 2.1. Introduction
- 3. Market Dynamics
- 3.1. Introduction
- 3.2. Market Drivers
- 3.3. Market Restrains
- 3.4. Market Trends
- 4. Market Factor Analysis
- 4.1. Porters Five Forces
- 4.2. Supply/Value Chain
- 4.3. PESTEL analysis
- 4.4. Market Entropy
- 4.5. Patent/Trademark Analysis
- 5. Global Utility Asset Management Analysis, Insights and Forecast, 2020-2032
- 5.1. Market Analysis, Insights and Forecast - by Application
- 5.1.1. Transformer
- 5.1.2. Sub-Station
- 5.1.3. Transmission & Distribution Lines
- 5.1.4. Others
- 5.2. Market Analysis, Insights and Forecast - by Types
- 5.2.1. Hardware
- 5.2.2. Software
- 5.3. Market Analysis, Insights and Forecast - by Region
- 5.3.1. North America
- 5.3.2. South America
- 5.3.3. Europe
- 5.3.4. Middle East & Africa
- 5.3.5. Asia Pacific
- 5.1. Market Analysis, Insights and Forecast - by Application
- 6. North America Utility Asset Management Analysis, Insights and Forecast, 2020-2032
- 6.1. Market Analysis, Insights and Forecast - by Application
- 6.1.1. Transformer
- 6.1.2. Sub-Station
- 6.1.3. Transmission & Distribution Lines
- 6.1.4. Others
- 6.2. Market Analysis, Insights and Forecast - by Types
- 6.2.1. Hardware
- 6.2.2. Software
- 6.1. Market Analysis, Insights and Forecast - by Application
- 7. South America Utility Asset Management Analysis, Insights and Forecast, 2020-2032
- 7.1. Market Analysis, Insights and Forecast - by Application
- 7.1.1. Transformer
- 7.1.2. Sub-Station
- 7.1.3. Transmission & Distribution Lines
- 7.1.4. Others
- 7.2. Market Analysis, Insights and Forecast - by Types
- 7.2.1. Hardware
- 7.2.2. Software
- 7.1. Market Analysis, Insights and Forecast - by Application
- 8. Europe Utility Asset Management Analysis, Insights and Forecast, 2020-2032
- 8.1. Market Analysis, Insights and Forecast - by Application
- 8.1.1. Transformer
- 8.1.2. Sub-Station
- 8.1.3. Transmission & Distribution Lines
- 8.1.4. Others
- 8.2. Market Analysis, Insights and Forecast - by Types
- 8.2.1. Hardware
- 8.2.2. Software
- 8.1. Market Analysis, Insights and Forecast - by Application
- 9. Middle East & Africa Utility Asset Management Analysis, Insights and Forecast, 2020-2032
- 9.1. Market Analysis, Insights and Forecast - by Application
- 9.1.1. Transformer
- 9.1.2. Sub-Station
- 9.1.3. Transmission & Distribution Lines
- 9.1.4. Others
- 9.2. Market Analysis, Insights and Forecast - by Types
- 9.2.1. Hardware
- 9.2.2. Software
- 9.1. Market Analysis, Insights and Forecast - by Application
- 10. Asia Pacific Utility Asset Management Analysis, Insights and Forecast, 2020-2032
- 10.1. Market Analysis, Insights and Forecast - by Application
- 10.1.1. Transformer
- 10.1.2. Sub-Station
- 10.1.3. Transmission & Distribution Lines
- 10.1.4. Others
- 10.2. Market Analysis, Insights and Forecast - by Types
- 10.2.1. Hardware
- 10.2.2. Software
- 10.1. Market Analysis, Insights and Forecast - by Application
- 11. Competitive Analysis
- 11.1. Global Market Share Analysis 2025
- 11.2. Company Profiles
- 11.2.1 ABB
- 11.2.1.1. Overview
- 11.2.1.2. Products
- 11.2.1.3. SWOT Analysis
- 11.2.1.4. Recent Developments
- 11.2.1.5. Financials (Based on Availability)
- 11.2.2 Siemens
- 11.2.2.1. Overview
- 11.2.2.2. Products
- 11.2.2.3. SWOT Analysis
- 11.2.2.4. Recent Developments
- 11.2.2.5. Financials (Based on Availability)
- 11.2.3 General Electric
- 11.2.3.1. Overview
- 11.2.3.2. Products
- 11.2.3.3. SWOT Analysis
- 11.2.3.4. Recent Developments
- 11.2.3.5. Financials (Based on Availability)
- 11.2.4 S&C
- 11.2.4.1. Overview
- 11.2.4.2. Products
- 11.2.4.3. SWOT Analysis
- 11.2.4.4. Recent Developments
- 11.2.4.5. Financials (Based on Availability)
- 11.2.5 Sentient Energy
- 11.2.5.1. Overview
- 11.2.5.2. Products
- 11.2.5.3. SWOT Analysis
- 11.2.5.4. Recent Developments
- 11.2.5.5. Financials (Based on Availability)
- 11.2.6 Aclara
- 11.2.6.1. Overview
- 11.2.6.2. Products
- 11.2.6.3. SWOT Analysis
- 11.2.6.4. Recent Developments
- 11.2.6.5. Financials (Based on Availability)
- 11.2.7 Emerson
- 11.2.7.1. Overview
- 11.2.7.2. Products
- 11.2.7.3. SWOT Analysis
- 11.2.7.4. Recent Developments
- 11.2.7.5. Financials (Based on Availability)
- 11.2.8 Enetics
- 11.2.8.1. Overview
- 11.2.8.2. Products
- 11.2.8.3. SWOT Analysis
- 11.2.8.4. Recent Developments
- 11.2.8.5. Financials (Based on Availability)
- 11.2.9 Lindsey Manufacturing
- 11.2.9.1. Overview
- 11.2.9.2. Products
- 11.2.9.3. SWOT Analysis
- 11.2.9.4. Recent Developments
- 11.2.9.5. Financials (Based on Availability)
- 11.2.10 Netcontrol
- 11.2.10.1. Overview
- 11.2.10.2. Products
- 11.2.10.3. SWOT Analysis
- 11.2.10.4. Recent Developments
- 11.2.10.5. Financials (Based on Availability)
- 11.2.11 Cniguard
- 11.2.11.1. Overview
- 11.2.11.2. Products
- 11.2.11.3. SWOT Analysis
- 11.2.11.4. Recent Developments
- 11.2.11.5. Financials (Based on Availability)
- 11.2.12 Vaisala
- 11.2.12.1. Overview
- 11.2.12.2. Products
- 11.2.12.3. SWOT Analysis
- 11.2.12.4. Recent Developments
- 11.2.12.5. Financials (Based on Availability)
- 11.2.1 ABB
List of Figures
- Figure 1: Global Utility Asset Management Revenue Breakdown (million, %) by Region 2025 & 2033
- Figure 2: North America Utility Asset Management Revenue (million), by Application 2025 & 2033
- Figure 3: North America Utility Asset Management Revenue Share (%), by Application 2025 & 2033
- Figure 4: North America Utility Asset Management Revenue (million), by Types 2025 & 2033
- Figure 5: North America Utility Asset Management Revenue Share (%), by Types 2025 & 2033
- Figure 6: North America Utility Asset Management Revenue (million), by Country 2025 & 2033
- Figure 7: North America Utility Asset Management Revenue Share (%), by Country 2025 & 2033
- Figure 8: South America Utility Asset Management Revenue (million), by Application 2025 & 2033
- Figure 9: South America Utility Asset Management Revenue Share (%), by Application 2025 & 2033
- Figure 10: South America Utility Asset Management Revenue (million), by Types 2025 & 2033
- Figure 11: South America Utility Asset Management Revenue Share (%), by Types 2025 & 2033
- Figure 12: South America Utility Asset Management Revenue (million), by Country 2025 & 2033
- Figure 13: South America Utility Asset Management Revenue Share (%), by Country 2025 & 2033
- Figure 14: Europe Utility Asset Management Revenue (million), by Application 2025 & 2033
- Figure 15: Europe Utility Asset Management Revenue Share (%), by Application 2025 & 2033
- Figure 16: Europe Utility Asset Management Revenue (million), by Types 2025 & 2033
- Figure 17: Europe Utility Asset Management Revenue Share (%), by Types 2025 & 2033
- Figure 18: Europe Utility Asset Management Revenue (million), by Country 2025 & 2033
- Figure 19: Europe Utility Asset Management Revenue Share (%), by Country 2025 & 2033
- Figure 20: Middle East & Africa Utility Asset Management Revenue (million), by Application 2025 & 2033
- Figure 21: Middle East & Africa Utility Asset Management Revenue Share (%), by Application 2025 & 2033
- Figure 22: Middle East & Africa Utility Asset Management Revenue (million), by Types 2025 & 2033
- Figure 23: Middle East & Africa Utility Asset Management Revenue Share (%), by Types 2025 & 2033
- Figure 24: Middle East & Africa Utility Asset Management Revenue (million), by Country 2025 & 2033
- Figure 25: Middle East & Africa Utility Asset Management Revenue Share (%), by Country 2025 & 2033
- Figure 26: Asia Pacific Utility Asset Management Revenue (million), by Application 2025 & 2033
- Figure 27: Asia Pacific Utility Asset Management Revenue Share (%), by Application 2025 & 2033
- Figure 28: Asia Pacific Utility Asset Management Revenue (million), by Types 2025 & 2033
- Figure 29: Asia Pacific Utility Asset Management Revenue Share (%), by Types 2025 & 2033
- Figure 30: Asia Pacific Utility Asset Management Revenue (million), by Country 2025 & 2033
- Figure 31: Asia Pacific Utility Asset Management Revenue Share (%), by Country 2025 & 2033
List of Tables
- Table 1: Global Utility Asset Management Revenue million Forecast, by Application 2020 & 2033
- Table 2: Global Utility Asset Management Revenue million Forecast, by Types 2020 & 2033
- Table 3: Global Utility Asset Management Revenue million Forecast, by Region 2020 & 2033
- Table 4: Global Utility Asset Management Revenue million Forecast, by Application 2020 & 2033
- Table 5: Global Utility Asset Management Revenue million Forecast, by Types 2020 & 2033
- Table 6: Global Utility Asset Management Revenue million Forecast, by Country 2020 & 2033
- Table 7: United States Utility Asset Management Revenue (million) Forecast, by Application 2020 & 2033
- Table 8: Canada Utility Asset Management Revenue (million) Forecast, by Application 2020 & 2033
- Table 9: Mexico Utility Asset Management Revenue (million) Forecast, by Application 2020 & 2033
- Table 10: Global Utility Asset Management Revenue million Forecast, by Application 2020 & 2033
- Table 11: Global Utility Asset Management Revenue million Forecast, by Types 2020 & 2033
- Table 12: Global Utility Asset Management Revenue million Forecast, by Country 2020 & 2033
- Table 13: Brazil Utility Asset Management Revenue (million) Forecast, by Application 2020 & 2033
- Table 14: Argentina Utility Asset Management Revenue (million) Forecast, by Application 2020 & 2033
- Table 15: Rest of South America Utility Asset Management Revenue (million) Forecast, by Application 2020 & 2033
- Table 16: Global Utility Asset Management Revenue million Forecast, by Application 2020 & 2033
- Table 17: Global Utility Asset Management Revenue million Forecast, by Types 2020 & 2033
- Table 18: Global Utility Asset Management Revenue million Forecast, by Country 2020 & 2033
- Table 19: United Kingdom Utility Asset Management Revenue (million) Forecast, by Application 2020 & 2033
- Table 20: Germany Utility Asset Management Revenue (million) Forecast, by Application 2020 & 2033
- Table 21: France Utility Asset Management Revenue (million) Forecast, by Application 2020 & 2033
- Table 22: Italy Utility Asset Management Revenue (million) Forecast, by Application 2020 & 2033
- Table 23: Spain Utility Asset Management Revenue (million) Forecast, by Application 2020 & 2033
- Table 24: Russia Utility Asset Management Revenue (million) Forecast, by Application 2020 & 2033
- Table 25: Benelux Utility Asset Management Revenue (million) Forecast, by Application 2020 & 2033
- Table 26: Nordics Utility Asset Management Revenue (million) Forecast, by Application 2020 & 2033
- Table 27: Rest of Europe Utility Asset Management Revenue (million) Forecast, by Application 2020 & 2033
- Table 28: Global Utility Asset Management Revenue million Forecast, by Application 2020 & 2033
- Table 29: Global Utility Asset Management Revenue million Forecast, by Types 2020 & 2033
- Table 30: Global Utility Asset Management Revenue million Forecast, by Country 2020 & 2033
- Table 31: Turkey Utility Asset Management Revenue (million) Forecast, by Application 2020 & 2033
- Table 32: Israel Utility Asset Management Revenue (million) Forecast, by Application 2020 & 2033
- Table 33: GCC Utility Asset Management Revenue (million) Forecast, by Application 2020 & 2033
- Table 34: North Africa Utility Asset Management Revenue (million) Forecast, by Application 2020 & 2033
- Table 35: South Africa Utility Asset Management Revenue (million) Forecast, by Application 2020 & 2033
- Table 36: Rest of Middle East & Africa Utility Asset Management Revenue (million) Forecast, by Application 2020 & 2033
- Table 37: Global Utility Asset Management Revenue million Forecast, by Application 2020 & 2033
- Table 38: Global Utility Asset Management Revenue million Forecast, by Types 2020 & 2033
- Table 39: Global Utility Asset Management Revenue million Forecast, by Country 2020 & 2033
- Table 40: China Utility Asset Management Revenue (million) Forecast, by Application 2020 & 2033
- Table 41: India Utility Asset Management Revenue (million) Forecast, by Application 2020 & 2033
- Table 42: Japan Utility Asset Management Revenue (million) Forecast, by Application 2020 & 2033
- Table 43: South Korea Utility Asset Management Revenue (million) Forecast, by Application 2020 & 2033
- Table 44: ASEAN Utility Asset Management Revenue (million) Forecast, by Application 2020 & 2033
- Table 45: Oceania Utility Asset Management Revenue (million) Forecast, by Application 2020 & 2033
- Table 46: Rest of Asia Pacific Utility Asset Management Revenue (million) Forecast, by Application 2020 & 2033
Frequently Asked Questions
1. What is the projected Compound Annual Growth Rate (CAGR) of the Utility Asset Management?
The projected CAGR is approximately 6.6%.
2. Which companies are prominent players in the Utility Asset Management?
Key companies in the market include ABB, Siemens, General Electric, S&C, Sentient Energy, Aclara, Emerson, Enetics, Lindsey Manufacturing, Netcontrol, Cniguard, Vaisala.
3. What are the main segments of the Utility Asset Management?
The market segments include Application, Types.
4. Can you provide details about the market size?
The market size is estimated to be USD 2751.3 million as of 2022.
5. What are some drivers contributing to market growth?
N/A
6. What are the notable trends driving market growth?
N/A
7. Are there any restraints impacting market growth?
N/A
8. Can you provide examples of recent developments in the market?
N/A
9. What pricing options are available for accessing the report?
Pricing options include single-user, multi-user, and enterprise licenses priced at USD 2900.00, USD 4350.00, and USD 5800.00 respectively.
10. Is the market size provided in terms of value or volume?
The market size is provided in terms of value, measured in million.
11. Are there any specific market keywords associated with the report?
Yes, the market keyword associated with the report is "Utility Asset Management," which aids in identifying and referencing the specific market segment covered.
12. How do I determine which pricing option suits my needs best?
The pricing options vary based on user requirements and access needs. Individual users may opt for single-user licenses, while businesses requiring broader access may choose multi-user or enterprise licenses for cost-effective access to the report.
13. Are there any additional resources or data provided in the Utility Asset Management report?
While the report offers comprehensive insights, it's advisable to review the specific contents or supplementary materials provided to ascertain if additional resources or data are available.
14. How can I stay updated on further developments or reports in the Utility Asset Management?
To stay informed about further developments, trends, and reports in the Utility Asset Management, consider subscribing to industry newsletters, following relevant companies and organizations, or regularly checking reputable industry news sources and publications.
Methodology
Step 1 - Identification of Relevant Samples Size from Population Database


Step 2 - Approaches for Defining Global Market Size (Value, Volume* & Price*)

Note*: In applicable scenarios
Step 3 - Data Sources
Primary Research
- Web Analytics
- Survey Reports
- Research Institute
- Latest Research Reports
- Opinion Leaders
Secondary Research
- Annual Reports
- White Paper
- Latest Press Release
- Industry Association
- Paid Database
- Investor Presentations

Step 4 - Data Triangulation
Involves using different sources of information in order to increase the validity of a study
These sources are likely to be stakeholders in a program - participants, other researchers, program staff, other community members, and so on.
Then we put all data in single framework & apply various statistical tools to find out the dynamic on the market.
During the analysis stage, feedback from the stakeholder groups would be compared to determine areas of agreement as well as areas of divergence