

Key Insights
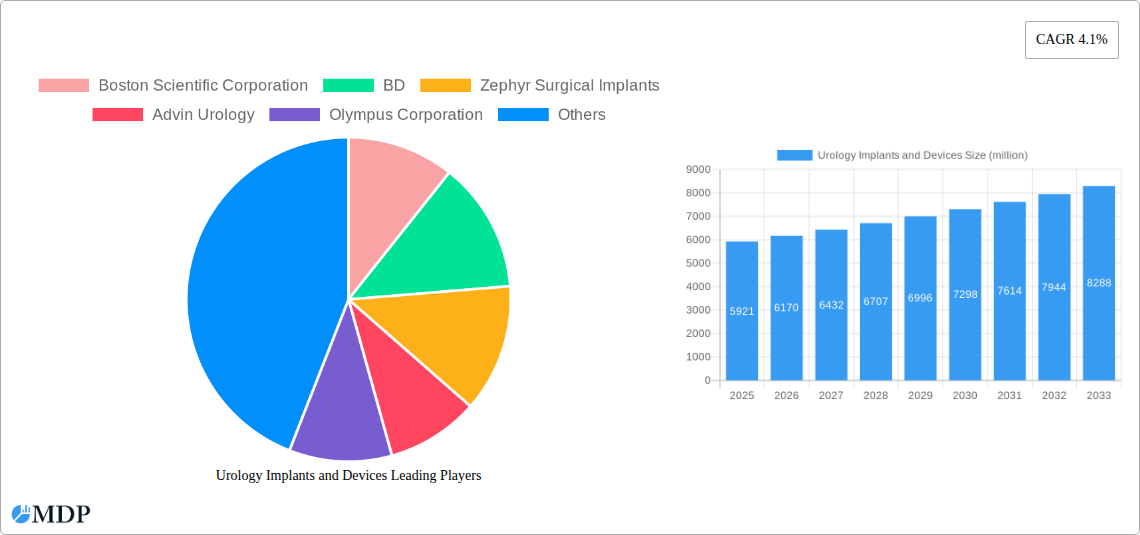
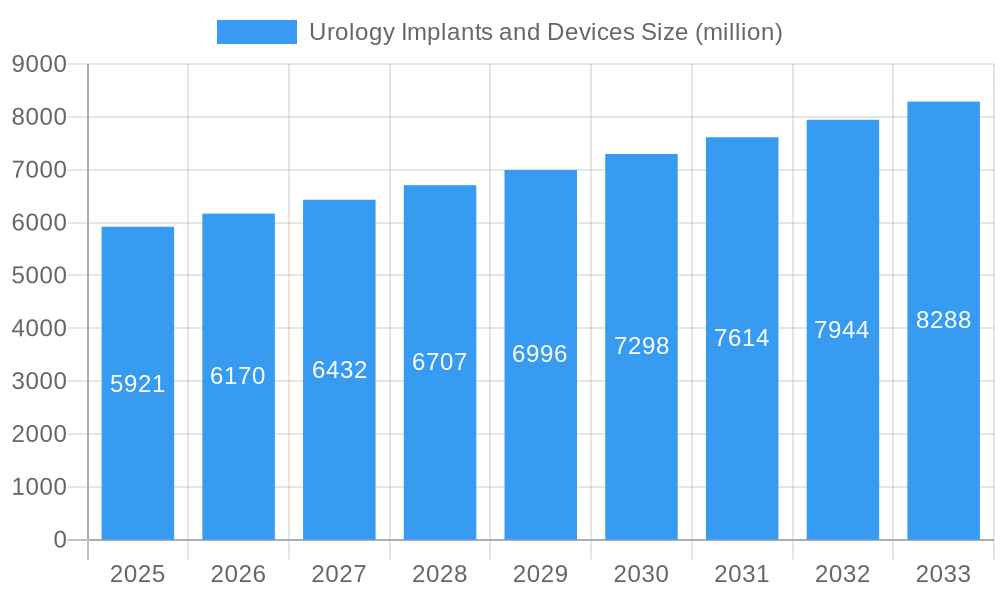
The global urology implants and devices market, valued at approximately $5.921 billion in 2025, is projected to experience robust growth, driven by several key factors. Technological advancements leading to minimally invasive procedures, an aging global population with a higher prevalence of urological conditions, and rising healthcare expenditure are significant contributors to this expansion. The increasing adoption of advanced imaging techniques for accurate diagnosis and improved surgical precision further fuels market growth. Furthermore, the growing awareness of urological diseases and better access to healthcare in developing economies contribute to increased demand for these devices. The market is segmented by product type (e.g., stents, catheters, implants), procedure type (e.g., minimally invasive, open surgery), and end-user (hospitals, ambulatory surgical centers). Competition is fierce among established players, with companies continuously innovating to offer superior products and expand their market share. While the market faces challenges such as stringent regulatory approvals and high costs associated with advanced devices, the overall growth trajectory remains positive, with a projected compound annual growth rate (CAGR) of 4.1% from 2025 to 2033.
Urology Implants and Devices Market Size (In Billion)
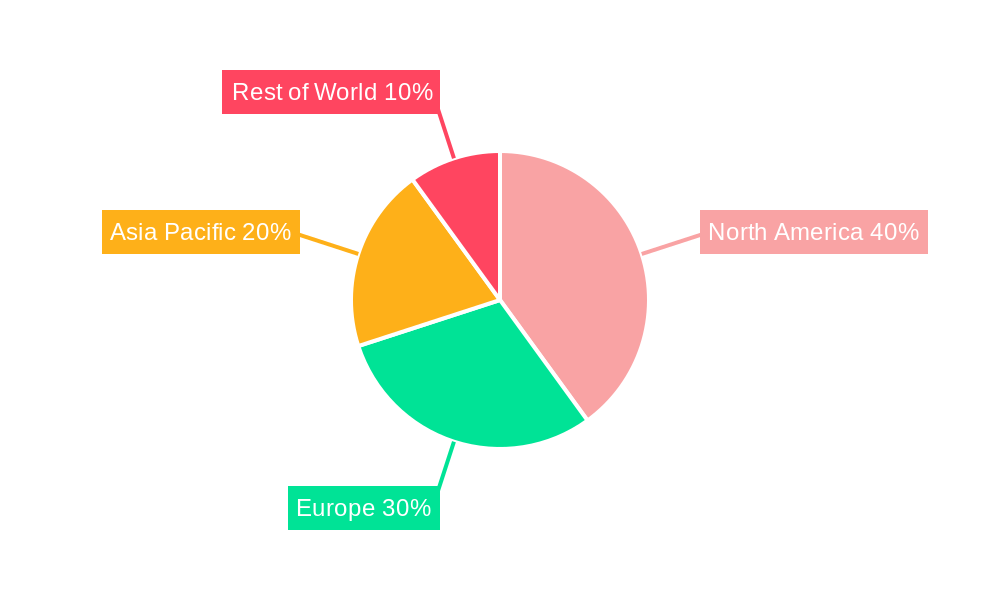
The competitive landscape is characterized by a mix of large multinational corporations and specialized smaller companies. Key players like Boston Scientific, BD, and Olympus Corporation are constantly engaging in research and development to bring innovative solutions to the market. Strategic partnerships, mergers, and acquisitions are prevalent strategies for these companies to expand their product portfolios and geographical reach. The market's future growth will hinge on the successful development and adoption of technologically superior devices, improved reimbursement policies, and continued investment in research and development initiatives focused on improving patient outcomes and reducing complications. The continued focus on minimally invasive surgical techniques is expected to drive the demand for smaller, more sophisticated devices. The regional distribution of the market will likely see growth across various regions, although developed markets such as North America and Europe are expected to remain dominant due to higher healthcare expenditure and advanced medical infrastructure.
Urology Implants and Devices Company Market Share
Unlocking Growth in the Multi-Billion Dollar Urology Implants and Devices Market: A Comprehensive Report (2019-2033)
This comprehensive report delivers in-depth analysis of the global Urology Implants and Devices market, projecting a valuation exceeding $XX billion by 2033. The study covers the period 2019-2033, with a base year of 2025 and a forecast period from 2025-2033. It provides critical insights for industry stakeholders, investors, and healthcare professionals seeking to navigate this dynamic market. Key players profiled include Boston Scientific Corporation, BD, Zephyr Surgical Implants, Advin Urology, Olympus Corporation, Fresenius Medical Care, Karl Storz, Baxter International, Richard Wolf, Intuitive Surgical, Dornier Medtech, Cook Medical Incorporated, and Stryker Corporation. This report utilizes a data-driven approach, incorporating real-world market observations and expert predictions to offer actionable intelligence.
Urology Implants and Devices Market Dynamics & Concentration
The global urology implants and devices market exhibits moderate concentration, with several key players holding significant market share. However, the presence of numerous smaller, specialized companies indicates a competitive landscape fostering innovation. Market share data for 2024 reveals that the top five companies collectively held approximately XX% of the market. The industry is characterized by continuous innovation driven by the need for minimally invasive procedures, improved patient outcomes, and technological advancements. Stringent regulatory frameworks, particularly in developed markets, influence product development and market access. Substitutes for certain devices are limited, though technological advancements are creating new options. End-user trends, such as increasing prevalence of urological conditions and a growing preference for minimally invasive surgeries, drive market expansion. Furthermore, M&A activities, with an estimated XX deals in the past five years, reflect strategic efforts to consolidate market share and access new technologies.
- Top 5 companies: XX% market share (2024)
- Estimated M&A deals (2019-2024): XX
- Key innovation drivers: Minimally invasive surgery, improved patient outcomes, technological advancements.
Urology Implants and Devices Industry Trends & Analysis
The Urology Implants and Devices market is experiencing robust growth, with a projected CAGR of XX% during the forecast period (2025-2033). This growth is fueled by several key factors, including the rising prevalence of urological diseases (e.g., prostate cancer, benign prostatic hyperplasia, urinary incontinence) across global populations, particularly in aging demographics. Technological advancements, such as robotic surgery and advanced imaging techniques, are significantly impacting market penetration and improving treatment efficacy. Consumer preferences are shifting towards less invasive procedures with faster recovery times, driving demand for minimally invasive devices. Intense competition among established players and emerging companies fosters innovation and drives price optimization, impacting market dynamics.
Leading Markets & Segments in Urology Implants and Devices
The North American market currently dominates the global Urology Implants and Devices sector, accounting for approximately XX% of the total market value in 2024. This dominance is primarily attributed to factors such as:
- High healthcare expenditure: Robust healthcare infrastructure and high per capita spending on healthcare contribute significantly to the region's market share.
- Technological advancements: North America is a hub for medical device innovation, leading to the early adoption of advanced urology implants and devices.
- Strong regulatory environment: While stringent, the regulatory framework ensures high-quality products and drives innovation.
Detailed analysis reveals a strong correlation between high healthcare spending and market penetration. The European market is a significant contributor, followed by Asia Pacific regions, showcasing strong growth potential driven by rising disposable incomes and increased healthcare awareness.
Urology Implants and Devices Product Developments
Recent product innovations focus on minimally invasive techniques, improved biocompatibility, and enhanced functionalities. Examples include advancements in robotic surgery systems, flexible ureteroscopes, and implantable devices with improved longevity and reduced complications. These innovations cater to the growing demand for less invasive procedures, reduced hospital stays, and faster patient recovery. The competitive advantage lies in the ability to offer superior efficacy, safety, and patient comfort. The market is witnessing a surge in smart implants equipped with sensors that monitor patient data, leading to personalized treatments and improved outcomes.
Key Drivers of Urology Implants and Devices Growth
Several factors are propelling growth within the Urology Implants and Devices market. Technological advancements are continuously improving device designs and procedures, leading to better patient outcomes and increased adoption. The rising prevalence of urological conditions among aging populations globally drives significant demand. Favorable regulatory environments in key markets facilitate product approvals and market access. Government initiatives promoting minimally invasive procedures further contribute to market expansion.
Challenges in the Urology Implants and Devices Market
Stringent regulatory requirements and lengthy approval processes pose considerable challenges for market entry and product launches. Supply chain disruptions due to global events can impact device availability and pricing. The high cost of advanced devices can limit affordability and access in certain regions. Intense competition necessitates continuous innovation and differentiation to maintain market share.
Emerging Opportunities in Urology Implants and Devices
Technological breakthroughs in areas such as nanotechnology, artificial intelligence (AI), and advanced materials offer exciting opportunities for developing next-generation urology implants and devices. Strategic partnerships between device manufacturers and healthcare providers can enhance market access and improve treatment outcomes. Expansion into emerging markets with significant unmet needs presents substantial growth potential. The focus on personalized medicine will drive demand for customized implantable devices.
Leading Players in the Urology Implants and Devices Sector
- Boston Scientific Corporation
- BD
- Zephyr Surgical Implants
- Advin Urology
- Olympus Corporation
- Fresenius Medical Care
- Karl Storz
- Baxter International
- Richard Wolf
- Intuitive Surgical
- Dornier Medtech
- Cook Medical Incorporated
- Stryker Corporation
Key Milestones in Urology Implants and Devices Industry
- 2020: FDA approval of a new minimally invasive device for prostate cancer treatment.
- 2022: Launch of a robotic surgery system specifically designed for urological procedures.
- 2023: Acquisition of a smaller company specializing in novel implant materials.
- 2024: Publication of key clinical trial results demonstrating improved outcomes with a new device.
Strategic Outlook for Urology Implants and Devices Market
The future of the Urology Implants and Devices market is bright, with substantial growth potential driven by ongoing technological advancements, expanding applications, and the increasing prevalence of urological diseases. Strategic partnerships, acquisitions, and investment in R&D will be crucial for companies to maintain a competitive edge and capitalize on emerging opportunities within the market. A focus on developing patient-centric solutions with improved efficacy, safety, and affordability will be key to driving long-term success.
Urology Implants and Devices Segmentation
-
1. Application
- 1.1. Hospitals
- 1.2. Pharmacies
- 1.3. Ambulatory Surgery Centers (ASC)
- 1.4. Others
-
2. Types
- 2.1. Endoscopes
- 2.2. Lithotripsy Devices
- 2.3. Urodynamic Systems
- 2.4. Urology Implants
- 2.5. Others
Urology Implants and Devices Segmentation By Geography
-
1. North America
- 1.1. United States
- 1.2. Canada
- 1.3. Mexico
-
2. South America
- 2.1. Brazil
- 2.2. Argentina
- 2.3. Rest of South America
-
3. Europe
- 3.1. United Kingdom
- 3.2. Germany
- 3.3. France
- 3.4. Italy
- 3.5. Spain
- 3.6. Russia
- 3.7. Benelux
- 3.8. Nordics
- 3.9. Rest of Europe
-
4. Middle East & Africa
- 4.1. Turkey
- 4.2. Israel
- 4.3. GCC
- 4.4. North Africa
- 4.5. South Africa
- 4.6. Rest of Middle East & Africa
-
5. Asia Pacific
- 5.1. China
- 5.2. India
- 5.3. Japan
- 5.4. South Korea
- 5.5. ASEAN
- 5.6. Oceania
- 5.7. Rest of Asia Pacific
Urology Implants and Devices Regional Market Share
Geographic Coverage of Urology Implants and Devices
Urology Implants and Devices REPORT HIGHLIGHTS
| Aspects | Details |
|---|---|
| Study Period | 2020-2034 |
| Base Year | 2025 |
| Estimated Year | 2026 |
| Forecast Period | 2026-2034 |
| Historical Period | 2020-2025 |
| Growth Rate | CAGR of 4.1% from 2020-2034 |
| Segmentation |
|
Table of Contents
- 1. Introduction
- 1.1. Research Scope
- 1.2. Market Segmentation
- 1.3. Research Objective
- 1.4. Definitions and Assumptions
- 2. Executive Summary
- 2.1. Market Snapshot
- 3. Market Dynamics
- 3.1. Market Drivers
- 3.2. Market Restrains
- 3.3. Market Trends
- 3.4. Market Opportunities
- 4. Market Factor Analysis
- 4.1. Porters Five Forces
- 4.1.1. Bargaining Power of Suppliers
- 4.1.2. Bargaining Power of Buyers
- 4.1.3. Threat of New Entrants
- 4.1.4. Threat of Substitutes
- 4.1.5. Competitive Rivalry
- 4.2. PESTEL analysis
- 4.3. BCG Analysis
- 4.3.1. Stars (High Growth, High Market Share)
- 4.3.2. Cash Cows (Low Growth, High Market Share)
- 4.3.3. Question Mark (High Growth, Low Market Share)
- 4.3.4. Dogs (Low Growth, Low Market Share)
- 4.4. Ansoff Matrix Analysis
- 4.5. Supply Chain Analysis
- 4.6. Regulatory Landscape
- 4.7. Current Market Potential and Opportunity Assessment (TAM–SAM–SOM Framework)
- 4.8. MDP Analyst Note
- 4.1. Porters Five Forces
- 5. Market Analysis, Insights and Forecast 2021-2033
- 5.1. Market Analysis, Insights and Forecast - by Application
- 5.1.1. Hospitals
- 5.1.2. Pharmacies
- 5.1.3. Ambulatory Surgery Centers (ASC)
- 5.1.4. Others
- 5.2. Market Analysis, Insights and Forecast - by Types
- 5.2.1. Endoscopes
- 5.2.2. Lithotripsy Devices
- 5.2.3. Urodynamic Systems
- 5.2.4. Urology Implants
- 5.2.5. Others
- 5.3. Market Analysis, Insights and Forecast - by Region
- 5.3.1. North America
- 5.3.2. South America
- 5.3.3. Europe
- 5.3.4. Middle East & Africa
- 5.3.5. Asia Pacific
- 5.1. Market Analysis, Insights and Forecast - by Application
- 6. Global Urology Implants and Devices Analysis, Insights and Forecast, 2021-2033
- 6.1. Market Analysis, Insights and Forecast - by Application
- 6.1.1. Hospitals
- 6.1.2. Pharmacies
- 6.1.3. Ambulatory Surgery Centers (ASC)
- 6.1.4. Others
- 6.2. Market Analysis, Insights and Forecast - by Types
- 6.2.1. Endoscopes
- 6.2.2. Lithotripsy Devices
- 6.2.3. Urodynamic Systems
- 6.2.4. Urology Implants
- 6.2.5. Others
- 6.1. Market Analysis, Insights and Forecast - by Application
- 7. North America Urology Implants and Devices Analysis, Insights and Forecast, 2020-2032
- 7.1. Market Analysis, Insights and Forecast - by Application
- 7.1.1. Hospitals
- 7.1.2. Pharmacies
- 7.1.3. Ambulatory Surgery Centers (ASC)
- 7.1.4. Others
- 7.2. Market Analysis, Insights and Forecast - by Types
- 7.2.1. Endoscopes
- 7.2.2. Lithotripsy Devices
- 7.2.3. Urodynamic Systems
- 7.2.4. Urology Implants
- 7.2.5. Others
- 7.1. Market Analysis, Insights and Forecast - by Application
- 8. South America Urology Implants and Devices Analysis, Insights and Forecast, 2020-2032
- 8.1. Market Analysis, Insights and Forecast - by Application
- 8.1.1. Hospitals
- 8.1.2. Pharmacies
- 8.1.3. Ambulatory Surgery Centers (ASC)
- 8.1.4. Others
- 8.2. Market Analysis, Insights and Forecast - by Types
- 8.2.1. Endoscopes
- 8.2.2. Lithotripsy Devices
- 8.2.3. Urodynamic Systems
- 8.2.4. Urology Implants
- 8.2.5. Others
- 8.1. Market Analysis, Insights and Forecast - by Application
- 9. Europe Urology Implants and Devices Analysis, Insights and Forecast, 2020-2032
- 9.1. Market Analysis, Insights and Forecast - by Application
- 9.1.1. Hospitals
- 9.1.2. Pharmacies
- 9.1.3. Ambulatory Surgery Centers (ASC)
- 9.1.4. Others
- 9.2. Market Analysis, Insights and Forecast - by Types
- 9.2.1. Endoscopes
- 9.2.2. Lithotripsy Devices
- 9.2.3. Urodynamic Systems
- 9.2.4. Urology Implants
- 9.2.5. Others
- 9.1. Market Analysis, Insights and Forecast - by Application
- 10. Middle East & Africa Urology Implants and Devices Analysis, Insights and Forecast, 2020-2032
- 10.1. Market Analysis, Insights and Forecast - by Application
- 10.1.1. Hospitals
- 10.1.2. Pharmacies
- 10.1.3. Ambulatory Surgery Centers (ASC)
- 10.1.4. Others
- 10.2. Market Analysis, Insights and Forecast - by Types
- 10.2.1. Endoscopes
- 10.2.2. Lithotripsy Devices
- 10.2.3. Urodynamic Systems
- 10.2.4. Urology Implants
- 10.2.5. Others
- 10.1. Market Analysis, Insights and Forecast - by Application
- 11. Asia Pacific Urology Implants and Devices Analysis, Insights and Forecast, 2020-2032
- 11.1. Market Analysis, Insights and Forecast - by Application
- 11.1.1. Hospitals
- 11.1.2. Pharmacies
- 11.1.3. Ambulatory Surgery Centers (ASC)
- 11.1.4. Others
- 11.2. Market Analysis, Insights and Forecast - by Types
- 11.2.1. Endoscopes
- 11.2.2. Lithotripsy Devices
- 11.2.3. Urodynamic Systems
- 11.2.4. Urology Implants
- 11.2.5. Others
- 11.1. Market Analysis, Insights and Forecast - by Application
- 12. Competitive Analysis
- 12.1. Company Profiles
- 12.1.1 Boston Scientific Corporation
- 12.1.1.1. Company Overview
- 12.1.1.2. Products
- 12.1.1.3. Company Financials
- 12.1.1.4. SWOT Analysis
- 12.1.2 BD
- 12.1.2.1. Company Overview
- 12.1.2.2. Products
- 12.1.2.3. Company Financials
- 12.1.2.4. SWOT Analysis
- 12.1.3 Zephyr Surgical Implants
- 12.1.3.1. Company Overview
- 12.1.3.2. Products
- 12.1.3.3. Company Financials
- 12.1.3.4. SWOT Analysis
- 12.1.4 Advin Urology
- 12.1.4.1. Company Overview
- 12.1.4.2. Products
- 12.1.4.3. Company Financials
- 12.1.4.4. SWOT Analysis
- 12.1.5 Olympus Corporation
- 12.1.5.1. Company Overview
- 12.1.5.2. Products
- 12.1.5.3. Company Financials
- 12.1.5.4. SWOT Analysis
- 12.1.6 Fresenius Medical Care
- 12.1.6.1. Company Overview
- 12.1.6.2. Products
- 12.1.6.3. Company Financials
- 12.1.6.4. SWOT Analysis
- 12.1.7 Karl Storz
- 12.1.7.1. Company Overview
- 12.1.7.2. Products
- 12.1.7.3. Company Financials
- 12.1.7.4. SWOT Analysis
- 12.1.8 Baxter International
- 12.1.8.1. Company Overview
- 12.1.8.2. Products
- 12.1.8.3. Company Financials
- 12.1.8.4. SWOT Analysis
- 12.1.9 Richard Wolf
- 12.1.9.1. Company Overview
- 12.1.9.2. Products
- 12.1.9.3. Company Financials
- 12.1.9.4. SWOT Analysis
- 12.1.10 Intuitive Surgical
- 12.1.10.1. Company Overview
- 12.1.10.2. Products
- 12.1.10.3. Company Financials
- 12.1.10.4. SWOT Analysis
- 12.1.11 Dornier Medtech
- 12.1.11.1. Company Overview
- 12.1.11.2. Products
- 12.1.11.3. Company Financials
- 12.1.11.4. SWOT Analysis
- 12.1.12 Cook Medical Incorporated
- 12.1.12.1. Company Overview
- 12.1.12.2. Products
- 12.1.12.3. Company Financials
- 12.1.12.4. SWOT Analysis
- 12.1.13 Stryker Corporation
- 12.1.13.1. Company Overview
- 12.1.13.2. Products
- 12.1.13.3. Company Financials
- 12.1.13.4. SWOT Analysis
- 12.1.1 Boston Scientific Corporation
- 12.2. Market Entropy
- 12.2.1 Company's Key Areas Served
- 12.2.2 Recent Developments
- 12.3. Company Market Share Analysis 2025
- 12.3.1 Top 5 Companies Market Share Analysis
- 12.3.2 Top 3 Companies Market Share Analysis
- 12.4. List of Potential Customers
- 13. Research Methodology
List of Figures
- Figure 1: Global Urology Implants and Devices Revenue Breakdown (million, %) by Region 2025 & 2033
- Figure 2: Global Urology Implants and Devices Volume Breakdown (K, %) by Region 2025 & 2033
- Figure 3: North America Urology Implants and Devices Revenue (million), by Application 2025 & 2033
- Figure 4: North America Urology Implants and Devices Volume (K), by Application 2025 & 2033
- Figure 5: North America Urology Implants and Devices Revenue Share (%), by Application 2025 & 2033
- Figure 6: North America Urology Implants and Devices Volume Share (%), by Application 2025 & 2033
- Figure 7: North America Urology Implants and Devices Revenue (million), by Types 2025 & 2033
- Figure 8: North America Urology Implants and Devices Volume (K), by Types 2025 & 2033
- Figure 9: North America Urology Implants and Devices Revenue Share (%), by Types 2025 & 2033
- Figure 10: North America Urology Implants and Devices Volume Share (%), by Types 2025 & 2033
- Figure 11: North America Urology Implants and Devices Revenue (million), by Country 2025 & 2033
- Figure 12: North America Urology Implants and Devices Volume (K), by Country 2025 & 2033
- Figure 13: North America Urology Implants and Devices Revenue Share (%), by Country 2025 & 2033
- Figure 14: North America Urology Implants and Devices Volume Share (%), by Country 2025 & 2033
- Figure 15: South America Urology Implants and Devices Revenue (million), by Application 2025 & 2033
- Figure 16: South America Urology Implants and Devices Volume (K), by Application 2025 & 2033
- Figure 17: South America Urology Implants and Devices Revenue Share (%), by Application 2025 & 2033
- Figure 18: South America Urology Implants and Devices Volume Share (%), by Application 2025 & 2033
- Figure 19: South America Urology Implants and Devices Revenue (million), by Types 2025 & 2033
- Figure 20: South America Urology Implants and Devices Volume (K), by Types 2025 & 2033
- Figure 21: South America Urology Implants and Devices Revenue Share (%), by Types 2025 & 2033
- Figure 22: South America Urology Implants and Devices Volume Share (%), by Types 2025 & 2033
- Figure 23: South America Urology Implants and Devices Revenue (million), by Country 2025 & 2033
- Figure 24: South America Urology Implants and Devices Volume (K), by Country 2025 & 2033
- Figure 25: South America Urology Implants and Devices Revenue Share (%), by Country 2025 & 2033
- Figure 26: South America Urology Implants and Devices Volume Share (%), by Country 2025 & 2033
- Figure 27: Europe Urology Implants and Devices Revenue (million), by Application 2025 & 2033
- Figure 28: Europe Urology Implants and Devices Volume (K), by Application 2025 & 2033
- Figure 29: Europe Urology Implants and Devices Revenue Share (%), by Application 2025 & 2033
- Figure 30: Europe Urology Implants and Devices Volume Share (%), by Application 2025 & 2033
- Figure 31: Europe Urology Implants and Devices Revenue (million), by Types 2025 & 2033
- Figure 32: Europe Urology Implants and Devices Volume (K), by Types 2025 & 2033
- Figure 33: Europe Urology Implants and Devices Revenue Share (%), by Types 2025 & 2033
- Figure 34: Europe Urology Implants and Devices Volume Share (%), by Types 2025 & 2033
- Figure 35: Europe Urology Implants and Devices Revenue (million), by Country 2025 & 2033
- Figure 36: Europe Urology Implants and Devices Volume (K), by Country 2025 & 2033
- Figure 37: Europe Urology Implants and Devices Revenue Share (%), by Country 2025 & 2033
- Figure 38: Europe Urology Implants and Devices Volume Share (%), by Country 2025 & 2033
- Figure 39: Middle East & Africa Urology Implants and Devices Revenue (million), by Application 2025 & 2033
- Figure 40: Middle East & Africa Urology Implants and Devices Volume (K), by Application 2025 & 2033
- Figure 41: Middle East & Africa Urology Implants and Devices Revenue Share (%), by Application 2025 & 2033
- Figure 42: Middle East & Africa Urology Implants and Devices Volume Share (%), by Application 2025 & 2033
- Figure 43: Middle East & Africa Urology Implants and Devices Revenue (million), by Types 2025 & 2033
- Figure 44: Middle East & Africa Urology Implants and Devices Volume (K), by Types 2025 & 2033
- Figure 45: Middle East & Africa Urology Implants and Devices Revenue Share (%), by Types 2025 & 2033
- Figure 46: Middle East & Africa Urology Implants and Devices Volume Share (%), by Types 2025 & 2033
- Figure 47: Middle East & Africa Urology Implants and Devices Revenue (million), by Country 2025 & 2033
- Figure 48: Middle East & Africa Urology Implants and Devices Volume (K), by Country 2025 & 2033
- Figure 49: Middle East & Africa Urology Implants and Devices Revenue Share (%), by Country 2025 & 2033
- Figure 50: Middle East & Africa Urology Implants and Devices Volume Share (%), by Country 2025 & 2033
- Figure 51: Asia Pacific Urology Implants and Devices Revenue (million), by Application 2025 & 2033
- Figure 52: Asia Pacific Urology Implants and Devices Volume (K), by Application 2025 & 2033
- Figure 53: Asia Pacific Urology Implants and Devices Revenue Share (%), by Application 2025 & 2033
- Figure 54: Asia Pacific Urology Implants and Devices Volume Share (%), by Application 2025 & 2033
- Figure 55: Asia Pacific Urology Implants and Devices Revenue (million), by Types 2025 & 2033
- Figure 56: Asia Pacific Urology Implants and Devices Volume (K), by Types 2025 & 2033
- Figure 57: Asia Pacific Urology Implants and Devices Revenue Share (%), by Types 2025 & 2033
- Figure 58: Asia Pacific Urology Implants and Devices Volume Share (%), by Types 2025 & 2033
- Figure 59: Asia Pacific Urology Implants and Devices Revenue (million), by Country 2025 & 2033
- Figure 60: Asia Pacific Urology Implants and Devices Volume (K), by Country 2025 & 2033
- Figure 61: Asia Pacific Urology Implants and Devices Revenue Share (%), by Country 2025 & 2033
- Figure 62: Asia Pacific Urology Implants and Devices Volume Share (%), by Country 2025 & 2033
List of Tables
- Table 1: Global Urology Implants and Devices Revenue million Forecast, by Application 2020 & 2033
- Table 2: Global Urology Implants and Devices Volume K Forecast, by Application 2020 & 2033
- Table 3: Global Urology Implants and Devices Revenue million Forecast, by Types 2020 & 2033
- Table 4: Global Urology Implants and Devices Volume K Forecast, by Types 2020 & 2033
- Table 5: Global Urology Implants and Devices Revenue million Forecast, by Region 2020 & 2033
- Table 6: Global Urology Implants and Devices Volume K Forecast, by Region 2020 & 2033
- Table 7: Global Urology Implants and Devices Revenue million Forecast, by Application 2020 & 2033
- Table 8: Global Urology Implants and Devices Volume K Forecast, by Application 2020 & 2033
- Table 9: Global Urology Implants and Devices Revenue million Forecast, by Types 2020 & 2033
- Table 10: Global Urology Implants and Devices Volume K Forecast, by Types 2020 & 2033
- Table 11: Global Urology Implants and Devices Revenue million Forecast, by Country 2020 & 2033
- Table 12: Global Urology Implants and Devices Volume K Forecast, by Country 2020 & 2033
- Table 13: United States Urology Implants and Devices Revenue (million) Forecast, by Application 2020 & 2033
- Table 14: United States Urology Implants and Devices Volume (K) Forecast, by Application 2020 & 2033
- Table 15: Canada Urology Implants and Devices Revenue (million) Forecast, by Application 2020 & 2033
- Table 16: Canada Urology Implants and Devices Volume (K) Forecast, by Application 2020 & 2033
- Table 17: Mexico Urology Implants and Devices Revenue (million) Forecast, by Application 2020 & 2033
- Table 18: Mexico Urology Implants and Devices Volume (K) Forecast, by Application 2020 & 2033
- Table 19: Global Urology Implants and Devices Revenue million Forecast, by Application 2020 & 2033
- Table 20: Global Urology Implants and Devices Volume K Forecast, by Application 2020 & 2033
- Table 21: Global Urology Implants and Devices Revenue million Forecast, by Types 2020 & 2033
- Table 22: Global Urology Implants and Devices Volume K Forecast, by Types 2020 & 2033
- Table 23: Global Urology Implants and Devices Revenue million Forecast, by Country 2020 & 2033
- Table 24: Global Urology Implants and Devices Volume K Forecast, by Country 2020 & 2033
- Table 25: Brazil Urology Implants and Devices Revenue (million) Forecast, by Application 2020 & 2033
- Table 26: Brazil Urology Implants and Devices Volume (K) Forecast, by Application 2020 & 2033
- Table 27: Argentina Urology Implants and Devices Revenue (million) Forecast, by Application 2020 & 2033
- Table 28: Argentina Urology Implants and Devices Volume (K) Forecast, by Application 2020 & 2033
- Table 29: Rest of South America Urology Implants and Devices Revenue (million) Forecast, by Application 2020 & 2033
- Table 30: Rest of South America Urology Implants and Devices Volume (K) Forecast, by Application 2020 & 2033
- Table 31: Global Urology Implants and Devices Revenue million Forecast, by Application 2020 & 2033
- Table 32: Global Urology Implants and Devices Volume K Forecast, by Application 2020 & 2033
- Table 33: Global Urology Implants and Devices Revenue million Forecast, by Types 2020 & 2033
- Table 34: Global Urology Implants and Devices Volume K Forecast, by Types 2020 & 2033
- Table 35: Global Urology Implants and Devices Revenue million Forecast, by Country 2020 & 2033
- Table 36: Global Urology Implants and Devices Volume K Forecast, by Country 2020 & 2033
- Table 37: United Kingdom Urology Implants and Devices Revenue (million) Forecast, by Application 2020 & 2033
- Table 38: United Kingdom Urology Implants and Devices Volume (K) Forecast, by Application 2020 & 2033
- Table 39: Germany Urology Implants and Devices Revenue (million) Forecast, by Application 2020 & 2033
- Table 40: Germany Urology Implants and Devices Volume (K) Forecast, by Application 2020 & 2033
- Table 41: France Urology Implants and Devices Revenue (million) Forecast, by Application 2020 & 2033
- Table 42: France Urology Implants and Devices Volume (K) Forecast, by Application 2020 & 2033
- Table 43: Italy Urology Implants and Devices Revenue (million) Forecast, by Application 2020 & 2033
- Table 44: Italy Urology Implants and Devices Volume (K) Forecast, by Application 2020 & 2033
- Table 45: Spain Urology Implants and Devices Revenue (million) Forecast, by Application 2020 & 2033
- Table 46: Spain Urology Implants and Devices Volume (K) Forecast, by Application 2020 & 2033
- Table 47: Russia Urology Implants and Devices Revenue (million) Forecast, by Application 2020 & 2033
- Table 48: Russia Urology Implants and Devices Volume (K) Forecast, by Application 2020 & 2033
- Table 49: Benelux Urology Implants and Devices Revenue (million) Forecast, by Application 2020 & 2033
- Table 50: Benelux Urology Implants and Devices Volume (K) Forecast, by Application 2020 & 2033
- Table 51: Nordics Urology Implants and Devices Revenue (million) Forecast, by Application 2020 & 2033
- Table 52: Nordics Urology Implants and Devices Volume (K) Forecast, by Application 2020 & 2033
- Table 53: Rest of Europe Urology Implants and Devices Revenue (million) Forecast, by Application 2020 & 2033
- Table 54: Rest of Europe Urology Implants and Devices Volume (K) Forecast, by Application 2020 & 2033
- Table 55: Global Urology Implants and Devices Revenue million Forecast, by Application 2020 & 2033
- Table 56: Global Urology Implants and Devices Volume K Forecast, by Application 2020 & 2033
- Table 57: Global Urology Implants and Devices Revenue million Forecast, by Types 2020 & 2033
- Table 58: Global Urology Implants and Devices Volume K Forecast, by Types 2020 & 2033
- Table 59: Global Urology Implants and Devices Revenue million Forecast, by Country 2020 & 2033
- Table 60: Global Urology Implants and Devices Volume K Forecast, by Country 2020 & 2033
- Table 61: Turkey Urology Implants and Devices Revenue (million) Forecast, by Application 2020 & 2033
- Table 62: Turkey Urology Implants and Devices Volume (K) Forecast, by Application 2020 & 2033
- Table 63: Israel Urology Implants and Devices Revenue (million) Forecast, by Application 2020 & 2033
- Table 64: Israel Urology Implants and Devices Volume (K) Forecast, by Application 2020 & 2033
- Table 65: GCC Urology Implants and Devices Revenue (million) Forecast, by Application 2020 & 2033
- Table 66: GCC Urology Implants and Devices Volume (K) Forecast, by Application 2020 & 2033
- Table 67: North Africa Urology Implants and Devices Revenue (million) Forecast, by Application 2020 & 2033
- Table 68: North Africa Urology Implants and Devices Volume (K) Forecast, by Application 2020 & 2033
- Table 69: South Africa Urology Implants and Devices Revenue (million) Forecast, by Application 2020 & 2033
- Table 70: South Africa Urology Implants and Devices Volume (K) Forecast, by Application 2020 & 2033
- Table 71: Rest of Middle East & Africa Urology Implants and Devices Revenue (million) Forecast, by Application 2020 & 2033
- Table 72: Rest of Middle East & Africa Urology Implants and Devices Volume (K) Forecast, by Application 2020 & 2033
- Table 73: Global Urology Implants and Devices Revenue million Forecast, by Application 2020 & 2033
- Table 74: Global Urology Implants and Devices Volume K Forecast, by Application 2020 & 2033
- Table 75: Global Urology Implants and Devices Revenue million Forecast, by Types 2020 & 2033
- Table 76: Global Urology Implants and Devices Volume K Forecast, by Types 2020 & 2033
- Table 77: Global Urology Implants and Devices Revenue million Forecast, by Country 2020 & 2033
- Table 78: Global Urology Implants and Devices Volume K Forecast, by Country 2020 & 2033
- Table 79: China Urology Implants and Devices Revenue (million) Forecast, by Application 2020 & 2033
- Table 80: China Urology Implants and Devices Volume (K) Forecast, by Application 2020 & 2033
- Table 81: India Urology Implants and Devices Revenue (million) Forecast, by Application 2020 & 2033
- Table 82: India Urology Implants and Devices Volume (K) Forecast, by Application 2020 & 2033
- Table 83: Japan Urology Implants and Devices Revenue (million) Forecast, by Application 2020 & 2033
- Table 84: Japan Urology Implants and Devices Volume (K) Forecast, by Application 2020 & 2033
- Table 85: South Korea Urology Implants and Devices Revenue (million) Forecast, by Application 2020 & 2033
- Table 86: South Korea Urology Implants and Devices Volume (K) Forecast, by Application 2020 & 2033
- Table 87: ASEAN Urology Implants and Devices Revenue (million) Forecast, by Application 2020 & 2033
- Table 88: ASEAN Urology Implants and Devices Volume (K) Forecast, by Application 2020 & 2033
- Table 89: Oceania Urology Implants and Devices Revenue (million) Forecast, by Application 2020 & 2033
- Table 90: Oceania Urology Implants and Devices Volume (K) Forecast, by Application 2020 & 2033
- Table 91: Rest of Asia Pacific Urology Implants and Devices Revenue (million) Forecast, by Application 2020 & 2033
- Table 92: Rest of Asia Pacific Urology Implants and Devices Volume (K) Forecast, by Application 2020 & 2033
Frequently Asked Questions
1. What is the projected Compound Annual Growth Rate (CAGR) of the Urology Implants and Devices?
The projected CAGR is approximately 4.1%.
2. Which companies are prominent players in the Urology Implants and Devices?
Key companies in the market include Boston Scientific Corporation, BD, Zephyr Surgical Implants, Advin Urology, Olympus Corporation, Fresenius Medical Care, Karl Storz, Baxter International, Richard Wolf, Intuitive Surgical, Dornier Medtech, Cook Medical Incorporated, Stryker Corporation.
3. What are the main segments of the Urology Implants and Devices?
The market segments include Application, Types.
4. Can you provide details about the market size?
The market size is estimated to be USD 5921 million as of 2022.
5. What are some drivers contributing to market growth?
N/A
6. What are the notable trends driving market growth?
N/A
7. Are there any restraints impacting market growth?
N/A
8. Can you provide examples of recent developments in the market?
N/A
9. What pricing options are available for accessing the report?
Pricing options include single-user, multi-user, and enterprise licenses priced at USD 3950.00, USD 5925.00, and USD 7900.00 respectively.
10. Is the market size provided in terms of value or volume?
The market size is provided in terms of value, measured in million and volume, measured in K.
11. Are there any specific market keywords associated with the report?
Yes, the market keyword associated with the report is "Urology Implants and Devices," which aids in identifying and referencing the specific market segment covered.
12. How do I determine which pricing option suits my needs best?
The pricing options vary based on user requirements and access needs. Individual users may opt for single-user licenses, while businesses requiring broader access may choose multi-user or enterprise licenses for cost-effective access to the report.
13. Are there any additional resources or data provided in the Urology Implants and Devices report?
While the report offers comprehensive insights, it's advisable to review the specific contents or supplementary materials provided to ascertain if additional resources or data are available.
14. How can I stay updated on further developments or reports in the Urology Implants and Devices?
To stay informed about further developments, trends, and reports in the Urology Implants and Devices, consider subscribing to industry newsletters, following relevant companies and organizations, or regularly checking reputable industry news sources and publications.
Methodology
Step 1 - Identification of Relevant Samples Size from Population Database


Step 2 - Approaches for Defining Global Market Size (Value, Volume* & Price*)

Note*: In applicable scenarios
Step 3 - Data Sources
Primary Research
- Web Analytics
- Survey Reports
- Research Institute
- Latest Research Reports
- Opinion Leaders
Secondary Research
- Annual Reports
- White Paper
- Latest Press Release
- Industry Association
- Paid Database
- Investor Presentations

Step 4 - Data Triangulation
Involves using different sources of information in order to increase the validity of a study
These sources are likely to be stakeholders in a program - participants, other researchers, program staff, other community members, and so on.
Then we put all data in single framework & apply various statistical tools to find out the dynamic on the market.
During the analysis stage, feedback from the stakeholder groups would be compared to determine areas of agreement as well as areas of divergence