

Key Insights
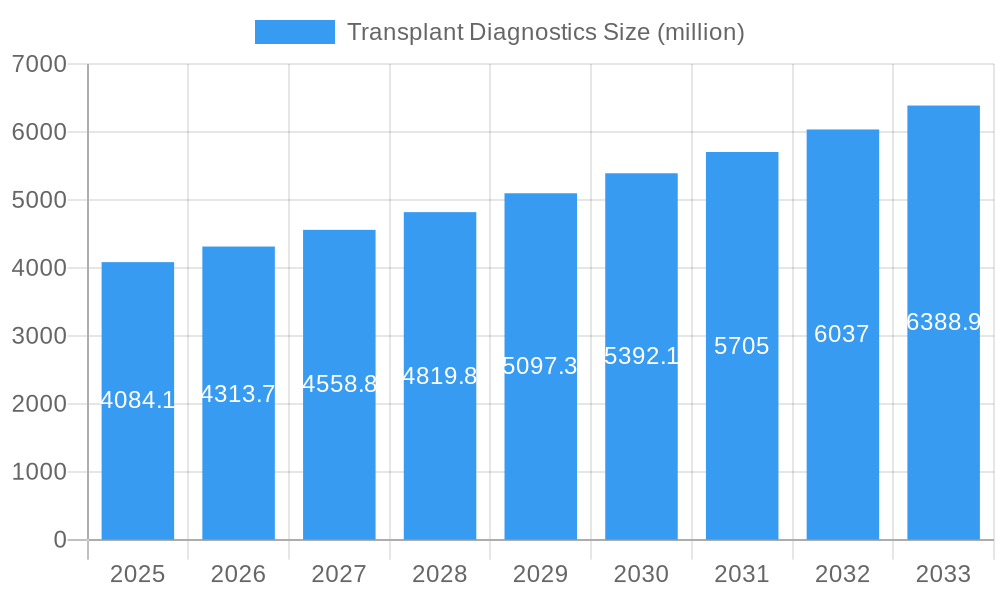
The global transplant diagnostics market, valued at $4,084.1 million in 2025, is projected to experience robust growth, driven by several key factors. The increasing prevalence of organ transplantation procedures worldwide, coupled with the rising incidence of organ rejection and associated complications, fuels the demand for accurate and timely diagnostic tools. Technological advancements in areas such as next-generation sequencing (NGS), polymerase chain reaction (PCR), and microarrays are leading to the development of more sensitive and specific diagnostic assays, improving patient outcomes and reducing healthcare costs. Furthermore, the growing adoption of minimally invasive diagnostic techniques and the increasing focus on personalized medicine are further propelling market expansion. The market is segmented by various factors including test type, technology, and end-user, allowing for targeted product development and strategic market penetration. Competitive landscape analysis shows a mix of established players such as Thermo Fisher Scientific, Roche, and Bio-Rad, alongside emerging companies specializing in innovative diagnostic solutions. The market's growth is expected to be influenced by factors such as stringent regulatory approvals, reimbursement policies, and the cost of sophisticated diagnostic equipment. However, the high cost of advanced diagnostic tests and the availability of alternative treatment modalities may present certain challenges to market growth.
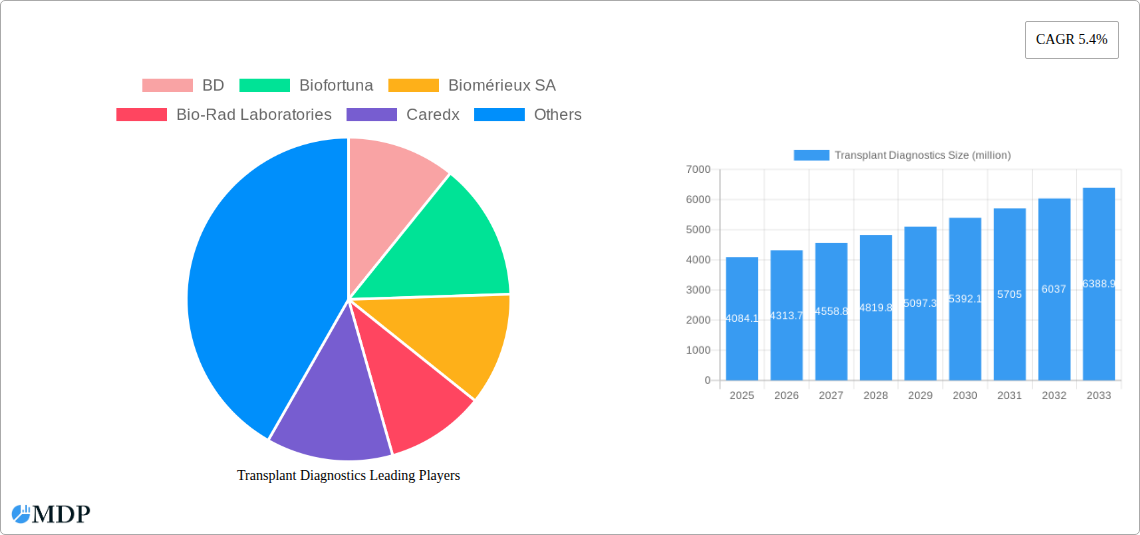
Transplant Diagnostics Market Size (In Billion)
The forecast period (2025-2033) anticipates a continued upward trajectory, with a Compound Annual Growth Rate (CAGR) of 5.4%. This growth will be largely influenced by continued advancements in technology, expanding healthcare infrastructure in developing economies, and a heightened awareness of the importance of precise diagnosis in transplant medicine. The competitive landscape will likely see further consolidation through mergers, acquisitions, and strategic partnerships, driving innovation and market penetration. A focus on developing cost-effective diagnostic solutions tailored to the specific needs of diverse healthcare settings will be crucial for sustained growth. The market is well-positioned for significant expansion, propelled by advancements in technology and a growing global demand for reliable transplant diagnostics.
Transplant Diagnostics Company Market Share
Transplant Diagnostics Market Report: 2019-2033 - A Comprehensive Analysis
This comprehensive report provides an in-depth analysis of the Transplant Diagnostics market, projecting a multi-million dollar valuation by 2033. It offers actionable insights for industry stakeholders, covering market dynamics, leading players, technological advancements, and future growth opportunities. The study period spans 2019-2033, with 2025 serving as the base and estimated year. The forecast period is 2025-2033, and the historical period covers 2019-2024.
Transplant Diagnostics Market Dynamics & Concentration
This section analyzes the market's competitive landscape, focusing on concentration, innovation, regulatory frameworks, and M&A activity. The global Transplant Diagnostics market is expected to reach $xx million by 2033, driven by factors such as increasing prevalence of organ transplantation and technological advancements.
Market Concentration: The market is moderately concentrated, with several major players holding significant market share. BD, Thermo Fisher Scientific, and Illumina collectively hold an estimated xx% of the market share in 2025. Smaller companies, like Biofortuna and Gendx, focus on niche segments.
Innovation Drivers: Continuous innovation in molecular diagnostics, including next-generation sequencing (NGS) and advanced immunology assays, is fueling market growth. The development of more sensitive and specific tests for organ rejection and infection is also a key driver.
Regulatory Frameworks: Stringent regulatory requirements and approvals for new diagnostic tools impact market entry and growth. However, supportive regulatory landscapes in key markets accelerate adoption.
Product Substitutes: While no direct substitutes exist for specific transplant diagnostic tests, alternative approaches to monitoring organ health exist, creating some competitive pressure.
End-User Trends: Increasing demand for personalized medicine and point-of-care testing is shifting market dynamics, driving demand for rapid and accurate diagnostic solutions.
M&A Activities: The market has witnessed xx M&A deals between 2019 and 2024, primarily focused on expanding product portfolios and geographic reach. Consolidation is expected to continue, shaping the market landscape.
Transplant Diagnostics Industry Trends & Analysis
This section explores key trends shaping the Transplant Diagnostics market, including growth drivers, technological disruptions, and competitive dynamics. The market is projected to exhibit a CAGR of xx% during the forecast period (2025-2033). Market penetration of advanced diagnostic tools remains relatively low, leaving significant room for expansion.
The increasing incidence of organ failure globally is a major driver of growth, fueling demand for transplant diagnostic tests. Technological advancements, such as the integration of AI and machine learning in diagnostics, are enhancing accuracy and efficiency. Growing consumer awareness of organ transplant care and better healthcare infrastructure in developing nations also contribute to market expansion. However, high costs associated with advanced diagnostic technologies and reimbursement challenges remain key barriers. The competitive landscape is characterized by both large multinational corporations and smaller specialized companies, leading to intense competition driven by innovation and strategic partnerships.
Leading Markets & Segments in Transplant Diagnostics
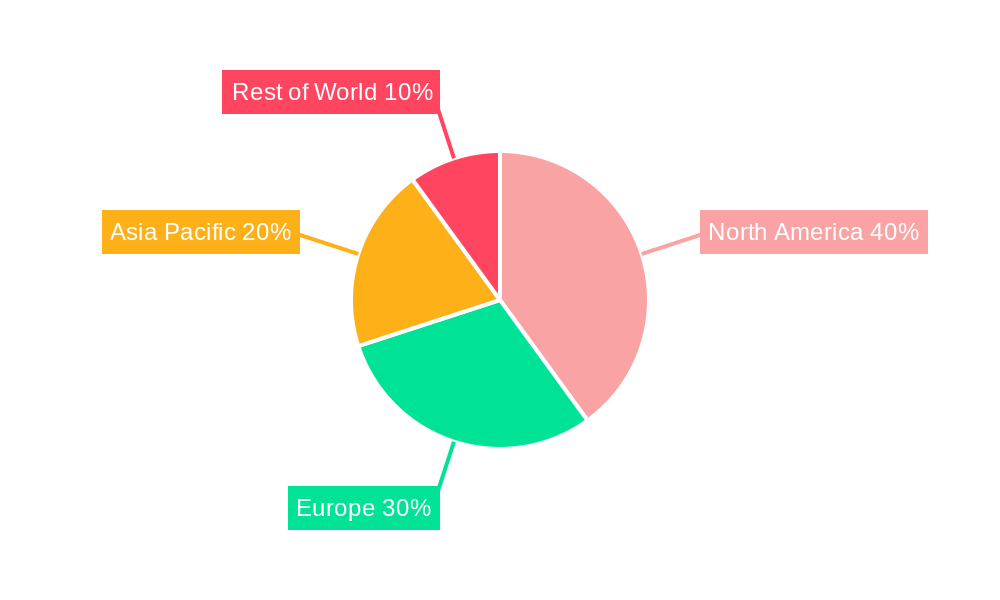
This section identifies dominant regions and segments within the Transplant Diagnostics market. The North American market holds a significant share, driven by robust healthcare infrastructure, high per capita healthcare spending, and a large patient base.
Key Drivers in North America:
- High prevalence of chronic diseases leading to organ failure.
- Advanced healthcare infrastructure and technology adoption.
- Favorable reimbursement policies.
Dominance Analysis: The North American market's dominance is attributed to higher healthcare expenditure, a large number of organ transplantation procedures, and early adoption of novel diagnostic technologies. However, the European and Asia-Pacific markets are expected to witness significant growth in the coming years, fueled by rising healthcare spending and increasing awareness about organ transplantation.
Transplant Diagnostics Product Developments
Recent product innovations focus on improving the accuracy, speed, and cost-effectiveness of transplant diagnostics. NGS technologies offer comprehensive genetic profiling, enabling better risk stratification and personalized treatment. Miniaturized and portable diagnostic devices enhance accessibility and point-of-care testing capabilities. The focus remains on developing highly specific assays for early detection of organ rejection and infection, improving patient outcomes. These innovations improve market fit by addressing the demand for quicker, more accurate results, ultimately driving higher adoption rates and market growth.
Key Drivers of Transplant Diagnostics Growth
Several factors are driving growth in the Transplant Diagnostics market, including:
Technological Advancements: The development of innovative technologies like NGS and advanced immunoassays is enhancing test accuracy and efficiency.
Economic Factors: Rising healthcare expenditure and insurance coverage are increasing accessibility to transplant diagnostics.
Regulatory Support: Favorable regulatory frameworks are streamlining the approval process for new diagnostic tools.
Challenges in the Transplant Diagnostics Market
The Transplant Diagnostics market faces certain barriers:
Regulatory Hurdles: Stringent regulatory processes can slow down the market entry of new technologies.
Supply Chain Issues: The global supply chain may affect the availability of diagnostic reagents and equipment.
Competitive Pressure: Intense competition among established players and emerging companies is impacting pricing and market share. This pressure can lead to a decrease in profit margins for some companies.
Emerging Opportunities in Transplant Diagnostics
The Transplant Diagnostics market presents significant opportunities. Further technological breakthroughs, particularly in AI-powered diagnostics, promise enhanced accuracy and personalized care. Strategic partnerships between diagnostics companies and healthcare providers are also expected to contribute to market expansion. Expanding market access to developing nations with growing organ transplantation rates represents a significant future growth catalyst.
Leading Players in the Transplant Diagnostics Sector
- BD
- Biofortuna
- Biomérieux SA
- Bio-Rad Laboratories
- Caredx
- F. Hoffman-La Roche
- Gendx
- Hologic
- Illumina
- Immucor
- Luminex
- Merck KGaA
- Omixon
- Qiagen
- Thermo Fisher Scientific
Key Milestones in Transplant Diagnostics Industry
- 2020: Launch of a novel NGS-based test for HLA typing by Illumina.
- 2021: Acquisition of a smaller diagnostics company by Thermo Fisher Scientific, expanding its portfolio.
- 2022: FDA approval of a new rapid diagnostic test for organ rejection.
- 2023: Introduction of a point-of-care diagnostic device for transplant monitoring.
- 2024: Significant investment in AI-based diagnostic technology by several companies.
Strategic Outlook for Transplant Diagnostics Market
The Transplant Diagnostics market shows substantial promise for growth. Continued technological innovation, strategic partnerships, and expansion into emerging markets will drive significant future market potential. Companies adopting a proactive approach to product development and market penetration are well-positioned to capture a substantial share of this expanding market. The focus on personalized medicine and enhanced diagnostic capabilities will continue to shape the market's evolution.
Transplant Diagnostics Segmentation
-
1. Application
- 1.1. Independent Reference Laboratories
- 1.2. Hospitals & Transplant Centers
- 1.3. Research Laboratories & Academic Institutes
-
2. Types
- 2.1. Solid Organ Transplantation
- 2.2. Stem Cell Transplantation
- 2.3. Soft Tissue Transplantation
- 2.4. Bone Marrow Transplantation
Transplant Diagnostics Segmentation By Geography
-
1. North America
- 1.1. United States
- 1.2. Canada
- 1.3. Mexico
-
2. South America
- 2.1. Brazil
- 2.2. Argentina
- 2.3. Rest of South America
-
3. Europe
- 3.1. United Kingdom
- 3.2. Germany
- 3.3. France
- 3.4. Italy
- 3.5. Spain
- 3.6. Russia
- 3.7. Benelux
- 3.8. Nordics
- 3.9. Rest of Europe
-
4. Middle East & Africa
- 4.1. Turkey
- 4.2. Israel
- 4.3. GCC
- 4.4. North Africa
- 4.5. South Africa
- 4.6. Rest of Middle East & Africa
-
5. Asia Pacific
- 5.1. China
- 5.2. India
- 5.3. Japan
- 5.4. South Korea
- 5.5. ASEAN
- 5.6. Oceania
- 5.7. Rest of Asia Pacific
Transplant Diagnostics Regional Market Share
Geographic Coverage of Transplant Diagnostics
Transplant Diagnostics REPORT HIGHLIGHTS
| Aspects | Details |
|---|---|
| Study Period | 2020-2034 |
| Base Year | 2025 |
| Estimated Year | 2026 |
| Forecast Period | 2026-2034 |
| Historical Period | 2020-2025 |
| Growth Rate | CAGR of 5.4% from 2020-2034 |
| Segmentation |
|
Table of Contents
- 1. Introduction
- 1.1. Research Scope
- 1.2. Market Segmentation
- 1.3. Research Objective
- 1.4. Definitions and Assumptions
- 2. Executive Summary
- 2.1. Market Snapshot
- 3. Market Dynamics
- 3.1. Market Drivers
- 3.2. Market Restrains
- 3.3. Market Trends
- 3.4. Market Opportunities
- 4. Market Factor Analysis
- 4.1. Porters Five Forces
- 4.1.1. Bargaining Power of Suppliers
- 4.1.2. Bargaining Power of Buyers
- 4.1.3. Threat of New Entrants
- 4.1.4. Threat of Substitutes
- 4.1.5. Competitive Rivalry
- 4.2. PESTEL analysis
- 4.3. BCG Analysis
- 4.3.1. Stars (High Growth, High Market Share)
- 4.3.2. Cash Cows (Low Growth, High Market Share)
- 4.3.3. Question Mark (High Growth, Low Market Share)
- 4.3.4. Dogs (Low Growth, Low Market Share)
- 4.4. Ansoff Matrix Analysis
- 4.5. Supply Chain Analysis
- 4.6. Regulatory Landscape
- 4.7. Current Market Potential and Opportunity Assessment (TAM–SAM–SOM Framework)
- 4.8. MDP Analyst Note
- 4.1. Porters Five Forces
- 5. Market Analysis, Insights and Forecast 2021-2033
- 5.1. Market Analysis, Insights and Forecast - by Application
- 5.1.1. Independent Reference Laboratories
- 5.1.2. Hospitals & Transplant Centers
- 5.1.3. Research Laboratories & Academic Institutes
- 5.2. Market Analysis, Insights and Forecast - by Types
- 5.2.1. Solid Organ Transplantation
- 5.2.2. Stem Cell Transplantation
- 5.2.3. Soft Tissue Transplantation
- 5.2.4. Bone Marrow Transplantation
- 5.3. Market Analysis, Insights and Forecast - by Region
- 5.3.1. North America
- 5.3.2. South America
- 5.3.3. Europe
- 5.3.4. Middle East & Africa
- 5.3.5. Asia Pacific
- 5.1. Market Analysis, Insights and Forecast - by Application
- 6. Global Transplant Diagnostics Analysis, Insights and Forecast, 2021-2033
- 6.1. Market Analysis, Insights and Forecast - by Application
- 6.1.1. Independent Reference Laboratories
- 6.1.2. Hospitals & Transplant Centers
- 6.1.3. Research Laboratories & Academic Institutes
- 6.2. Market Analysis, Insights and Forecast - by Types
- 6.2.1. Solid Organ Transplantation
- 6.2.2. Stem Cell Transplantation
- 6.2.3. Soft Tissue Transplantation
- 6.2.4. Bone Marrow Transplantation
- 6.1. Market Analysis, Insights and Forecast - by Application
- 7. North America Transplant Diagnostics Analysis, Insights and Forecast, 2020-2032
- 7.1. Market Analysis, Insights and Forecast - by Application
- 7.1.1. Independent Reference Laboratories
- 7.1.2. Hospitals & Transplant Centers
- 7.1.3. Research Laboratories & Academic Institutes
- 7.2. Market Analysis, Insights and Forecast - by Types
- 7.2.1. Solid Organ Transplantation
- 7.2.2. Stem Cell Transplantation
- 7.2.3. Soft Tissue Transplantation
- 7.2.4. Bone Marrow Transplantation
- 7.1. Market Analysis, Insights and Forecast - by Application
- 8. South America Transplant Diagnostics Analysis, Insights and Forecast, 2020-2032
- 8.1. Market Analysis, Insights and Forecast - by Application
- 8.1.1. Independent Reference Laboratories
- 8.1.2. Hospitals & Transplant Centers
- 8.1.3. Research Laboratories & Academic Institutes
- 8.2. Market Analysis, Insights and Forecast - by Types
- 8.2.1. Solid Organ Transplantation
- 8.2.2. Stem Cell Transplantation
- 8.2.3. Soft Tissue Transplantation
- 8.2.4. Bone Marrow Transplantation
- 8.1. Market Analysis, Insights and Forecast - by Application
- 9. Europe Transplant Diagnostics Analysis, Insights and Forecast, 2020-2032
- 9.1. Market Analysis, Insights and Forecast - by Application
- 9.1.1. Independent Reference Laboratories
- 9.1.2. Hospitals & Transplant Centers
- 9.1.3. Research Laboratories & Academic Institutes
- 9.2. Market Analysis, Insights and Forecast - by Types
- 9.2.1. Solid Organ Transplantation
- 9.2.2. Stem Cell Transplantation
- 9.2.3. Soft Tissue Transplantation
- 9.2.4. Bone Marrow Transplantation
- 9.1. Market Analysis, Insights and Forecast - by Application
- 10. Middle East & Africa Transplant Diagnostics Analysis, Insights and Forecast, 2020-2032
- 10.1. Market Analysis, Insights and Forecast - by Application
- 10.1.1. Independent Reference Laboratories
- 10.1.2. Hospitals & Transplant Centers
- 10.1.3. Research Laboratories & Academic Institutes
- 10.2. Market Analysis, Insights and Forecast - by Types
- 10.2.1. Solid Organ Transplantation
- 10.2.2. Stem Cell Transplantation
- 10.2.3. Soft Tissue Transplantation
- 10.2.4. Bone Marrow Transplantation
- 10.1. Market Analysis, Insights and Forecast - by Application
- 11. Asia Pacific Transplant Diagnostics Analysis, Insights and Forecast, 2020-2032
- 11.1. Market Analysis, Insights and Forecast - by Application
- 11.1.1. Independent Reference Laboratories
- 11.1.2. Hospitals & Transplant Centers
- 11.1.3. Research Laboratories & Academic Institutes
- 11.2. Market Analysis, Insights and Forecast - by Types
- 11.2.1. Solid Organ Transplantation
- 11.2.2. Stem Cell Transplantation
- 11.2.3. Soft Tissue Transplantation
- 11.2.4. Bone Marrow Transplantation
- 11.1. Market Analysis, Insights and Forecast - by Application
- 12. Competitive Analysis
- 12.1. Company Profiles
- 12.1.1 BD
- 12.1.1.1. Company Overview
- 12.1.1.2. Products
- 12.1.1.3. Company Financials
- 12.1.1.4. SWOT Analysis
- 12.1.2 Biofortuna
- 12.1.2.1. Company Overview
- 12.1.2.2. Products
- 12.1.2.3. Company Financials
- 12.1.2.4. SWOT Analysis
- 12.1.3 Biomérieux SA
- 12.1.3.1. Company Overview
- 12.1.3.2. Products
- 12.1.3.3. Company Financials
- 12.1.3.4. SWOT Analysis
- 12.1.4 Bio-Rad Laboratories
- 12.1.4.1. Company Overview
- 12.1.4.2. Products
- 12.1.4.3. Company Financials
- 12.1.4.4. SWOT Analysis
- 12.1.5 Caredx
- 12.1.5.1. Company Overview
- 12.1.5.2. Products
- 12.1.5.3. Company Financials
- 12.1.5.4. SWOT Analysis
- 12.1.6 F. Hoffman-La Roche
- 12.1.6.1. Company Overview
- 12.1.6.2. Products
- 12.1.6.3. Company Financials
- 12.1.6.4. SWOT Analysis
- 12.1.7 Gendx
- 12.1.7.1. Company Overview
- 12.1.7.2. Products
- 12.1.7.3. Company Financials
- 12.1.7.4. SWOT Analysis
- 12.1.8 Hologic
- 12.1.8.1. Company Overview
- 12.1.8.2. Products
- 12.1.8.3. Company Financials
- 12.1.8.4. SWOT Analysis
- 12.1.9 Illumina
- 12.1.9.1. Company Overview
- 12.1.9.2. Products
- 12.1.9.3. Company Financials
- 12.1.9.4. SWOT Analysis
- 12.1.10 Immucor
- 12.1.10.1. Company Overview
- 12.1.10.2. Products
- 12.1.10.3. Company Financials
- 12.1.10.4. SWOT Analysis
- 12.1.11 Luminex
- 12.1.11.1. Company Overview
- 12.1.11.2. Products
- 12.1.11.3. Company Financials
- 12.1.11.4. SWOT Analysis
- 12.1.12 Merck KGaA
- 12.1.12.1. Company Overview
- 12.1.12.2. Products
- 12.1.12.3. Company Financials
- 12.1.12.4. SWOT Analysis
- 12.1.13 Omixon
- 12.1.13.1. Company Overview
- 12.1.13.2. Products
- 12.1.13.3. Company Financials
- 12.1.13.4. SWOT Analysis
- 12.1.14 Qiagen
- 12.1.14.1. Company Overview
- 12.1.14.2. Products
- 12.1.14.3. Company Financials
- 12.1.14.4. SWOT Analysis
- 12.1.15 Thermo Fisher Scientific
- 12.1.15.1. Company Overview
- 12.1.15.2. Products
- 12.1.15.3. Company Financials
- 12.1.15.4. SWOT Analysis
- 12.1.1 BD
- 12.2. Market Entropy
- 12.2.1 Company's Key Areas Served
- 12.2.2 Recent Developments
- 12.3. Company Market Share Analysis 2025
- 12.3.1 Top 5 Companies Market Share Analysis
- 12.3.2 Top 3 Companies Market Share Analysis
- 12.4. List of Potential Customers
- 13. Research Methodology
List of Figures
- Figure 1: Global Transplant Diagnostics Revenue Breakdown (million, %) by Region 2025 & 2033
- Figure 2: North America Transplant Diagnostics Revenue (million), by Application 2025 & 2033
- Figure 3: North America Transplant Diagnostics Revenue Share (%), by Application 2025 & 2033
- Figure 4: North America Transplant Diagnostics Revenue (million), by Types 2025 & 2033
- Figure 5: North America Transplant Diagnostics Revenue Share (%), by Types 2025 & 2033
- Figure 6: North America Transplant Diagnostics Revenue (million), by Country 2025 & 2033
- Figure 7: North America Transplant Diagnostics Revenue Share (%), by Country 2025 & 2033
- Figure 8: South America Transplant Diagnostics Revenue (million), by Application 2025 & 2033
- Figure 9: South America Transplant Diagnostics Revenue Share (%), by Application 2025 & 2033
- Figure 10: South America Transplant Diagnostics Revenue (million), by Types 2025 & 2033
- Figure 11: South America Transplant Diagnostics Revenue Share (%), by Types 2025 & 2033
- Figure 12: South America Transplant Diagnostics Revenue (million), by Country 2025 & 2033
- Figure 13: South America Transplant Diagnostics Revenue Share (%), by Country 2025 & 2033
- Figure 14: Europe Transplant Diagnostics Revenue (million), by Application 2025 & 2033
- Figure 15: Europe Transplant Diagnostics Revenue Share (%), by Application 2025 & 2033
- Figure 16: Europe Transplant Diagnostics Revenue (million), by Types 2025 & 2033
- Figure 17: Europe Transplant Diagnostics Revenue Share (%), by Types 2025 & 2033
- Figure 18: Europe Transplant Diagnostics Revenue (million), by Country 2025 & 2033
- Figure 19: Europe Transplant Diagnostics Revenue Share (%), by Country 2025 & 2033
- Figure 20: Middle East & Africa Transplant Diagnostics Revenue (million), by Application 2025 & 2033
- Figure 21: Middle East & Africa Transplant Diagnostics Revenue Share (%), by Application 2025 & 2033
- Figure 22: Middle East & Africa Transplant Diagnostics Revenue (million), by Types 2025 & 2033
- Figure 23: Middle East & Africa Transplant Diagnostics Revenue Share (%), by Types 2025 & 2033
- Figure 24: Middle East & Africa Transplant Diagnostics Revenue (million), by Country 2025 & 2033
- Figure 25: Middle East & Africa Transplant Diagnostics Revenue Share (%), by Country 2025 & 2033
- Figure 26: Asia Pacific Transplant Diagnostics Revenue (million), by Application 2025 & 2033
- Figure 27: Asia Pacific Transplant Diagnostics Revenue Share (%), by Application 2025 & 2033
- Figure 28: Asia Pacific Transplant Diagnostics Revenue (million), by Types 2025 & 2033
- Figure 29: Asia Pacific Transplant Diagnostics Revenue Share (%), by Types 2025 & 2033
- Figure 30: Asia Pacific Transplant Diagnostics Revenue (million), by Country 2025 & 2033
- Figure 31: Asia Pacific Transplant Diagnostics Revenue Share (%), by Country 2025 & 2033
List of Tables
- Table 1: Global Transplant Diagnostics Revenue million Forecast, by Application 2020 & 2033
- Table 2: Global Transplant Diagnostics Revenue million Forecast, by Types 2020 & 2033
- Table 3: Global Transplant Diagnostics Revenue million Forecast, by Region 2020 & 2033
- Table 4: Global Transplant Diagnostics Revenue million Forecast, by Application 2020 & 2033
- Table 5: Global Transplant Diagnostics Revenue million Forecast, by Types 2020 & 2033
- Table 6: Global Transplant Diagnostics Revenue million Forecast, by Country 2020 & 2033
- Table 7: United States Transplant Diagnostics Revenue (million) Forecast, by Application 2020 & 2033
- Table 8: Canada Transplant Diagnostics Revenue (million) Forecast, by Application 2020 & 2033
- Table 9: Mexico Transplant Diagnostics Revenue (million) Forecast, by Application 2020 & 2033
- Table 10: Global Transplant Diagnostics Revenue million Forecast, by Application 2020 & 2033
- Table 11: Global Transplant Diagnostics Revenue million Forecast, by Types 2020 & 2033
- Table 12: Global Transplant Diagnostics Revenue million Forecast, by Country 2020 & 2033
- Table 13: Brazil Transplant Diagnostics Revenue (million) Forecast, by Application 2020 & 2033
- Table 14: Argentina Transplant Diagnostics Revenue (million) Forecast, by Application 2020 & 2033
- Table 15: Rest of South America Transplant Diagnostics Revenue (million) Forecast, by Application 2020 & 2033
- Table 16: Global Transplant Diagnostics Revenue million Forecast, by Application 2020 & 2033
- Table 17: Global Transplant Diagnostics Revenue million Forecast, by Types 2020 & 2033
- Table 18: Global Transplant Diagnostics Revenue million Forecast, by Country 2020 & 2033
- Table 19: United Kingdom Transplant Diagnostics Revenue (million) Forecast, by Application 2020 & 2033
- Table 20: Germany Transplant Diagnostics Revenue (million) Forecast, by Application 2020 & 2033
- Table 21: France Transplant Diagnostics Revenue (million) Forecast, by Application 2020 & 2033
- Table 22: Italy Transplant Diagnostics Revenue (million) Forecast, by Application 2020 & 2033
- Table 23: Spain Transplant Diagnostics Revenue (million) Forecast, by Application 2020 & 2033
- Table 24: Russia Transplant Diagnostics Revenue (million) Forecast, by Application 2020 & 2033
- Table 25: Benelux Transplant Diagnostics Revenue (million) Forecast, by Application 2020 & 2033
- Table 26: Nordics Transplant Diagnostics Revenue (million) Forecast, by Application 2020 & 2033
- Table 27: Rest of Europe Transplant Diagnostics Revenue (million) Forecast, by Application 2020 & 2033
- Table 28: Global Transplant Diagnostics Revenue million Forecast, by Application 2020 & 2033
- Table 29: Global Transplant Diagnostics Revenue million Forecast, by Types 2020 & 2033
- Table 30: Global Transplant Diagnostics Revenue million Forecast, by Country 2020 & 2033
- Table 31: Turkey Transplant Diagnostics Revenue (million) Forecast, by Application 2020 & 2033
- Table 32: Israel Transplant Diagnostics Revenue (million) Forecast, by Application 2020 & 2033
- Table 33: GCC Transplant Diagnostics Revenue (million) Forecast, by Application 2020 & 2033
- Table 34: North Africa Transplant Diagnostics Revenue (million) Forecast, by Application 2020 & 2033
- Table 35: South Africa Transplant Diagnostics Revenue (million) Forecast, by Application 2020 & 2033
- Table 36: Rest of Middle East & Africa Transplant Diagnostics Revenue (million) Forecast, by Application 2020 & 2033
- Table 37: Global Transplant Diagnostics Revenue million Forecast, by Application 2020 & 2033
- Table 38: Global Transplant Diagnostics Revenue million Forecast, by Types 2020 & 2033
- Table 39: Global Transplant Diagnostics Revenue million Forecast, by Country 2020 & 2033
- Table 40: China Transplant Diagnostics Revenue (million) Forecast, by Application 2020 & 2033
- Table 41: India Transplant Diagnostics Revenue (million) Forecast, by Application 2020 & 2033
- Table 42: Japan Transplant Diagnostics Revenue (million) Forecast, by Application 2020 & 2033
- Table 43: South Korea Transplant Diagnostics Revenue (million) Forecast, by Application 2020 & 2033
- Table 44: ASEAN Transplant Diagnostics Revenue (million) Forecast, by Application 2020 & 2033
- Table 45: Oceania Transplant Diagnostics Revenue (million) Forecast, by Application 2020 & 2033
- Table 46: Rest of Asia Pacific Transplant Diagnostics Revenue (million) Forecast, by Application 2020 & 2033
Frequently Asked Questions
1. What is the projected Compound Annual Growth Rate (CAGR) of the Transplant Diagnostics?
The projected CAGR is approximately 5.4%.
2. Which companies are prominent players in the Transplant Diagnostics?
Key companies in the market include BD, Biofortuna, Biomérieux SA, Bio-Rad Laboratories, Caredx, F. Hoffman-La Roche, Gendx, Hologic, Illumina, Immucor, Luminex, Merck KGaA, Omixon, Qiagen, Thermo Fisher Scientific.
3. What are the main segments of the Transplant Diagnostics?
The market segments include Application, Types.
4. Can you provide details about the market size?
The market size is estimated to be USD 4084.1 million as of 2022.
5. What are some drivers contributing to market growth?
N/A
6. What are the notable trends driving market growth?
N/A
7. Are there any restraints impacting market growth?
N/A
8. Can you provide examples of recent developments in the market?
N/A
9. What pricing options are available for accessing the report?
Pricing options include single-user, multi-user, and enterprise licenses priced at USD 2900.00, USD 4350.00, and USD 5800.00 respectively.
10. Is the market size provided in terms of value or volume?
The market size is provided in terms of value, measured in million.
11. Are there any specific market keywords associated with the report?
Yes, the market keyword associated with the report is "Transplant Diagnostics," which aids in identifying and referencing the specific market segment covered.
12. How do I determine which pricing option suits my needs best?
The pricing options vary based on user requirements and access needs. Individual users may opt for single-user licenses, while businesses requiring broader access may choose multi-user or enterprise licenses for cost-effective access to the report.
13. Are there any additional resources or data provided in the Transplant Diagnostics report?
While the report offers comprehensive insights, it's advisable to review the specific contents or supplementary materials provided to ascertain if additional resources or data are available.
14. How can I stay updated on further developments or reports in the Transplant Diagnostics?
To stay informed about further developments, trends, and reports in the Transplant Diagnostics, consider subscribing to industry newsletters, following relevant companies and organizations, or regularly checking reputable industry news sources and publications.
Methodology
Step 1 - Identification of Relevant Samples Size from Population Database


Step 2 - Approaches for Defining Global Market Size (Value, Volume* & Price*)

Note*: In applicable scenarios
Step 3 - Data Sources
Primary Research
- Web Analytics
- Survey Reports
- Research Institute
- Latest Research Reports
- Opinion Leaders
Secondary Research
- Annual Reports
- White Paper
- Latest Press Release
- Industry Association
- Paid Database
- Investor Presentations

Step 4 - Data Triangulation
Involves using different sources of information in order to increase the validity of a study
These sources are likely to be stakeholders in a program - participants, other researchers, program staff, other community members, and so on.
Then we put all data in single framework & apply various statistical tools to find out the dynamic on the market.
During the analysis stage, feedback from the stakeholder groups would be compared to determine areas of agreement as well as areas of divergence