

Key Insights
The global tracheotomy tube market, valued at $194 million in 2025, is projected to experience steady growth, driven by a rising prevalence of respiratory illnesses requiring tracheotomy, an aging global population necessitating long-term respiratory support, and advancements in minimally invasive surgical techniques. The 3.8% CAGR indicates a consistent, albeit moderate, expansion over the forecast period (2025-2033). Key growth drivers include the increasing adoption of disposable tracheostomy tubes, improving patient comfort and reducing infection risks. Furthermore, technological advancements leading to smaller, more comfortable tubes with improved features like integrated cuffs and speaking valves contribute to market growth. However, the market faces restraints such as the potential complications associated with tracheostomy procedures (e.g., bleeding, infection), the high cost of advanced tracheotomy tubes, and the availability of alternative respiratory support methods. The market is segmented by product type (disposable vs. reusable), material (silicone, PVC, etc.), and end-user (hospitals, home care settings). Competitive landscape analysis reveals key players like Medtronic, Teleflex Medical, and Smiths Medical dominating the market due to their strong brand reputation, extensive distribution networks, and continuous innovation in product development. The market is likely to see increased competition from emerging market players focusing on cost-effective and innovative solutions. Regional variations are expected, with North America and Europe potentially holding the largest market share due to advanced healthcare infrastructure and higher per capita healthcare expenditure.
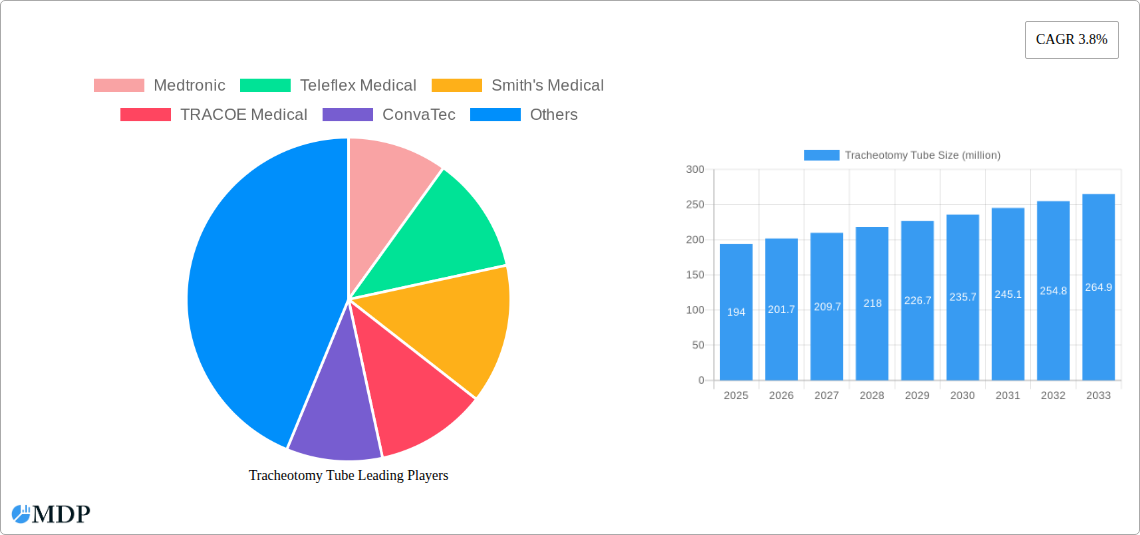
Tracheotomy Tube Market Size (In Million)
Growth in the tracheotomy tube market is expected to be fueled by the increasing incidence of chronic obstructive pulmonary disease (COPD), neuromuscular disorders, and traumatic brain injuries, all of which often necessitate tracheostomy. Further contributing to market expansion is the growing preference for home healthcare settings, requiring readily available and user-friendly tracheotomy tubes. However, regulatory hurdles and stringent approval processes in certain regions could potentially impede market growth. The industry is likely to witness strategic partnerships, mergers, and acquisitions to strengthen market presence and expand product portfolios. Companies will increasingly focus on product differentiation, emphasizing features such as improved patient comfort, reduced complications, and enhanced ease of use. The market's future growth will depend on effectively addressing patient safety concerns, developing cost-effective solutions, and focusing on technological improvements leading to more comfortable and efficient tracheotomy tubes.

Tracheotomy Tube Company Market Share
Tracheotomy Tube Market Report: A Comprehensive Analysis (2019-2033)
This comprehensive report provides an in-depth analysis of the global Tracheotomy Tube market, projecting a market valuation exceeding $XX million by 2033. The study covers the period 2019-2033, with a base year of 2025 and a forecast period spanning 2025-2033. Key players like Medtronic, Teleflex Medical, Smith's Medical, and others are analyzed, revealing crucial market trends and future growth prospects. This report is invaluable for industry stakeholders, investors, and healthcare professionals seeking to understand and navigate this vital medical device market.
Tracheotomy Tube Market Dynamics & Concentration
The global tracheotomy tube market exhibits a moderately consolidated structure, with a few major players holding significant market share. Medtronic, Teleflex Medical, and Smiths Medical account for approximately XX% of the global market in 2025. The market’s dynamics are influenced by several factors including:
- Innovation Drivers: Continuous innovation in materials, designs (e.g., disposable vs. reusable, cuffless vs. cuffed), and functionalities (e.g., integrated humidification, antimicrobial properties) drives market growth.
- Regulatory Frameworks: Stringent regulatory approvals (FDA, CE marking) and safety standards influence product development and market entry. Compliance costs contribute to overall market pricing.
- Product Substitutes: While limited, alternative airway management techniques pose a subtle competitive pressure.
- End-User Trends: Increasing prevalence of respiratory diseases and a rising aging population are major factors driving demand. Hospitals and long-term care facilities remain primary end-users.
- M&A Activities: The market has witnessed XX M&A deals between 2019 and 2024, largely driven by companies seeking to expand their product portfolio and geographic reach. This consolidated the market further. The average deal size was approximately $XX million.
Tracheotomy Tube Industry Trends & Analysis
The global tracheotomy tube market is projected to exhibit a Compound Annual Growth Rate (CAGR) of XX% during the forecast period (2025-2033). This growth is fueled by several key factors:
The increasing prevalence of chronic respiratory diseases like COPD and asthma, coupled with the rising geriatric population susceptible to respiratory complications, significantly contributes to market expansion. Technological advancements in tube materials (e.g., silicone, PVC), design improvements for enhanced patient comfort, and the introduction of innovative features (e.g., antimicrobial coatings) are driving product adoption and market growth. Consumer preferences are shifting towards disposable tubes for enhanced hygiene and reduced risk of infection, impacting sales. The competitive landscape, characterized by ongoing innovation and strategic partnerships, further influences market dynamics and growth trajectories. Market penetration in emerging economies is expected to rise significantly with improved healthcare infrastructure. The global market size is anticipated to reach approximately $XX million by 2033, representing a considerable increase from the $XX million recorded in 2025.
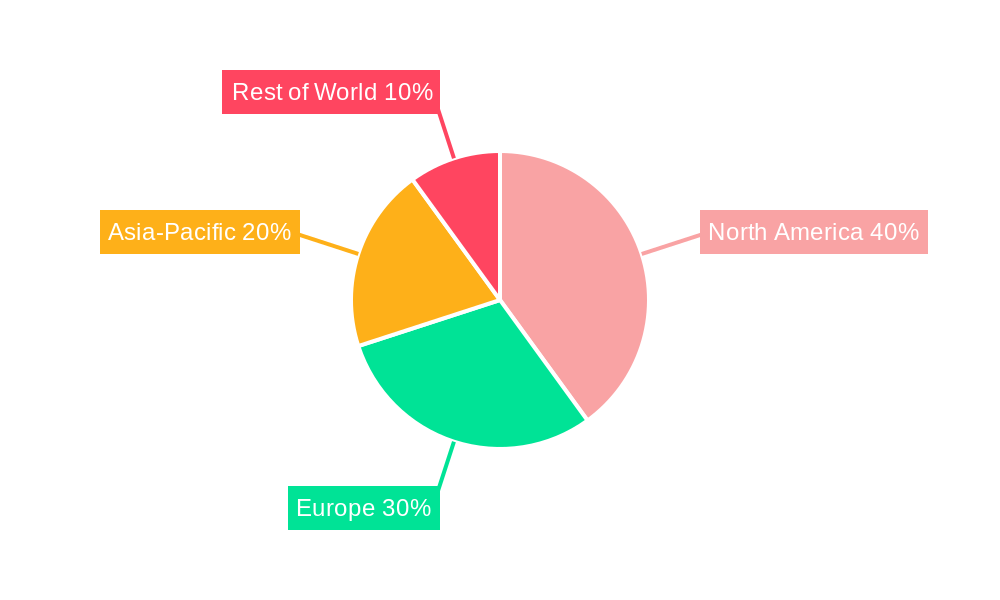
Leading Markets & Segments in Tracheotomy Tube
North America currently dominates the global tracheotomy tube market, driven by factors such as advanced healthcare infrastructure, high prevalence of respiratory diseases, and high healthcare expenditure.
- Key Drivers in North America:
- Advanced healthcare infrastructure and robust reimbursement policies.
- High prevalence of chronic respiratory illnesses.
- Significant investments in R&D by leading medical device companies.
- High awareness among healthcare professionals about tracheotomy tube benefits.
The European market is also a significant contributor, with growth fueled by an aging population and increasing awareness of respiratory health issues. Other regions such as Asia-Pacific are witnessing rapid growth driven by rising healthcare spending and increasing prevalence of respiratory diseases.
Tracheotomy Tube Product Developments
Recent advancements in tracheotomy tube technology have focused on improving patient comfort and reducing complications. Innovations include the development of smaller, less-invasive tubes, cuffless designs minimizing tissue trauma, and the integration of antimicrobial properties to prevent infections. These developments cater to evolving patient needs and address challenges associated with traditional tracheotomy tubes, enhancing their overall market appeal and competitiveness.
Key Drivers of Tracheotomy Tube Growth
Several factors are driving the expansion of the tracheotomy tube market. Technological advancements resulting in improved patient comfort and reduced infection risks are a primary driver. The growing prevalence of chronic respiratory diseases and an aging global population are fueling demand. Favorable regulatory environments and increasing healthcare spending also contribute significantly to market growth.
Challenges in the Tracheotomy Tube Market
The tracheotomy tube market faces challenges, including stringent regulatory approvals impacting product launch timelines and increasing costs. Supply chain disruptions can cause intermittent shortages and price volatility. Intense competition amongst established players and the potential for new entrants also presents significant challenges. These factors collectively impact market stability and overall growth.
Emerging Opportunities in Tracheotomy Tube
The market presents significant long-term growth opportunities. Technological advancements, such as the development of smart tracheotomy tubes with integrated monitoring capabilities, offer significant potential. Strategic partnerships between medical device companies and healthcare providers can drive market expansion. Expansion into emerging markets with unmet needs and growing healthcare investments presents lucrative opportunities for growth.
Leading Players in the Tracheotomy Tube Sector
- Medtronic
- Teleflex Medical
- Smith's Medical
- TRACOE Medical
- ConvaTec
- Fuji Systems
- Sewoon Medical
- Boston Medical
- Well Lead
- TuoRen
- Pulmodyne
Key Milestones in Tracheotomy Tube Industry
- 2020: Launch of a new cuffless tracheotomy tube by Medtronic.
- 2021: Acquisition of a smaller tracheotomy tube manufacturer by Teleflex Medical.
- 2022: FDA approval for a novel antimicrobial tracheotomy tube.
- 2023: Introduction of a smart tracheotomy tube with integrated monitoring capabilities by a smaller player.
- 2024: Significant increase in demand due to the pandemic.
Strategic Outlook for Tracheotomy Tube Market
The tracheotomy tube market holds substantial potential for future growth driven by technological innovations, increasing prevalence of respiratory diseases, and rising healthcare expenditure globally. Strategic partnerships, focus on emerging markets, and development of innovative products with enhanced functionalities will be crucial factors in achieving sustained market expansion and profitability.
Tracheotomy Tube Segmentation
-
1. Application
- 1.1. ICU Therapy
- 1.2. Emergency Treatment
-
2. Types
- 2.1. PVC Tracheostomy Tube
- 2.2. Silicone Rubber Tracheostomy Tube
- 2.3. Others
Tracheotomy Tube Segmentation By Geography
-
1. North America
- 1.1. United States
- 1.2. Canada
- 1.3. Mexico
-
2. South America
- 2.1. Brazil
- 2.2. Argentina
- 2.3. Rest of South America
-
3. Europe
- 3.1. United Kingdom
- 3.2. Germany
- 3.3. France
- 3.4. Italy
- 3.5. Spain
- 3.6. Russia
- 3.7. Benelux
- 3.8. Nordics
- 3.9. Rest of Europe
-
4. Middle East & Africa
- 4.1. Turkey
- 4.2. Israel
- 4.3. GCC
- 4.4. North Africa
- 4.5. South Africa
- 4.6. Rest of Middle East & Africa
-
5. Asia Pacific
- 5.1. China
- 5.2. India
- 5.3. Japan
- 5.4. South Korea
- 5.5. ASEAN
- 5.6. Oceania
- 5.7. Rest of Asia Pacific
Tracheotomy Tube Regional Market Share
Geographic Coverage of Tracheotomy Tube
Tracheotomy Tube REPORT HIGHLIGHTS
| Aspects | Details |
|---|---|
| Study Period | 2020-2034 |
| Base Year | 2025 |
| Estimated Year | 2026 |
| Forecast Period | 2026-2034 |
| Historical Period | 2020-2025 |
| Growth Rate | CAGR of 3.8% from 2020-2034 |
| Segmentation |
|
Table of Contents
- 1. Introduction
- 1.1. Research Scope
- 1.2. Market Segmentation
- 1.3. Research Objective
- 1.4. Definitions and Assumptions
- 2. Executive Summary
- 2.1. Market Snapshot
- 3. Market Dynamics
- 3.1. Market Drivers
- 3.2. Market Restrains
- 3.3. Market Trends
- 3.4. Market Opportunities
- 4. Market Factor Analysis
- 4.1. Porters Five Forces
- 4.1.1. Bargaining Power of Suppliers
- 4.1.2. Bargaining Power of Buyers
- 4.1.3. Threat of New Entrants
- 4.1.4. Threat of Substitutes
- 4.1.5. Competitive Rivalry
- 4.2. PESTEL analysis
- 4.3. BCG Analysis
- 4.3.1. Stars (High Growth, High Market Share)
- 4.3.2. Cash Cows (Low Growth, High Market Share)
- 4.3.3. Question Mark (High Growth, Low Market Share)
- 4.3.4. Dogs (Low Growth, Low Market Share)
- 4.4. Ansoff Matrix Analysis
- 4.5. Supply Chain Analysis
- 4.6. Regulatory Landscape
- 4.7. Current Market Potential and Opportunity Assessment (TAM–SAM–SOM Framework)
- 4.8. MDP Analyst Note
- 4.1. Porters Five Forces
- 5. Market Analysis, Insights and Forecast 2021-2033
- 5.1. Market Analysis, Insights and Forecast - by Application
- 5.1.1. ICU Therapy
- 5.1.2. Emergency Treatment
- 5.2. Market Analysis, Insights and Forecast - by Types
- 5.2.1. PVC Tracheostomy Tube
- 5.2.2. Silicone Rubber Tracheostomy Tube
- 5.2.3. Others
- 5.3. Market Analysis, Insights and Forecast - by Region
- 5.3.1. North America
- 5.3.2. South America
- 5.3.3. Europe
- 5.3.4. Middle East & Africa
- 5.3.5. Asia Pacific
- 5.1. Market Analysis, Insights and Forecast - by Application
- 6. Global Tracheotomy Tube Analysis, Insights and Forecast, 2021-2033
- 6.1. Market Analysis, Insights and Forecast - by Application
- 6.1.1. ICU Therapy
- 6.1.2. Emergency Treatment
- 6.2. Market Analysis, Insights and Forecast - by Types
- 6.2.1. PVC Tracheostomy Tube
- 6.2.2. Silicone Rubber Tracheostomy Tube
- 6.2.3. Others
- 6.1. Market Analysis, Insights and Forecast - by Application
- 7. North America Tracheotomy Tube Analysis, Insights and Forecast, 2020-2032
- 7.1. Market Analysis, Insights and Forecast - by Application
- 7.1.1. ICU Therapy
- 7.1.2. Emergency Treatment
- 7.2. Market Analysis, Insights and Forecast - by Types
- 7.2.1. PVC Tracheostomy Tube
- 7.2.2. Silicone Rubber Tracheostomy Tube
- 7.2.3. Others
- 7.1. Market Analysis, Insights and Forecast - by Application
- 8. South America Tracheotomy Tube Analysis, Insights and Forecast, 2020-2032
- 8.1. Market Analysis, Insights and Forecast - by Application
- 8.1.1. ICU Therapy
- 8.1.2. Emergency Treatment
- 8.2. Market Analysis, Insights and Forecast - by Types
- 8.2.1. PVC Tracheostomy Tube
- 8.2.2. Silicone Rubber Tracheostomy Tube
- 8.2.3. Others
- 8.1. Market Analysis, Insights and Forecast - by Application
- 9. Europe Tracheotomy Tube Analysis, Insights and Forecast, 2020-2032
- 9.1. Market Analysis, Insights and Forecast - by Application
- 9.1.1. ICU Therapy
- 9.1.2. Emergency Treatment
- 9.2. Market Analysis, Insights and Forecast - by Types
- 9.2.1. PVC Tracheostomy Tube
- 9.2.2. Silicone Rubber Tracheostomy Tube
- 9.2.3. Others
- 9.1. Market Analysis, Insights and Forecast - by Application
- 10. Middle East & Africa Tracheotomy Tube Analysis, Insights and Forecast, 2020-2032
- 10.1. Market Analysis, Insights and Forecast - by Application
- 10.1.1. ICU Therapy
- 10.1.2. Emergency Treatment
- 10.2. Market Analysis, Insights and Forecast - by Types
- 10.2.1. PVC Tracheostomy Tube
- 10.2.2. Silicone Rubber Tracheostomy Tube
- 10.2.3. Others
- 10.1. Market Analysis, Insights and Forecast - by Application
- 11. Asia Pacific Tracheotomy Tube Analysis, Insights and Forecast, 2020-2032
- 11.1. Market Analysis, Insights and Forecast - by Application
- 11.1.1. ICU Therapy
- 11.1.2. Emergency Treatment
- 11.2. Market Analysis, Insights and Forecast - by Types
- 11.2.1. PVC Tracheostomy Tube
- 11.2.2. Silicone Rubber Tracheostomy Tube
- 11.2.3. Others
- 11.1. Market Analysis, Insights and Forecast - by Application
- 12. Competitive Analysis
- 12.1. Company Profiles
- 12.1.1 Medtronic
- 12.1.1.1. Company Overview
- 12.1.1.2. Products
- 12.1.1.3. Company Financials
- 12.1.1.4. SWOT Analysis
- 12.1.2 Teleflex Medical
- 12.1.2.1. Company Overview
- 12.1.2.2. Products
- 12.1.2.3. Company Financials
- 12.1.2.4. SWOT Analysis
- 12.1.3 Smith's Medical
- 12.1.3.1. Company Overview
- 12.1.3.2. Products
- 12.1.3.3. Company Financials
- 12.1.3.4. SWOT Analysis
- 12.1.4 TRACOE Medical
- 12.1.4.1. Company Overview
- 12.1.4.2. Products
- 12.1.4.3. Company Financials
- 12.1.4.4. SWOT Analysis
- 12.1.5 ConvaTec
- 12.1.5.1. Company Overview
- 12.1.5.2. Products
- 12.1.5.3. Company Financials
- 12.1.5.4. SWOT Analysis
- 12.1.6 Fuji Systems
- 12.1.6.1. Company Overview
- 12.1.6.2. Products
- 12.1.6.3. Company Financials
- 12.1.6.4. SWOT Analysis
- 12.1.7 Sewoon Medical
- 12.1.7.1. Company Overview
- 12.1.7.2. Products
- 12.1.7.3. Company Financials
- 12.1.7.4. SWOT Analysis
- 12.1.8 Boston Medical
- 12.1.8.1. Company Overview
- 12.1.8.2. Products
- 12.1.8.3. Company Financials
- 12.1.8.4. SWOT Analysis
- 12.1.9 Well Lead
- 12.1.9.1. Company Overview
- 12.1.9.2. Products
- 12.1.9.3. Company Financials
- 12.1.9.4. SWOT Analysis
- 12.1.10 TuoRen
- 12.1.10.1. Company Overview
- 12.1.10.2. Products
- 12.1.10.3. Company Financials
- 12.1.10.4. SWOT Analysis
- 12.1.11 Pulmodyne
- 12.1.11.1. Company Overview
- 12.1.11.2. Products
- 12.1.11.3. Company Financials
- 12.1.11.4. SWOT Analysis
- 12.1.1 Medtronic
- 12.2. Market Entropy
- 12.2.1 Company's Key Areas Served
- 12.2.2 Recent Developments
- 12.3. Company Market Share Analysis 2025
- 12.3.1 Top 5 Companies Market Share Analysis
- 12.3.2 Top 3 Companies Market Share Analysis
- 12.4. List of Potential Customers
- 13. Research Methodology
List of Figures
- Figure 1: Global Tracheotomy Tube Revenue Breakdown (million, %) by Region 2025 & 2033
- Figure 2: Global Tracheotomy Tube Volume Breakdown (K, %) by Region 2025 & 2033
- Figure 3: North America Tracheotomy Tube Revenue (million), by Application 2025 & 2033
- Figure 4: North America Tracheotomy Tube Volume (K), by Application 2025 & 2033
- Figure 5: North America Tracheotomy Tube Revenue Share (%), by Application 2025 & 2033
- Figure 6: North America Tracheotomy Tube Volume Share (%), by Application 2025 & 2033
- Figure 7: North America Tracheotomy Tube Revenue (million), by Types 2025 & 2033
- Figure 8: North America Tracheotomy Tube Volume (K), by Types 2025 & 2033
- Figure 9: North America Tracheotomy Tube Revenue Share (%), by Types 2025 & 2033
- Figure 10: North America Tracheotomy Tube Volume Share (%), by Types 2025 & 2033
- Figure 11: North America Tracheotomy Tube Revenue (million), by Country 2025 & 2033
- Figure 12: North America Tracheotomy Tube Volume (K), by Country 2025 & 2033
- Figure 13: North America Tracheotomy Tube Revenue Share (%), by Country 2025 & 2033
- Figure 14: North America Tracheotomy Tube Volume Share (%), by Country 2025 & 2033
- Figure 15: South America Tracheotomy Tube Revenue (million), by Application 2025 & 2033
- Figure 16: South America Tracheotomy Tube Volume (K), by Application 2025 & 2033
- Figure 17: South America Tracheotomy Tube Revenue Share (%), by Application 2025 & 2033
- Figure 18: South America Tracheotomy Tube Volume Share (%), by Application 2025 & 2033
- Figure 19: South America Tracheotomy Tube Revenue (million), by Types 2025 & 2033
- Figure 20: South America Tracheotomy Tube Volume (K), by Types 2025 & 2033
- Figure 21: South America Tracheotomy Tube Revenue Share (%), by Types 2025 & 2033
- Figure 22: South America Tracheotomy Tube Volume Share (%), by Types 2025 & 2033
- Figure 23: South America Tracheotomy Tube Revenue (million), by Country 2025 & 2033
- Figure 24: South America Tracheotomy Tube Volume (K), by Country 2025 & 2033
- Figure 25: South America Tracheotomy Tube Revenue Share (%), by Country 2025 & 2033
- Figure 26: South America Tracheotomy Tube Volume Share (%), by Country 2025 & 2033
- Figure 27: Europe Tracheotomy Tube Revenue (million), by Application 2025 & 2033
- Figure 28: Europe Tracheotomy Tube Volume (K), by Application 2025 & 2033
- Figure 29: Europe Tracheotomy Tube Revenue Share (%), by Application 2025 & 2033
- Figure 30: Europe Tracheotomy Tube Volume Share (%), by Application 2025 & 2033
- Figure 31: Europe Tracheotomy Tube Revenue (million), by Types 2025 & 2033
- Figure 32: Europe Tracheotomy Tube Volume (K), by Types 2025 & 2033
- Figure 33: Europe Tracheotomy Tube Revenue Share (%), by Types 2025 & 2033
- Figure 34: Europe Tracheotomy Tube Volume Share (%), by Types 2025 & 2033
- Figure 35: Europe Tracheotomy Tube Revenue (million), by Country 2025 & 2033
- Figure 36: Europe Tracheotomy Tube Volume (K), by Country 2025 & 2033
- Figure 37: Europe Tracheotomy Tube Revenue Share (%), by Country 2025 & 2033
- Figure 38: Europe Tracheotomy Tube Volume Share (%), by Country 2025 & 2033
- Figure 39: Middle East & Africa Tracheotomy Tube Revenue (million), by Application 2025 & 2033
- Figure 40: Middle East & Africa Tracheotomy Tube Volume (K), by Application 2025 & 2033
- Figure 41: Middle East & Africa Tracheotomy Tube Revenue Share (%), by Application 2025 & 2033
- Figure 42: Middle East & Africa Tracheotomy Tube Volume Share (%), by Application 2025 & 2033
- Figure 43: Middle East & Africa Tracheotomy Tube Revenue (million), by Types 2025 & 2033
- Figure 44: Middle East & Africa Tracheotomy Tube Volume (K), by Types 2025 & 2033
- Figure 45: Middle East & Africa Tracheotomy Tube Revenue Share (%), by Types 2025 & 2033
- Figure 46: Middle East & Africa Tracheotomy Tube Volume Share (%), by Types 2025 & 2033
- Figure 47: Middle East & Africa Tracheotomy Tube Revenue (million), by Country 2025 & 2033
- Figure 48: Middle East & Africa Tracheotomy Tube Volume (K), by Country 2025 & 2033
- Figure 49: Middle East & Africa Tracheotomy Tube Revenue Share (%), by Country 2025 & 2033
- Figure 50: Middle East & Africa Tracheotomy Tube Volume Share (%), by Country 2025 & 2033
- Figure 51: Asia Pacific Tracheotomy Tube Revenue (million), by Application 2025 & 2033
- Figure 52: Asia Pacific Tracheotomy Tube Volume (K), by Application 2025 & 2033
- Figure 53: Asia Pacific Tracheotomy Tube Revenue Share (%), by Application 2025 & 2033
- Figure 54: Asia Pacific Tracheotomy Tube Volume Share (%), by Application 2025 & 2033
- Figure 55: Asia Pacific Tracheotomy Tube Revenue (million), by Types 2025 & 2033
- Figure 56: Asia Pacific Tracheotomy Tube Volume (K), by Types 2025 & 2033
- Figure 57: Asia Pacific Tracheotomy Tube Revenue Share (%), by Types 2025 & 2033
- Figure 58: Asia Pacific Tracheotomy Tube Volume Share (%), by Types 2025 & 2033
- Figure 59: Asia Pacific Tracheotomy Tube Revenue (million), by Country 2025 & 2033
- Figure 60: Asia Pacific Tracheotomy Tube Volume (K), by Country 2025 & 2033
- Figure 61: Asia Pacific Tracheotomy Tube Revenue Share (%), by Country 2025 & 2033
- Figure 62: Asia Pacific Tracheotomy Tube Volume Share (%), by Country 2025 & 2033
List of Tables
- Table 1: Global Tracheotomy Tube Revenue million Forecast, by Application 2020 & 2033
- Table 2: Global Tracheotomy Tube Volume K Forecast, by Application 2020 & 2033
- Table 3: Global Tracheotomy Tube Revenue million Forecast, by Types 2020 & 2033
- Table 4: Global Tracheotomy Tube Volume K Forecast, by Types 2020 & 2033
- Table 5: Global Tracheotomy Tube Revenue million Forecast, by Region 2020 & 2033
- Table 6: Global Tracheotomy Tube Volume K Forecast, by Region 2020 & 2033
- Table 7: Global Tracheotomy Tube Revenue million Forecast, by Application 2020 & 2033
- Table 8: Global Tracheotomy Tube Volume K Forecast, by Application 2020 & 2033
- Table 9: Global Tracheotomy Tube Revenue million Forecast, by Types 2020 & 2033
- Table 10: Global Tracheotomy Tube Volume K Forecast, by Types 2020 & 2033
- Table 11: Global Tracheotomy Tube Revenue million Forecast, by Country 2020 & 2033
- Table 12: Global Tracheotomy Tube Volume K Forecast, by Country 2020 & 2033
- Table 13: United States Tracheotomy Tube Revenue (million) Forecast, by Application 2020 & 2033
- Table 14: United States Tracheotomy Tube Volume (K) Forecast, by Application 2020 & 2033
- Table 15: Canada Tracheotomy Tube Revenue (million) Forecast, by Application 2020 & 2033
- Table 16: Canada Tracheotomy Tube Volume (K) Forecast, by Application 2020 & 2033
- Table 17: Mexico Tracheotomy Tube Revenue (million) Forecast, by Application 2020 & 2033
- Table 18: Mexico Tracheotomy Tube Volume (K) Forecast, by Application 2020 & 2033
- Table 19: Global Tracheotomy Tube Revenue million Forecast, by Application 2020 & 2033
- Table 20: Global Tracheotomy Tube Volume K Forecast, by Application 2020 & 2033
- Table 21: Global Tracheotomy Tube Revenue million Forecast, by Types 2020 & 2033
- Table 22: Global Tracheotomy Tube Volume K Forecast, by Types 2020 & 2033
- Table 23: Global Tracheotomy Tube Revenue million Forecast, by Country 2020 & 2033
- Table 24: Global Tracheotomy Tube Volume K Forecast, by Country 2020 & 2033
- Table 25: Brazil Tracheotomy Tube Revenue (million) Forecast, by Application 2020 & 2033
- Table 26: Brazil Tracheotomy Tube Volume (K) Forecast, by Application 2020 & 2033
- Table 27: Argentina Tracheotomy Tube Revenue (million) Forecast, by Application 2020 & 2033
- Table 28: Argentina Tracheotomy Tube Volume (K) Forecast, by Application 2020 & 2033
- Table 29: Rest of South America Tracheotomy Tube Revenue (million) Forecast, by Application 2020 & 2033
- Table 30: Rest of South America Tracheotomy Tube Volume (K) Forecast, by Application 2020 & 2033
- Table 31: Global Tracheotomy Tube Revenue million Forecast, by Application 2020 & 2033
- Table 32: Global Tracheotomy Tube Volume K Forecast, by Application 2020 & 2033
- Table 33: Global Tracheotomy Tube Revenue million Forecast, by Types 2020 & 2033
- Table 34: Global Tracheotomy Tube Volume K Forecast, by Types 2020 & 2033
- Table 35: Global Tracheotomy Tube Revenue million Forecast, by Country 2020 & 2033
- Table 36: Global Tracheotomy Tube Volume K Forecast, by Country 2020 & 2033
- Table 37: United Kingdom Tracheotomy Tube Revenue (million) Forecast, by Application 2020 & 2033
- Table 38: United Kingdom Tracheotomy Tube Volume (K) Forecast, by Application 2020 & 2033
- Table 39: Germany Tracheotomy Tube Revenue (million) Forecast, by Application 2020 & 2033
- Table 40: Germany Tracheotomy Tube Volume (K) Forecast, by Application 2020 & 2033
- Table 41: France Tracheotomy Tube Revenue (million) Forecast, by Application 2020 & 2033
- Table 42: France Tracheotomy Tube Volume (K) Forecast, by Application 2020 & 2033
- Table 43: Italy Tracheotomy Tube Revenue (million) Forecast, by Application 2020 & 2033
- Table 44: Italy Tracheotomy Tube Volume (K) Forecast, by Application 2020 & 2033
- Table 45: Spain Tracheotomy Tube Revenue (million) Forecast, by Application 2020 & 2033
- Table 46: Spain Tracheotomy Tube Volume (K) Forecast, by Application 2020 & 2033
- Table 47: Russia Tracheotomy Tube Revenue (million) Forecast, by Application 2020 & 2033
- Table 48: Russia Tracheotomy Tube Volume (K) Forecast, by Application 2020 & 2033
- Table 49: Benelux Tracheotomy Tube Revenue (million) Forecast, by Application 2020 & 2033
- Table 50: Benelux Tracheotomy Tube Volume (K) Forecast, by Application 2020 & 2033
- Table 51: Nordics Tracheotomy Tube Revenue (million) Forecast, by Application 2020 & 2033
- Table 52: Nordics Tracheotomy Tube Volume (K) Forecast, by Application 2020 & 2033
- Table 53: Rest of Europe Tracheotomy Tube Revenue (million) Forecast, by Application 2020 & 2033
- Table 54: Rest of Europe Tracheotomy Tube Volume (K) Forecast, by Application 2020 & 2033
- Table 55: Global Tracheotomy Tube Revenue million Forecast, by Application 2020 & 2033
- Table 56: Global Tracheotomy Tube Volume K Forecast, by Application 2020 & 2033
- Table 57: Global Tracheotomy Tube Revenue million Forecast, by Types 2020 & 2033
- Table 58: Global Tracheotomy Tube Volume K Forecast, by Types 2020 & 2033
- Table 59: Global Tracheotomy Tube Revenue million Forecast, by Country 2020 & 2033
- Table 60: Global Tracheotomy Tube Volume K Forecast, by Country 2020 & 2033
- Table 61: Turkey Tracheotomy Tube Revenue (million) Forecast, by Application 2020 & 2033
- Table 62: Turkey Tracheotomy Tube Volume (K) Forecast, by Application 2020 & 2033
- Table 63: Israel Tracheotomy Tube Revenue (million) Forecast, by Application 2020 & 2033
- Table 64: Israel Tracheotomy Tube Volume (K) Forecast, by Application 2020 & 2033
- Table 65: GCC Tracheotomy Tube Revenue (million) Forecast, by Application 2020 & 2033
- Table 66: GCC Tracheotomy Tube Volume (K) Forecast, by Application 2020 & 2033
- Table 67: North Africa Tracheotomy Tube Revenue (million) Forecast, by Application 2020 & 2033
- Table 68: North Africa Tracheotomy Tube Volume (K) Forecast, by Application 2020 & 2033
- Table 69: South Africa Tracheotomy Tube Revenue (million) Forecast, by Application 2020 & 2033
- Table 70: South Africa Tracheotomy Tube Volume (K) Forecast, by Application 2020 & 2033
- Table 71: Rest of Middle East & Africa Tracheotomy Tube Revenue (million) Forecast, by Application 2020 & 2033
- Table 72: Rest of Middle East & Africa Tracheotomy Tube Volume (K) Forecast, by Application 2020 & 2033
- Table 73: Global Tracheotomy Tube Revenue million Forecast, by Application 2020 & 2033
- Table 74: Global Tracheotomy Tube Volume K Forecast, by Application 2020 & 2033
- Table 75: Global Tracheotomy Tube Revenue million Forecast, by Types 2020 & 2033
- Table 76: Global Tracheotomy Tube Volume K Forecast, by Types 2020 & 2033
- Table 77: Global Tracheotomy Tube Revenue million Forecast, by Country 2020 & 2033
- Table 78: Global Tracheotomy Tube Volume K Forecast, by Country 2020 & 2033
- Table 79: China Tracheotomy Tube Revenue (million) Forecast, by Application 2020 & 2033
- Table 80: China Tracheotomy Tube Volume (K) Forecast, by Application 2020 & 2033
- Table 81: India Tracheotomy Tube Revenue (million) Forecast, by Application 2020 & 2033
- Table 82: India Tracheotomy Tube Volume (K) Forecast, by Application 2020 & 2033
- Table 83: Japan Tracheotomy Tube Revenue (million) Forecast, by Application 2020 & 2033
- Table 84: Japan Tracheotomy Tube Volume (K) Forecast, by Application 2020 & 2033
- Table 85: South Korea Tracheotomy Tube Revenue (million) Forecast, by Application 2020 & 2033
- Table 86: South Korea Tracheotomy Tube Volume (K) Forecast, by Application 2020 & 2033
- Table 87: ASEAN Tracheotomy Tube Revenue (million) Forecast, by Application 2020 & 2033
- Table 88: ASEAN Tracheotomy Tube Volume (K) Forecast, by Application 2020 & 2033
- Table 89: Oceania Tracheotomy Tube Revenue (million) Forecast, by Application 2020 & 2033
- Table 90: Oceania Tracheotomy Tube Volume (K) Forecast, by Application 2020 & 2033
- Table 91: Rest of Asia Pacific Tracheotomy Tube Revenue (million) Forecast, by Application 2020 & 2033
- Table 92: Rest of Asia Pacific Tracheotomy Tube Volume (K) Forecast, by Application 2020 & 2033
Frequently Asked Questions
1. What is the projected Compound Annual Growth Rate (CAGR) of the Tracheotomy Tube?
The projected CAGR is approximately 3.8%.
2. Which companies are prominent players in the Tracheotomy Tube?
Key companies in the market include Medtronic, Teleflex Medical, Smith's Medical, TRACOE Medical, ConvaTec, Fuji Systems, Sewoon Medical, Boston Medical, Well Lead, TuoRen, Pulmodyne.
3. What are the main segments of the Tracheotomy Tube?
The market segments include Application, Types.
4. Can you provide details about the market size?
The market size is estimated to be USD 194 million as of 2022.
5. What are some drivers contributing to market growth?
N/A
6. What are the notable trends driving market growth?
N/A
7. Are there any restraints impacting market growth?
N/A
8. Can you provide examples of recent developments in the market?
N/A
9. What pricing options are available for accessing the report?
Pricing options include single-user, multi-user, and enterprise licenses priced at USD 3950.00, USD 5925.00, and USD 7900.00 respectively.
10. Is the market size provided in terms of value or volume?
The market size is provided in terms of value, measured in million and volume, measured in K.
11. Are there any specific market keywords associated with the report?
Yes, the market keyword associated with the report is "Tracheotomy Tube," which aids in identifying and referencing the specific market segment covered.
12. How do I determine which pricing option suits my needs best?
The pricing options vary based on user requirements and access needs. Individual users may opt for single-user licenses, while businesses requiring broader access may choose multi-user or enterprise licenses for cost-effective access to the report.
13. Are there any additional resources or data provided in the Tracheotomy Tube report?
While the report offers comprehensive insights, it's advisable to review the specific contents or supplementary materials provided to ascertain if additional resources or data are available.
14. How can I stay updated on further developments or reports in the Tracheotomy Tube?
To stay informed about further developments, trends, and reports in the Tracheotomy Tube, consider subscribing to industry newsletters, following relevant companies and organizations, or regularly checking reputable industry news sources and publications.
Methodology
Step 1 - Identification of Relevant Samples Size from Population Database


Step 2 - Approaches for Defining Global Market Size (Value, Volume* & Price*)

Note*: In applicable scenarios
Step 3 - Data Sources
Primary Research
- Web Analytics
- Survey Reports
- Research Institute
- Latest Research Reports
- Opinion Leaders
Secondary Research
- Annual Reports
- White Paper
- Latest Press Release
- Industry Association
- Paid Database
- Investor Presentations

Step 4 - Data Triangulation
Involves using different sources of information in order to increase the validity of a study
These sources are likely to be stakeholders in a program - participants, other researchers, program staff, other community members, and so on.
Then we put all data in single framework & apply various statistical tools to find out the dynamic on the market.
During the analysis stage, feedback from the stakeholder groups would be compared to determine areas of agreement as well as areas of divergence