

Key Insights
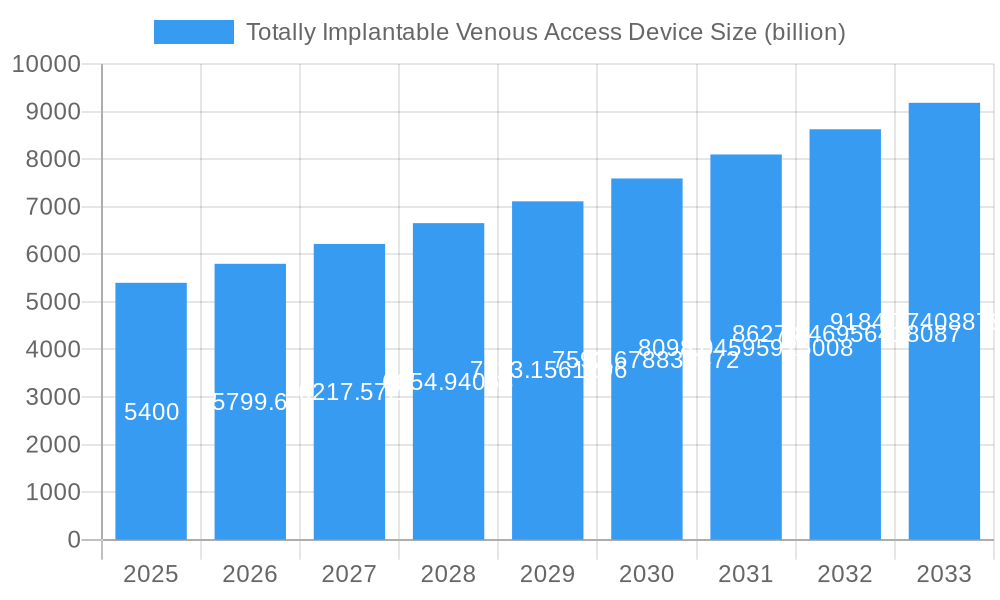
The global Totally Implantable Venous Access Device market is poised for robust expansion, projected to reach an estimated $5.4 billion in 2025, driven by a significant Compound Annual Growth Rate (CAGR) of 7.4% through 2033. This impressive growth is underpinned by the escalating prevalence of chronic diseases requiring long-term therapies, such as cancer and other critical conditions demanding consistent intravenous administrations. The increasing adoption of minimally invasive procedures and advancements in device technology, leading to improved patient comfort and reduced complication rates, are also key catalysts. Furthermore, the growing demand for home healthcare services and the resultant need for reliable, long-dwelling venous access solutions are further propelling market expansion.
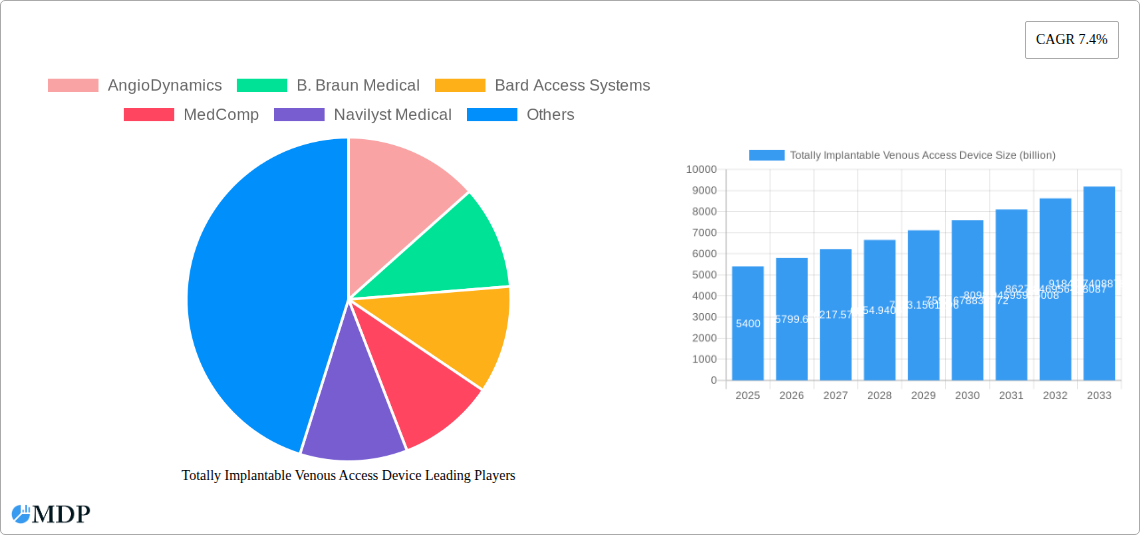
Totally Implantable Venous Access Device Market Size (In Billion)
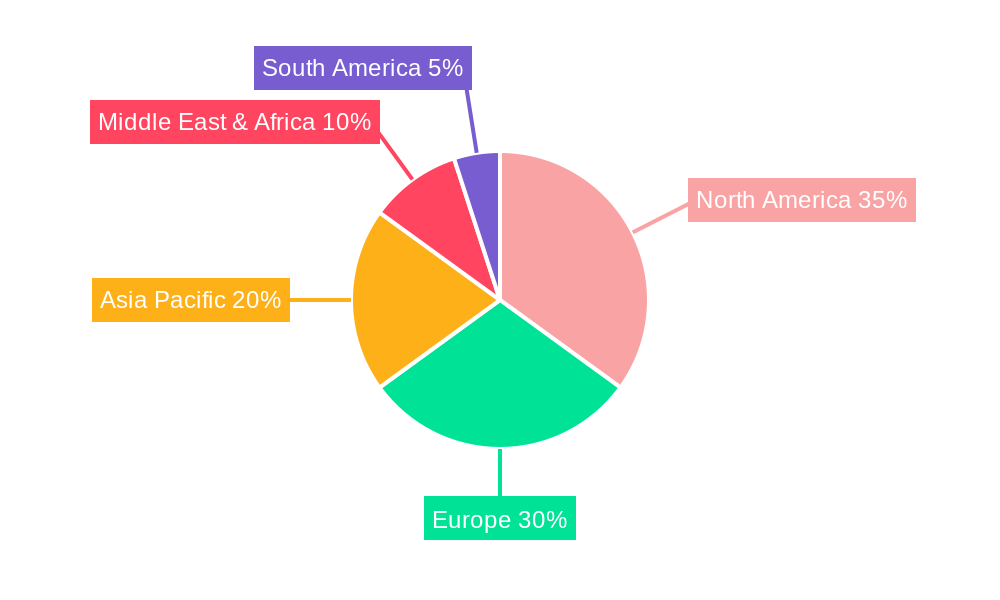
The market's dynamism is further illustrated by the diverse range of applications and product types. Intravenous chemotherapy and nutritional support treatments represent the primary application segments, reflecting the critical role these devices play in patient care. Within product types, both Titanium and Plastic Infusion Ports are integral to meeting varied clinical and patient needs. Geographically, North America and Europe currently lead the market, supported by advanced healthcare infrastructures and high patient awareness. However, the Asia Pacific region is emerging as a high-growth area, fueled by increasing healthcare expenditure, rising chronic disease burdens, and expanding access to advanced medical technologies. The market is characterized by intense competition among key players, fostering continuous innovation and product development to cater to evolving clinical demands and enhance patient outcomes.
Totally Implantable Venous Access Device Company Market Share
Totally Implantable Venous Access Device Market: Comprehensive Analysis and Forecast (2019–2033)
This in-depth report provides a detailed analysis of the global Totally Implantable Venous Access Device market, offering critical insights for industry stakeholders. Covering the historical period from 2019 to 2024 and projecting growth through 2033, with a base year of 2025, this research encompasses market dynamics, segmentation, competitive landscape, and future trends. The study identifies key growth drivers, challenges, and emerging opportunities, providing actionable intelligence for strategic decision-making. The estimated market value is expected to reach several billion dollars by the forecast period.
Totally Implantable Venous Access Device Market Dynamics & Concentration
The Totally Implantable Venous Access Device (TIVAD) market exhibits a moderate to high concentration, with a few key players dominating the landscape. Innovation is primarily driven by advancements in materials science, miniaturization, and improved safety features to minimize complications. Regulatory frameworks, overseen by bodies such as the FDA and EMA, play a crucial role in market entry and product approval, ensuring patient safety and efficacy. Product substitutes, while limited, include external catheters and percutaneous devices, though TIVADs offer superior long-term benefits for chronic therapies. End-user trends are characterized by an increasing demand for minimally invasive procedures, enhanced patient comfort, and reduced risk of infection. Mergers and acquisitions (M&A) activities are sporadic but strategic, aimed at expanding product portfolios and market reach. For instance, there have been several M&A deals reported in the last five years, contributing to market consolidation.
- Market Share: Key players collectively hold over 80% of the market share.
- M&A Deal Counts: An average of 2-3 significant M&A deals are observed annually.
- Innovation Drivers: Improved biocompatibility, reduced infection rates, and enhanced imaging guidance.
- Regulatory Frameworks: Stringent approval processes emphasizing clinical trials and post-market surveillance.
- Product Substitutes: External catheters, PICC lines, and central venous catheters.
- End-User Trends: Growing preference for long-term implanted devices for chronic venous access needs.
Totally Implantable Venous Access Device Industry Trends & Analysis
The Totally Implantable Venous Access Device (TIVAD) industry is poised for substantial growth, driven by an aging global population, the rising incidence of chronic diseases requiring long-term venous access, and advancements in medical technology. The market is projected to experience a Compound Annual Growth Rate (CAGR) of approximately 6.5% during the forecast period (2025–2033). This expansion is fueled by increasing awareness of the benefits of TIVADs, such as reduced infection rates and improved patient quality of life compared to external devices. Technological disruptions are continuously reshaping the market, with innovations focusing on antimicrobial coatings, smaller and more ergonomic designs, and integrated imaging capabilities for easier placement.
Consumer preferences are increasingly shifting towards less invasive and more comfortable treatment options, making TIVADs a preferred choice for patients undergoing prolonged therapies like chemotherapy, parenteral nutrition, and frequent blood transfusions. The competitive dynamics are characterized by a blend of established medical device manufacturers and emerging players, all vying for market share through product differentiation, strategic partnerships, and geographic expansion. Market penetration for TIVADs is steadily increasing, particularly in developed economies, as healthcare providers become more familiar with their benefits and physicians receive specialized training for their implantation. The global market size is expected to reach hundreds of billions of dollars by 2033, a significant increase from its valuation in the historical period.
- Market Growth Drivers: Increasing prevalence of cancer, inflammatory bowel diseases, and other chronic conditions requiring long-term venous access; an aging population; advancements in minimally invasive surgical techniques; and favorable reimbursement policies.
- Technological Disruptions: Development of antimicrobial-impregnated devices, MRI-compatible materials, and implantable ports with integrated sensing capabilities.
- Consumer Preferences: Growing demand for devices that offer comfort, reduce the risk of complications, and allow for greater patient autonomy.
- Competitive Dynamics: Intense competition among global manufacturers, with a focus on product innovation, clinical efficacy, and cost-effectiveness.
- Market Penetration: Steadily rising, especially in oncology and for patients requiring long-term intravenous therapies, with projections indicating a significant increase in adoption rates across various patient populations. The market penetration is anticipated to reach xx% by the end of the forecast period.
Leading Markets & Segments in Totally Implantable Venous Access Device
The Totally Implantable Venous Access Device (TIVAD) market is characterized by significant regional variations and segment dominance, primarily driven by healthcare infrastructure, disease prevalence, and patient demographics. North America, particularly the United States, currently holds the leading market position due to high healthcare expenditure, advanced medical infrastructure, and a substantial patient population requiring long-term venous access for conditions like cancer and chronic illnesses.
Within applications, Intravenous Chemotherapy stands out as the dominant segment. This is primarily due to the escalating global cancer rates and the critical need for reliable and safe venous access for administering chemotherapy drugs, which often require frequent and prolonged infusions. The efficacy and reduced risk of infection associated with TIVADs make them the preferred choice for oncologists and patients undergoing cancer treatment.
The Nutritional Support Treatment segment also contributes significantly to market growth, driven by an increase in patients suffering from malabsorption syndromes, gastrointestinal disorders, and critical illnesses requiring long-term parenteral nutrition. The ability of TIVADs to provide secure and consistent access for nutrient delivery is crucial for patient recovery and management.
In terms of product types, Titanium Infusion Ports represent a significant and growing segment. Titanium offers excellent biocompatibility, MRI compatibility, and durability, making it a preferred material for long-term implants. While Plastic Infusion Ports are also widely used due to their cost-effectiveness and lighter weight, titanium ports are increasingly favored for their superior performance and patient comfort in demanding therapeutic regimens.
- Dominant Region: North America, driven by high cancer incidence and advanced healthcare systems.
- Dominant Country: United States, accounting for a substantial share of global TIVAD usage.
- Dominant Application:
- Intravenous Chemotherapy: Primary driver due to rising cancer rates and the need for safe, long-term drug delivery.
- Key Drivers: Increased cancer diagnosis, advancements in chemotherapy regimens, and patient preference for less invasive treatment options.
- Intravenous Chemotherapy: Primary driver due to rising cancer rates and the need for safe, long-term drug delivery.
- Secondary Application:
- Nutritional Support Treatment: Growing demand for long-term parenteral nutrition in chronic disease management.
- Key Drivers: Rise in gastrointestinal disorders, critical care needs, and improvements in nutritional therapy protocols.
- Nutritional Support Treatment: Growing demand for long-term parenteral nutrition in chronic disease management.
- Dominant Product Type:
- Titanium Infusion Port: Valued for its biocompatibility, durability, and MRI compatibility, preferred for long-term and complex therapies.
- Key Drivers: Enhanced patient safety, reduced complications, and suitability for extended treatment durations.
- Titanium Infusion Port: Valued for its biocompatibility, durability, and MRI compatibility, preferred for long-term and complex therapies.
- Secondary Product Type:
- Plastic Infusion Port: Offers cost-effectiveness and lightweight design, catering to a broader patient base.
- Key Drivers: Affordability, ease of use, and suitability for shorter-term or less complex venous access needs.
- Plastic Infusion Port: Offers cost-effectiveness and lightweight design, catering to a broader patient base.
Totally Implantable Venous Access Device Product Developments
Recent product developments in the Totally Implantable Venous Access Device (TIVAD) market focus on enhancing patient safety, minimizing complications, and improving user experience. Innovations include the integration of antimicrobial coatings to combat infection risks, the development of smaller and more ergonomically designed ports for increased patient comfort, and advancements in materials that offer improved MRI compatibility. These developments are driven by the need to provide reliable, long-term venous access solutions for patients undergoing chronic therapies such as chemotherapy and parenteral nutrition, ultimately improving clinical outcomes and patient quality of life. The competitive advantage of new products lies in their ability to address unmet clinical needs and offer superior performance compared to existing devices.
Key Drivers of Totally Implantable Venous Access Device Growth
The growth of the Totally Implantable Venous Access Device (TIVAD) market is propelled by several key factors. Technologically, continuous advancements in biomaterials and device design are leading to safer, more durable, and user-friendly TIVADs, reducing complications like infection and thrombosis. Economically, the increasing prevalence of chronic diseases, particularly cancer, necessitates long-term venous access solutions, driving demand. Furthermore, favorable reimbursement policies in many regions support the adoption of TIVADs for appropriate patient populations. Regulatory bodies are also streamlining approval processes for innovative TIVADs, indirectly encouraging market expansion.
Challenges in the Totally Implantable Venous Access Device Market
Despite robust growth prospects, the Totally Implantable Venous Access Device (TIVAD) market faces several challenges. Regulatory hurdles and the stringent approval processes for new devices can be time-consuming and costly, impacting market entry for smaller manufacturers. Supply chain disruptions, as seen globally, can affect the availability and pricing of critical components, leading to potential shortages. Competitive pressures from both established players and new entrants necessitate continuous innovation and cost-effectiveness, which can strain resources. Furthermore, the need for specialized training for physicians in TIVAD implantation and management adds to the overall cost and complexity of adoption.
Emerging Opportunities in Totally Implantable Venous Access Device
Emerging opportunities in the Totally Implantable Venous Access Device (TIVAD) market lie in technological breakthroughs and strategic market expansion. The development of smart TIVADs with integrated sensors for monitoring venous pressure and flow could revolutionize patient care and early detection of complications. Expansion into emerging economies with growing healthcare infrastructure and increasing demand for advanced medical devices presents significant growth potential. Strategic partnerships between TIVAD manufacturers and pharmaceutical companies developing novel long-term therapies can also create synergistic growth opportunities. Furthermore, exploring applications beyond traditional chemotherapy and nutritional support, such as for rare disease treatments, could open new market segments.
Leading Players in the Totally Implantable Venous Access Device Sector
- AngioDynamics
- B. Braun Medical
- Bard Access Systems
- MedComp
- Navilyst Medical
- Norfolk Medical Products
- Smiths Medical
- Teleflex
- Vygon
- PFM Medical
- Districlass
- Fresenius
Key Milestones in Totally Implantable Venous Access Device Industry
- 2019: Launch of advanced antimicrobial-coated TIVADs, significantly reducing infection rates.
- 2020: Increased adoption of TIVADs for home-based chemotherapy administration due to global health concerns.
- 2021: Introduction of next-generation MRI-compatible TIVADs, enhancing diagnostic imaging capabilities for patients.
- 2022: FDA approval for a novel TIVAD with improved ergonomic design and ease of access for patients.
- 2023: Significant increase in M&A activities as larger players seek to consolidate market share and expand product portfolios.
- 2024: Growing emphasis on patient education and physician training programs to optimize TIVAD implantation and usage.
Strategic Outlook for Totally Implantable Venous Access Device Market
The strategic outlook for the Totally Implantable Venous Access Device (TIVAD) market is highly positive, with continued growth driven by ongoing innovation and expanding applications. Key accelerators include the development of "smart" devices with advanced monitoring capabilities, the increasing demand for minimally invasive long-term venous access solutions, and the expansion of healthcare access in emerging markets. Strategic opportunities lie in forging partnerships to integrate TIVADs with advanced drug delivery systems and leveraging digital health platforms for remote patient monitoring and data analytics. The focus on improving patient outcomes and quality of life will remain a central theme, driving demand for high-quality, reliable TIVAD solutions.
Totally Implantable Venous Access Device Segmentation
-
1. Application
- 1.1. Intravenous Chemotherapy
- 1.2. Nutritional Support Treatment
-
2. Types
- 2.1. Titanium Infusion Port
- 2.2. Plastic Infusion Port
Totally Implantable Venous Access Device Segmentation By Geography
-
1. North America
- 1.1. United States
- 1.2. Canada
- 1.3. Mexico
-
2. South America
- 2.1. Brazil
- 2.2. Argentina
- 2.3. Rest of South America
-
3. Europe
- 3.1. United Kingdom
- 3.2. Germany
- 3.3. France
- 3.4. Italy
- 3.5. Spain
- 3.6. Russia
- 3.7. Benelux
- 3.8. Nordics
- 3.9. Rest of Europe
-
4. Middle East & Africa
- 4.1. Turkey
- 4.2. Israel
- 4.3. GCC
- 4.4. North Africa
- 4.5. South Africa
- 4.6. Rest of Middle East & Africa
-
5. Asia Pacific
- 5.1. China
- 5.2. India
- 5.3. Japan
- 5.4. South Korea
- 5.5. ASEAN
- 5.6. Oceania
- 5.7. Rest of Asia Pacific
Totally Implantable Venous Access Device Regional Market Share
Geographic Coverage of Totally Implantable Venous Access Device
Totally Implantable Venous Access Device REPORT HIGHLIGHTS
| Aspects | Details |
|---|---|
| Study Period | 2020-2034 |
| Base Year | 2025 |
| Estimated Year | 2026 |
| Forecast Period | 2026-2034 |
| Historical Period | 2020-2025 |
| Growth Rate | CAGR of 7.4% from 2020-2034 |
| Segmentation |
|
Table of Contents
- 1. Introduction
- 1.1. Research Scope
- 1.2. Market Segmentation
- 1.3. Research Objective
- 1.4. Definitions and Assumptions
- 2. Executive Summary
- 2.1. Market Snapshot
- 3. Market Dynamics
- 3.1. Market Drivers
- 3.2. Market Restrains
- 3.3. Market Trends
- 3.4. Market Opportunities
- 4. Market Factor Analysis
- 4.1. Porters Five Forces
- 4.1.1. Bargaining Power of Suppliers
- 4.1.2. Bargaining Power of Buyers
- 4.1.3. Threat of New Entrants
- 4.1.4. Threat of Substitutes
- 4.1.5. Competitive Rivalry
- 4.2. PESTEL analysis
- 4.3. BCG Analysis
- 4.3.1. Stars (High Growth, High Market Share)
- 4.3.2. Cash Cows (Low Growth, High Market Share)
- 4.3.3. Question Mark (High Growth, Low Market Share)
- 4.3.4. Dogs (Low Growth, Low Market Share)
- 4.4. Ansoff Matrix Analysis
- 4.5. Supply Chain Analysis
- 4.6. Regulatory Landscape
- 4.7. Current Market Potential and Opportunity Assessment (TAM–SAM–SOM Framework)
- 4.8. MDP Analyst Note
- 4.1. Porters Five Forces
- 5. Market Analysis, Insights and Forecast 2021-2033
- 5.1. Market Analysis, Insights and Forecast - by Application
- 5.1.1. Intravenous Chemotherapy
- 5.1.2. Nutritional Support Treatment
- 5.2. Market Analysis, Insights and Forecast - by Types
- 5.2.1. Titanium Infusion Port
- 5.2.2. Plastic Infusion Port
- 5.3. Market Analysis, Insights and Forecast - by Region
- 5.3.1. North America
- 5.3.2. South America
- 5.3.3. Europe
- 5.3.4. Middle East & Africa
- 5.3.5. Asia Pacific
- 5.1. Market Analysis, Insights and Forecast - by Application
- 6. Global Totally Implantable Venous Access Device Analysis, Insights and Forecast, 2021-2033
- 6.1. Market Analysis, Insights and Forecast - by Application
- 6.1.1. Intravenous Chemotherapy
- 6.1.2. Nutritional Support Treatment
- 6.2. Market Analysis, Insights and Forecast - by Types
- 6.2.1. Titanium Infusion Port
- 6.2.2. Plastic Infusion Port
- 6.1. Market Analysis, Insights and Forecast - by Application
- 7. North America Totally Implantable Venous Access Device Analysis, Insights and Forecast, 2020-2032
- 7.1. Market Analysis, Insights and Forecast - by Application
- 7.1.1. Intravenous Chemotherapy
- 7.1.2. Nutritional Support Treatment
- 7.2. Market Analysis, Insights and Forecast - by Types
- 7.2.1. Titanium Infusion Port
- 7.2.2. Plastic Infusion Port
- 7.1. Market Analysis, Insights and Forecast - by Application
- 8. South America Totally Implantable Venous Access Device Analysis, Insights and Forecast, 2020-2032
- 8.1. Market Analysis, Insights and Forecast - by Application
- 8.1.1. Intravenous Chemotherapy
- 8.1.2. Nutritional Support Treatment
- 8.2. Market Analysis, Insights and Forecast - by Types
- 8.2.1. Titanium Infusion Port
- 8.2.2. Plastic Infusion Port
- 8.1. Market Analysis, Insights and Forecast - by Application
- 9. Europe Totally Implantable Venous Access Device Analysis, Insights and Forecast, 2020-2032
- 9.1. Market Analysis, Insights and Forecast - by Application
- 9.1.1. Intravenous Chemotherapy
- 9.1.2. Nutritional Support Treatment
- 9.2. Market Analysis, Insights and Forecast - by Types
- 9.2.1. Titanium Infusion Port
- 9.2.2. Plastic Infusion Port
- 9.1. Market Analysis, Insights and Forecast - by Application
- 10. Middle East & Africa Totally Implantable Venous Access Device Analysis, Insights and Forecast, 2020-2032
- 10.1. Market Analysis, Insights and Forecast - by Application
- 10.1.1. Intravenous Chemotherapy
- 10.1.2. Nutritional Support Treatment
- 10.2. Market Analysis, Insights and Forecast - by Types
- 10.2.1. Titanium Infusion Port
- 10.2.2. Plastic Infusion Port
- 10.1. Market Analysis, Insights and Forecast - by Application
- 11. Asia Pacific Totally Implantable Venous Access Device Analysis, Insights and Forecast, 2020-2032
- 11.1. Market Analysis, Insights and Forecast - by Application
- 11.1.1. Intravenous Chemotherapy
- 11.1.2. Nutritional Support Treatment
- 11.2. Market Analysis, Insights and Forecast - by Types
- 11.2.1. Titanium Infusion Port
- 11.2.2. Plastic Infusion Port
- 11.1. Market Analysis, Insights and Forecast - by Application
- 12. Competitive Analysis
- 12.1. Company Profiles
- 12.1.1 AngioDynamics
- 12.1.1.1. Company Overview
- 12.1.1.2. Products
- 12.1.1.3. Company Financials
- 12.1.1.4. SWOT Analysis
- 12.1.2 B. Braun Medical
- 12.1.2.1. Company Overview
- 12.1.2.2. Products
- 12.1.2.3. Company Financials
- 12.1.2.4. SWOT Analysis
- 12.1.3 Bard Access Systems
- 12.1.3.1. Company Overview
- 12.1.3.2. Products
- 12.1.3.3. Company Financials
- 12.1.3.4. SWOT Analysis
- 12.1.4 MedComp
- 12.1.4.1. Company Overview
- 12.1.4.2. Products
- 12.1.4.3. Company Financials
- 12.1.4.4. SWOT Analysis
- 12.1.5 Navilyst Medical
- 12.1.5.1. Company Overview
- 12.1.5.2. Products
- 12.1.5.3. Company Financials
- 12.1.5.4. SWOT Analysis
- 12.1.6 Norfolk Medical Products
- 12.1.6.1. Company Overview
- 12.1.6.2. Products
- 12.1.6.3. Company Financials
- 12.1.6.4. SWOT Analysis
- 12.1.7 Smiths Medical
- 12.1.7.1. Company Overview
- 12.1.7.2. Products
- 12.1.7.3. Company Financials
- 12.1.7.4. SWOT Analysis
- 12.1.8 Teleflex
- 12.1.8.1. Company Overview
- 12.1.8.2. Products
- 12.1.8.3. Company Financials
- 12.1.8.4. SWOT Analysis
- 12.1.9 Vygon
- 12.1.9.1. Company Overview
- 12.1.9.2. Products
- 12.1.9.3. Company Financials
- 12.1.9.4. SWOT Analysis
- 12.1.10 PFM Medical
- 12.1.10.1. Company Overview
- 12.1.10.2. Products
- 12.1.10.3. Company Financials
- 12.1.10.4. SWOT Analysis
- 12.1.11 Districlass
- 12.1.11.1. Company Overview
- 12.1.11.2. Products
- 12.1.11.3. Company Financials
- 12.1.11.4. SWOT Analysis
- 12.1.12 Fresenius
- 12.1.12.1. Company Overview
- 12.1.12.2. Products
- 12.1.12.3. Company Financials
- 12.1.12.4. SWOT Analysis
- 12.1.1 AngioDynamics
- 12.2. Market Entropy
- 12.2.1 Company's Key Areas Served
- 12.2.2 Recent Developments
- 12.3. Company Market Share Analysis 2025
- 12.3.1 Top 5 Companies Market Share Analysis
- 12.3.2 Top 3 Companies Market Share Analysis
- 12.4. List of Potential Customers
- 13. Research Methodology
List of Figures
- Figure 1: Global Totally Implantable Venous Access Device Revenue Breakdown (billion, %) by Region 2025 & 2033
- Figure 2: Global Totally Implantable Venous Access Device Volume Breakdown (K, %) by Region 2025 & 2033
- Figure 3: North America Totally Implantable Venous Access Device Revenue (billion), by Application 2025 & 2033
- Figure 4: North America Totally Implantable Venous Access Device Volume (K), by Application 2025 & 2033
- Figure 5: North America Totally Implantable Venous Access Device Revenue Share (%), by Application 2025 & 2033
- Figure 6: North America Totally Implantable Venous Access Device Volume Share (%), by Application 2025 & 2033
- Figure 7: North America Totally Implantable Venous Access Device Revenue (billion), by Types 2025 & 2033
- Figure 8: North America Totally Implantable Venous Access Device Volume (K), by Types 2025 & 2033
- Figure 9: North America Totally Implantable Venous Access Device Revenue Share (%), by Types 2025 & 2033
- Figure 10: North America Totally Implantable Venous Access Device Volume Share (%), by Types 2025 & 2033
- Figure 11: North America Totally Implantable Venous Access Device Revenue (billion), by Country 2025 & 2033
- Figure 12: North America Totally Implantable Venous Access Device Volume (K), by Country 2025 & 2033
- Figure 13: North America Totally Implantable Venous Access Device Revenue Share (%), by Country 2025 & 2033
- Figure 14: North America Totally Implantable Venous Access Device Volume Share (%), by Country 2025 & 2033
- Figure 15: South America Totally Implantable Venous Access Device Revenue (billion), by Application 2025 & 2033
- Figure 16: South America Totally Implantable Venous Access Device Volume (K), by Application 2025 & 2033
- Figure 17: South America Totally Implantable Venous Access Device Revenue Share (%), by Application 2025 & 2033
- Figure 18: South America Totally Implantable Venous Access Device Volume Share (%), by Application 2025 & 2033
- Figure 19: South America Totally Implantable Venous Access Device Revenue (billion), by Types 2025 & 2033
- Figure 20: South America Totally Implantable Venous Access Device Volume (K), by Types 2025 & 2033
- Figure 21: South America Totally Implantable Venous Access Device Revenue Share (%), by Types 2025 & 2033
- Figure 22: South America Totally Implantable Venous Access Device Volume Share (%), by Types 2025 & 2033
- Figure 23: South America Totally Implantable Venous Access Device Revenue (billion), by Country 2025 & 2033
- Figure 24: South America Totally Implantable Venous Access Device Volume (K), by Country 2025 & 2033
- Figure 25: South America Totally Implantable Venous Access Device Revenue Share (%), by Country 2025 & 2033
- Figure 26: South America Totally Implantable Venous Access Device Volume Share (%), by Country 2025 & 2033
- Figure 27: Europe Totally Implantable Venous Access Device Revenue (billion), by Application 2025 & 2033
- Figure 28: Europe Totally Implantable Venous Access Device Volume (K), by Application 2025 & 2033
- Figure 29: Europe Totally Implantable Venous Access Device Revenue Share (%), by Application 2025 & 2033
- Figure 30: Europe Totally Implantable Venous Access Device Volume Share (%), by Application 2025 & 2033
- Figure 31: Europe Totally Implantable Venous Access Device Revenue (billion), by Types 2025 & 2033
- Figure 32: Europe Totally Implantable Venous Access Device Volume (K), by Types 2025 & 2033
- Figure 33: Europe Totally Implantable Venous Access Device Revenue Share (%), by Types 2025 & 2033
- Figure 34: Europe Totally Implantable Venous Access Device Volume Share (%), by Types 2025 & 2033
- Figure 35: Europe Totally Implantable Venous Access Device Revenue (billion), by Country 2025 & 2033
- Figure 36: Europe Totally Implantable Venous Access Device Volume (K), by Country 2025 & 2033
- Figure 37: Europe Totally Implantable Venous Access Device Revenue Share (%), by Country 2025 & 2033
- Figure 38: Europe Totally Implantable Venous Access Device Volume Share (%), by Country 2025 & 2033
- Figure 39: Middle East & Africa Totally Implantable Venous Access Device Revenue (billion), by Application 2025 & 2033
- Figure 40: Middle East & Africa Totally Implantable Venous Access Device Volume (K), by Application 2025 & 2033
- Figure 41: Middle East & Africa Totally Implantable Venous Access Device Revenue Share (%), by Application 2025 & 2033
- Figure 42: Middle East & Africa Totally Implantable Venous Access Device Volume Share (%), by Application 2025 & 2033
- Figure 43: Middle East & Africa Totally Implantable Venous Access Device Revenue (billion), by Types 2025 & 2033
- Figure 44: Middle East & Africa Totally Implantable Venous Access Device Volume (K), by Types 2025 & 2033
- Figure 45: Middle East & Africa Totally Implantable Venous Access Device Revenue Share (%), by Types 2025 & 2033
- Figure 46: Middle East & Africa Totally Implantable Venous Access Device Volume Share (%), by Types 2025 & 2033
- Figure 47: Middle East & Africa Totally Implantable Venous Access Device Revenue (billion), by Country 2025 & 2033
- Figure 48: Middle East & Africa Totally Implantable Venous Access Device Volume (K), by Country 2025 & 2033
- Figure 49: Middle East & Africa Totally Implantable Venous Access Device Revenue Share (%), by Country 2025 & 2033
- Figure 50: Middle East & Africa Totally Implantable Venous Access Device Volume Share (%), by Country 2025 & 2033
- Figure 51: Asia Pacific Totally Implantable Venous Access Device Revenue (billion), by Application 2025 & 2033
- Figure 52: Asia Pacific Totally Implantable Venous Access Device Volume (K), by Application 2025 & 2033
- Figure 53: Asia Pacific Totally Implantable Venous Access Device Revenue Share (%), by Application 2025 & 2033
- Figure 54: Asia Pacific Totally Implantable Venous Access Device Volume Share (%), by Application 2025 & 2033
- Figure 55: Asia Pacific Totally Implantable Venous Access Device Revenue (billion), by Types 2025 & 2033
- Figure 56: Asia Pacific Totally Implantable Venous Access Device Volume (K), by Types 2025 & 2033
- Figure 57: Asia Pacific Totally Implantable Venous Access Device Revenue Share (%), by Types 2025 & 2033
- Figure 58: Asia Pacific Totally Implantable Venous Access Device Volume Share (%), by Types 2025 & 2033
- Figure 59: Asia Pacific Totally Implantable Venous Access Device Revenue (billion), by Country 2025 & 2033
- Figure 60: Asia Pacific Totally Implantable Venous Access Device Volume (K), by Country 2025 & 2033
- Figure 61: Asia Pacific Totally Implantable Venous Access Device Revenue Share (%), by Country 2025 & 2033
- Figure 62: Asia Pacific Totally Implantable Venous Access Device Volume Share (%), by Country 2025 & 2033
List of Tables
- Table 1: Global Totally Implantable Venous Access Device Revenue billion Forecast, by Application 2020 & 2033
- Table 2: Global Totally Implantable Venous Access Device Volume K Forecast, by Application 2020 & 2033
- Table 3: Global Totally Implantable Venous Access Device Revenue billion Forecast, by Types 2020 & 2033
- Table 4: Global Totally Implantable Venous Access Device Volume K Forecast, by Types 2020 & 2033
- Table 5: Global Totally Implantable Venous Access Device Revenue billion Forecast, by Region 2020 & 2033
- Table 6: Global Totally Implantable Venous Access Device Volume K Forecast, by Region 2020 & 2033
- Table 7: Global Totally Implantable Venous Access Device Revenue billion Forecast, by Application 2020 & 2033
- Table 8: Global Totally Implantable Venous Access Device Volume K Forecast, by Application 2020 & 2033
- Table 9: Global Totally Implantable Venous Access Device Revenue billion Forecast, by Types 2020 & 2033
- Table 10: Global Totally Implantable Venous Access Device Volume K Forecast, by Types 2020 & 2033
- Table 11: Global Totally Implantable Venous Access Device Revenue billion Forecast, by Country 2020 & 2033
- Table 12: Global Totally Implantable Venous Access Device Volume K Forecast, by Country 2020 & 2033
- Table 13: United States Totally Implantable Venous Access Device Revenue (billion) Forecast, by Application 2020 & 2033
- Table 14: United States Totally Implantable Venous Access Device Volume (K) Forecast, by Application 2020 & 2033
- Table 15: Canada Totally Implantable Venous Access Device Revenue (billion) Forecast, by Application 2020 & 2033
- Table 16: Canada Totally Implantable Venous Access Device Volume (K) Forecast, by Application 2020 & 2033
- Table 17: Mexico Totally Implantable Venous Access Device Revenue (billion) Forecast, by Application 2020 & 2033
- Table 18: Mexico Totally Implantable Venous Access Device Volume (K) Forecast, by Application 2020 & 2033
- Table 19: Global Totally Implantable Venous Access Device Revenue billion Forecast, by Application 2020 & 2033
- Table 20: Global Totally Implantable Venous Access Device Volume K Forecast, by Application 2020 & 2033
- Table 21: Global Totally Implantable Venous Access Device Revenue billion Forecast, by Types 2020 & 2033
- Table 22: Global Totally Implantable Venous Access Device Volume K Forecast, by Types 2020 & 2033
- Table 23: Global Totally Implantable Venous Access Device Revenue billion Forecast, by Country 2020 & 2033
- Table 24: Global Totally Implantable Venous Access Device Volume K Forecast, by Country 2020 & 2033
- Table 25: Brazil Totally Implantable Venous Access Device Revenue (billion) Forecast, by Application 2020 & 2033
- Table 26: Brazil Totally Implantable Venous Access Device Volume (K) Forecast, by Application 2020 & 2033
- Table 27: Argentina Totally Implantable Venous Access Device Revenue (billion) Forecast, by Application 2020 & 2033
- Table 28: Argentina Totally Implantable Venous Access Device Volume (K) Forecast, by Application 2020 & 2033
- Table 29: Rest of South America Totally Implantable Venous Access Device Revenue (billion) Forecast, by Application 2020 & 2033
- Table 30: Rest of South America Totally Implantable Venous Access Device Volume (K) Forecast, by Application 2020 & 2033
- Table 31: Global Totally Implantable Venous Access Device Revenue billion Forecast, by Application 2020 & 2033
- Table 32: Global Totally Implantable Venous Access Device Volume K Forecast, by Application 2020 & 2033
- Table 33: Global Totally Implantable Venous Access Device Revenue billion Forecast, by Types 2020 & 2033
- Table 34: Global Totally Implantable Venous Access Device Volume K Forecast, by Types 2020 & 2033
- Table 35: Global Totally Implantable Venous Access Device Revenue billion Forecast, by Country 2020 & 2033
- Table 36: Global Totally Implantable Venous Access Device Volume K Forecast, by Country 2020 & 2033
- Table 37: United Kingdom Totally Implantable Venous Access Device Revenue (billion) Forecast, by Application 2020 & 2033
- Table 38: United Kingdom Totally Implantable Venous Access Device Volume (K) Forecast, by Application 2020 & 2033
- Table 39: Germany Totally Implantable Venous Access Device Revenue (billion) Forecast, by Application 2020 & 2033
- Table 40: Germany Totally Implantable Venous Access Device Volume (K) Forecast, by Application 2020 & 2033
- Table 41: France Totally Implantable Venous Access Device Revenue (billion) Forecast, by Application 2020 & 2033
- Table 42: France Totally Implantable Venous Access Device Volume (K) Forecast, by Application 2020 & 2033
- Table 43: Italy Totally Implantable Venous Access Device Revenue (billion) Forecast, by Application 2020 & 2033
- Table 44: Italy Totally Implantable Venous Access Device Volume (K) Forecast, by Application 2020 & 2033
- Table 45: Spain Totally Implantable Venous Access Device Revenue (billion) Forecast, by Application 2020 & 2033
- Table 46: Spain Totally Implantable Venous Access Device Volume (K) Forecast, by Application 2020 & 2033
- Table 47: Russia Totally Implantable Venous Access Device Revenue (billion) Forecast, by Application 2020 & 2033
- Table 48: Russia Totally Implantable Venous Access Device Volume (K) Forecast, by Application 2020 & 2033
- Table 49: Benelux Totally Implantable Venous Access Device Revenue (billion) Forecast, by Application 2020 & 2033
- Table 50: Benelux Totally Implantable Venous Access Device Volume (K) Forecast, by Application 2020 & 2033
- Table 51: Nordics Totally Implantable Venous Access Device Revenue (billion) Forecast, by Application 2020 & 2033
- Table 52: Nordics Totally Implantable Venous Access Device Volume (K) Forecast, by Application 2020 & 2033
- Table 53: Rest of Europe Totally Implantable Venous Access Device Revenue (billion) Forecast, by Application 2020 & 2033
- Table 54: Rest of Europe Totally Implantable Venous Access Device Volume (K) Forecast, by Application 2020 & 2033
- Table 55: Global Totally Implantable Venous Access Device Revenue billion Forecast, by Application 2020 & 2033
- Table 56: Global Totally Implantable Venous Access Device Volume K Forecast, by Application 2020 & 2033
- Table 57: Global Totally Implantable Venous Access Device Revenue billion Forecast, by Types 2020 & 2033
- Table 58: Global Totally Implantable Venous Access Device Volume K Forecast, by Types 2020 & 2033
- Table 59: Global Totally Implantable Venous Access Device Revenue billion Forecast, by Country 2020 & 2033
- Table 60: Global Totally Implantable Venous Access Device Volume K Forecast, by Country 2020 & 2033
- Table 61: Turkey Totally Implantable Venous Access Device Revenue (billion) Forecast, by Application 2020 & 2033
- Table 62: Turkey Totally Implantable Venous Access Device Volume (K) Forecast, by Application 2020 & 2033
- Table 63: Israel Totally Implantable Venous Access Device Revenue (billion) Forecast, by Application 2020 & 2033
- Table 64: Israel Totally Implantable Venous Access Device Volume (K) Forecast, by Application 2020 & 2033
- Table 65: GCC Totally Implantable Venous Access Device Revenue (billion) Forecast, by Application 2020 & 2033
- Table 66: GCC Totally Implantable Venous Access Device Volume (K) Forecast, by Application 2020 & 2033
- Table 67: North Africa Totally Implantable Venous Access Device Revenue (billion) Forecast, by Application 2020 & 2033
- Table 68: North Africa Totally Implantable Venous Access Device Volume (K) Forecast, by Application 2020 & 2033
- Table 69: South Africa Totally Implantable Venous Access Device Revenue (billion) Forecast, by Application 2020 & 2033
- Table 70: South Africa Totally Implantable Venous Access Device Volume (K) Forecast, by Application 2020 & 2033
- Table 71: Rest of Middle East & Africa Totally Implantable Venous Access Device Revenue (billion) Forecast, by Application 2020 & 2033
- Table 72: Rest of Middle East & Africa Totally Implantable Venous Access Device Volume (K) Forecast, by Application 2020 & 2033
- Table 73: Global Totally Implantable Venous Access Device Revenue billion Forecast, by Application 2020 & 2033
- Table 74: Global Totally Implantable Venous Access Device Volume K Forecast, by Application 2020 & 2033
- Table 75: Global Totally Implantable Venous Access Device Revenue billion Forecast, by Types 2020 & 2033
- Table 76: Global Totally Implantable Venous Access Device Volume K Forecast, by Types 2020 & 2033
- Table 77: Global Totally Implantable Venous Access Device Revenue billion Forecast, by Country 2020 & 2033
- Table 78: Global Totally Implantable Venous Access Device Volume K Forecast, by Country 2020 & 2033
- Table 79: China Totally Implantable Venous Access Device Revenue (billion) Forecast, by Application 2020 & 2033
- Table 80: China Totally Implantable Venous Access Device Volume (K) Forecast, by Application 2020 & 2033
- Table 81: India Totally Implantable Venous Access Device Revenue (billion) Forecast, by Application 2020 & 2033
- Table 82: India Totally Implantable Venous Access Device Volume (K) Forecast, by Application 2020 & 2033
- Table 83: Japan Totally Implantable Venous Access Device Revenue (billion) Forecast, by Application 2020 & 2033
- Table 84: Japan Totally Implantable Venous Access Device Volume (K) Forecast, by Application 2020 & 2033
- Table 85: South Korea Totally Implantable Venous Access Device Revenue (billion) Forecast, by Application 2020 & 2033
- Table 86: South Korea Totally Implantable Venous Access Device Volume (K) Forecast, by Application 2020 & 2033
- Table 87: ASEAN Totally Implantable Venous Access Device Revenue (billion) Forecast, by Application 2020 & 2033
- Table 88: ASEAN Totally Implantable Venous Access Device Volume (K) Forecast, by Application 2020 & 2033
- Table 89: Oceania Totally Implantable Venous Access Device Revenue (billion) Forecast, by Application 2020 & 2033
- Table 90: Oceania Totally Implantable Venous Access Device Volume (K) Forecast, by Application 2020 & 2033
- Table 91: Rest of Asia Pacific Totally Implantable Venous Access Device Revenue (billion) Forecast, by Application 2020 & 2033
- Table 92: Rest of Asia Pacific Totally Implantable Venous Access Device Volume (K) Forecast, by Application 2020 & 2033
Frequently Asked Questions
1. What is the projected Compound Annual Growth Rate (CAGR) of the Totally Implantable Venous Access Device?
The projected CAGR is approximately 7.4%.
2. Which companies are prominent players in the Totally Implantable Venous Access Device?
Key companies in the market include AngioDynamics, B. Braun Medical, Bard Access Systems, MedComp, Navilyst Medical, Norfolk Medical Products, Smiths Medical, Teleflex, Vygon, PFM Medical, Districlass, Fresenius.
3. What are the main segments of the Totally Implantable Venous Access Device?
The market segments include Application, Types.
4. Can you provide details about the market size?
The market size is estimated to be USD 5.4 billion as of 2022.
5. What are some drivers contributing to market growth?
N/A
6. What are the notable trends driving market growth?
N/A
7. Are there any restraints impacting market growth?
N/A
8. Can you provide examples of recent developments in the market?
N/A
9. What pricing options are available for accessing the report?
Pricing options include single-user, multi-user, and enterprise licenses priced at USD 3950.00, USD 5925.00, and USD 7900.00 respectively.
10. Is the market size provided in terms of value or volume?
The market size is provided in terms of value, measured in billion and volume, measured in K.
11. Are there any specific market keywords associated with the report?
Yes, the market keyword associated with the report is "Totally Implantable Venous Access Device," which aids in identifying and referencing the specific market segment covered.
12. How do I determine which pricing option suits my needs best?
The pricing options vary based on user requirements and access needs. Individual users may opt for single-user licenses, while businesses requiring broader access may choose multi-user or enterprise licenses for cost-effective access to the report.
13. Are there any additional resources or data provided in the Totally Implantable Venous Access Device report?
While the report offers comprehensive insights, it's advisable to review the specific contents or supplementary materials provided to ascertain if additional resources or data are available.
14. How can I stay updated on further developments or reports in the Totally Implantable Venous Access Device?
To stay informed about further developments, trends, and reports in the Totally Implantable Venous Access Device, consider subscribing to industry newsletters, following relevant companies and organizations, or regularly checking reputable industry news sources and publications.
Methodology
Step 1 - Identification of Relevant Samples Size from Population Database


Step 2 - Approaches for Defining Global Market Size (Value, Volume* & Price*)

Note*: In applicable scenarios
Step 3 - Data Sources
Primary Research
- Web Analytics
- Survey Reports
- Research Institute
- Latest Research Reports
- Opinion Leaders
Secondary Research
- Annual Reports
- White Paper
- Latest Press Release
- Industry Association
- Paid Database
- Investor Presentations

Step 4 - Data Triangulation
Involves using different sources of information in order to increase the validity of a study
These sources are likely to be stakeholders in a program - participants, other researchers, program staff, other community members, and so on.
Then we put all data in single framework & apply various statistical tools to find out the dynamic on the market.
During the analysis stage, feedback from the stakeholder groups would be compared to determine areas of agreement as well as areas of divergence