

Key Insights
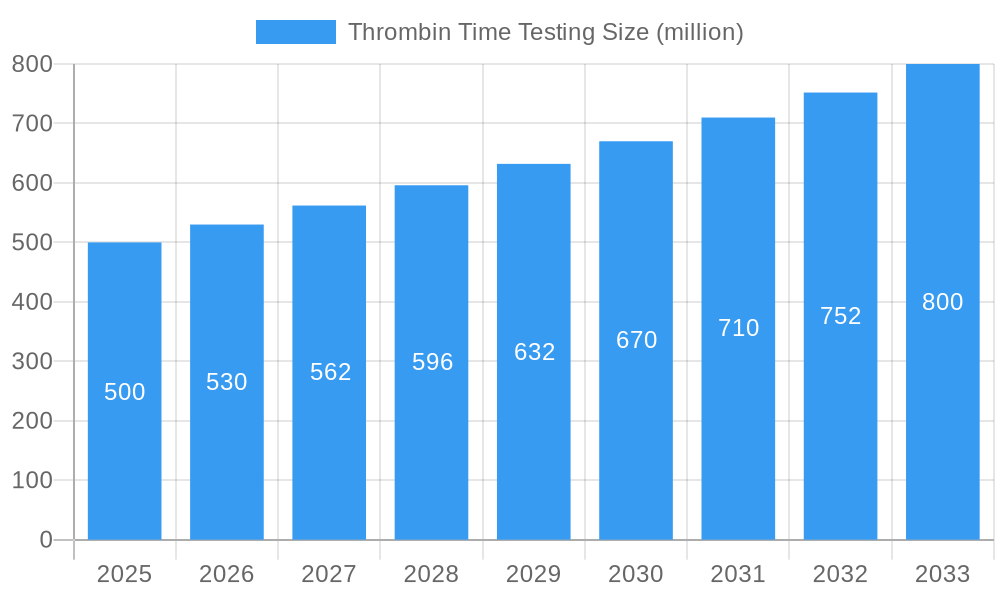
The global thrombin time testing market is experiencing robust growth, driven by the increasing prevalence of bleeding disorders and cardiovascular diseases, coupled with advancements in diagnostic technologies. The market's expansion is further fueled by the rising demand for point-of-care testing, enabling faster diagnosis and treatment initiation. Technological innovations, such as automated systems and improved reagents, are enhancing the accuracy and efficiency of thrombin time testing, contributing to market expansion. While the market faces challenges such as the availability of substitute tests and the high cost of advanced equipment, the overall growth trajectory remains positive, largely due to the increasing awareness of coagulation disorders and the need for accurate diagnostic tools. We estimate the 2025 market size to be around $500 million, based on industry analysis and considering the growth potential of emerging markets. A projected CAGR of 6% over the forecast period (2025-2033) suggests a steady expansion driven by factors mentioned above, reaching an estimated market value exceeding $850 million by 2033. Key players in this market, including Abbott, Danaher, and Siemens Healthcare, are focusing on R&D to improve their product offerings and expand their market reach.
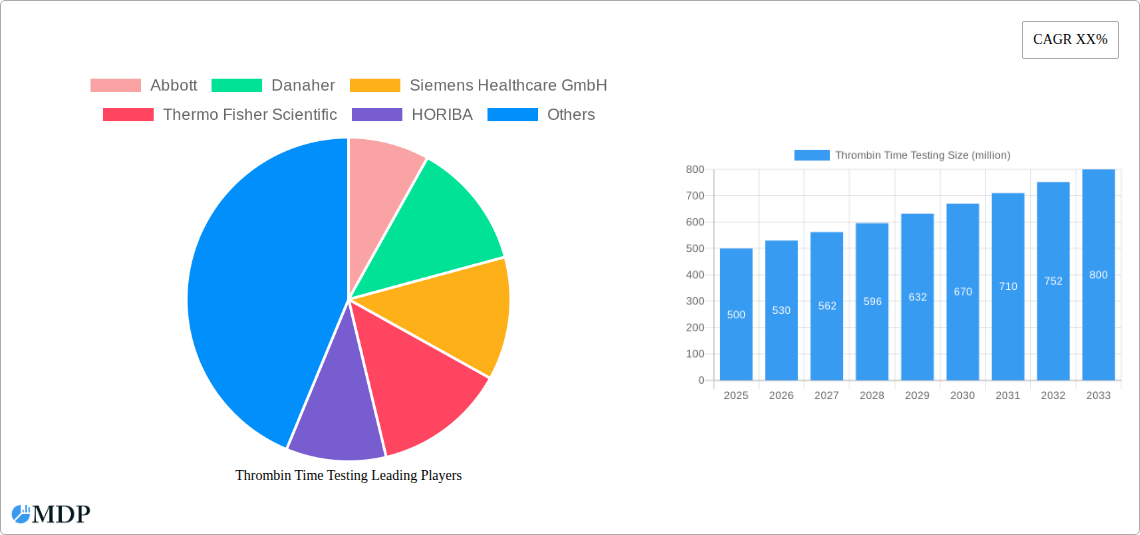
Thrombin Time Testing Market Size (In Million)
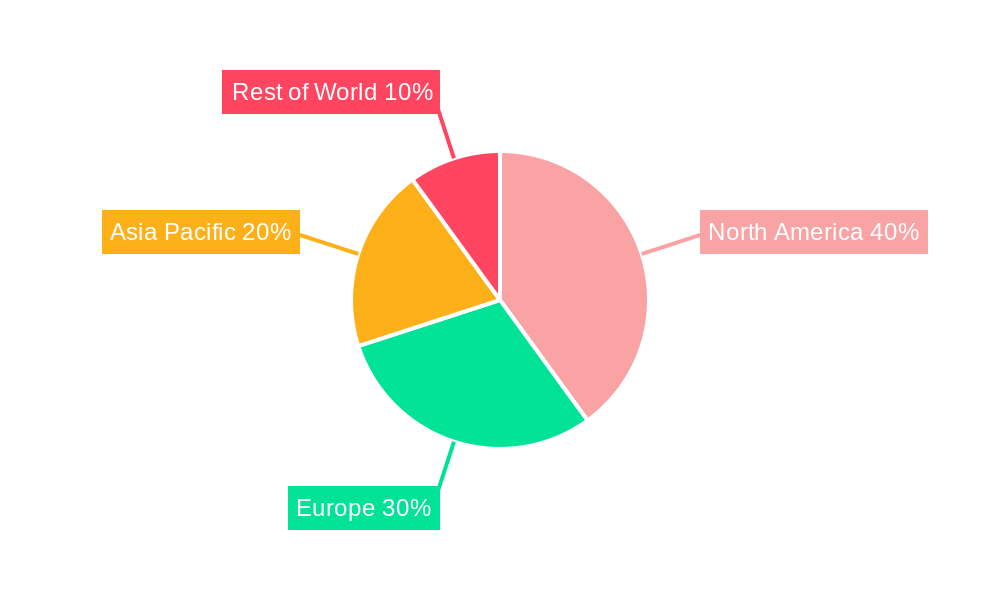
The segmentation of the thrombin time testing market is diverse, encompassing various instruments, reagents, and end-users. The hospital segment is expected to dominate due to the higher volume of testing performed in these facilities. However, the growing adoption of point-of-care testing is leading to increased demand from smaller clinics and diagnostic centers. Geographic regions like North America and Europe are currently leading the market due to established healthcare infrastructure and higher awareness levels, while developing economies show significant growth potential due to rising healthcare spending and improved access to diagnostic tools. Competitive dynamics are characterized by both established players and emerging companies vying for market share through technological innovation, strategic partnerships, and regional expansion. The market's future will be shaped by technological advancements in testing methodologies, evolving regulatory frameworks, and the ongoing focus on improving patient outcomes.
Thrombin Time Testing Company Market Share
Thrombin Time Testing Market Report: A Comprehensive Analysis (2019-2033)
This comprehensive report provides an in-depth analysis of the global Thrombin Time Testing market, projecting a market value exceeding $XX million by 2033. The study covers the period from 2019 to 2033, with 2025 as the base and estimated year. This report is a vital resource for industry stakeholders, investors, and researchers seeking actionable insights into this dynamic market.
Thrombin Time Testing Market Dynamics & Concentration
The global Thrombin Time Testing market is characterized by a moderately concentrated landscape, with key players like Abbott, Danaher, Siemens Healthcare GmbH, and Thermo Fisher Scientific holding significant market share. The combined market share of the top five players is estimated at XX%, as of 2025. Market concentration is influenced by factors such as regulatory approvals, technological advancements, and strategic mergers and acquisitions (M&A). The historical period (2019-2024) witnessed approximately XX M&A deals, primarily driven by companies aiming to expand their product portfolios and geographical reach. Innovation is a key driver, with continuous efforts to develop faster, more accurate, and automated testing systems. Regulatory frameworks, such as those set by the FDA and other global health organizations, significantly impact market growth. The availability of substitute tests, such as PT/INR testing, presents a challenge. End-user trends, including increased demand from hospitals and diagnostic laboratories, are driving market expansion.
- Market Share: Top 5 players hold XX% (2025 estimate).
- M&A Activity: Approximately XX deals during 2019-2024.
- Innovation Drivers: Development of automated and point-of-care testing systems.
- Regulatory Framework: Stringent regulations influence market access and product development.
Thrombin Time Testing Industry Trends & Analysis
The Thrombin Time Testing market exhibits a robust Compound Annual Growth Rate (CAGR) of XX% during the forecast period (2025-2033). This growth is fueled by several key factors. Rising prevalence of thrombotic disorders globally is a major driver, leading to increased demand for accurate and timely coagulation testing. Technological advancements, such as the development of automated and point-of-care testing systems, are enhancing efficiency and accessibility. Changing consumer preferences towards faster and more reliable diagnostic solutions further contribute to market expansion. The competitive landscape is characterized by intense rivalry among established players and emerging companies, spurring innovation and price competition. Market penetration in developing economies is expected to increase significantly due to rising healthcare expenditure and awareness of coagulation disorders.
Leading Markets & Segments in Thrombin Time Testing
The North American region currently holds the largest market share in Thrombin Time Testing, driven by factors such as advanced healthcare infrastructure, high prevalence of cardiovascular diseases, and substantial investments in diagnostic technologies.
- Key Drivers in North America:
- Robust healthcare infrastructure.
- High prevalence of cardiovascular diseases.
- Significant investments in diagnostic technologies.
- Favorable regulatory environment.
The European market is also a significant contributor, with strong growth expected in developing economies across Asia-Pacific and Latin America due to increasing healthcare expenditure and rising awareness of coagulation disorders.
Thrombin Time Testing Product Developments
Recent advancements in Thrombin Time Testing include the development of automated analyzers that offer improved accuracy, reduced turnaround time, and increased throughput. Point-of-care testing devices are gaining traction, enabling rapid diagnosis at the bedside. These innovations address the growing demand for faster and more efficient coagulation testing in various healthcare settings. Companies are focusing on developing user-friendly devices with enhanced features to improve the overall testing experience.
Key Drivers of Thrombin Time Testing Growth
Several factors drive the growth of the Thrombin Time Testing market. The rising prevalence of thrombotic diseases necessitates frequent testing, boosting market demand. Technological advancements, including automated analyzers and point-of-care devices, improve efficiency and accessibility. Stringent regulatory frameworks emphasizing accurate diagnosis further stimulate market growth. Increased healthcare spending, particularly in developing economies, fuels market expansion.
Challenges in the Thrombin Time Testing Market
The Thrombin Time Testing market faces challenges such as stringent regulatory approvals, which can increase the time and cost of bringing new products to market. Supply chain disruptions can impact the availability of testing reagents and consumables. Intense competition among established players and emerging companies puts pressure on pricing and profitability. These factors influence the market's overall growth trajectory.
Emerging Opportunities in Thrombin Time Testing
Technological breakthroughs in point-of-care diagnostics and the development of advanced analytical techniques offer significant opportunities for growth. Strategic partnerships between manufacturers and healthcare providers can enhance market access and adoption. Expansion into emerging markets with significant unmet medical needs promises significant long-term growth potential.
Leading Players in the Thrombin Time Testing Sector
- Abbott
- Danaher
- Siemens Healthcare GmbH
- Thermo Fisher Scientific
- HORIBA, Ltd
- NIHON KOHDEN CORPORATION
- F. Hoffmann-La Roche Ltd
- A&T Corporation
- Helena Laboratories Corporation
- BPC BioSed S.R.L
- Meril Life Sciences Pvt. Ltd
- Haemonetics Corporation
- ACON Laboratories, Inc
- Coagulation Sciences LLC
- Shenzhen Micropoint Biotechnologies Co., Ltd
Key Milestones in Thrombin Time Testing Industry
- 2020: Abbott launches a new automated Thrombin Time analyzer.
- 2022: Siemens Healthcare GmbH receives FDA approval for a novel point-of-care Thrombin Time testing device.
- 2023: A strategic partnership is formed between Thermo Fisher Scientific and a major hospital system to improve access to Thrombin Time testing. (Further milestones will be added based on available data)
Strategic Outlook for Thrombin Time Testing Market
The Thrombin Time Testing market presents substantial growth potential driven by technological advancements, increasing prevalence of thrombotic disorders, and expanding healthcare infrastructure globally. Strategic partnerships, market expansion into developing economies, and a focus on innovation will be key to capturing market share and achieving long-term success in this dynamic industry. The market is poised for significant expansion, with the projected value exceeding $XX million by 2033.
Thrombin Time Testing Segmentation
-
1. Application
- 1.1. Hospital
- 1.2. Specialist Clinic
- 1.3. O ther
-
2. Types
- 2.1. Consumables
- 2.2. Instrument
Thrombin Time Testing Segmentation By Geography
-
1. North America
- 1.1. United States
- 1.2. Canada
- 1.3. Mexico
-
2. South America
- 2.1. Brazil
- 2.2. Argentina
- 2.3. Rest of South America
-
3. Europe
- 3.1. United Kingdom
- 3.2. Germany
- 3.3. France
- 3.4. Italy
- 3.5. Spain
- 3.6. Russia
- 3.7. Benelux
- 3.8. Nordics
- 3.9. Rest of Europe
-
4. Middle East & Africa
- 4.1. Turkey
- 4.2. Israel
- 4.3. GCC
- 4.4. North Africa
- 4.5. South Africa
- 4.6. Rest of Middle East & Africa
-
5. Asia Pacific
- 5.1. China
- 5.2. India
- 5.3. Japan
- 5.4. South Korea
- 5.5. ASEAN
- 5.6. Oceania
- 5.7. Rest of Asia Pacific
Thrombin Time Testing Regional Market Share
Geographic Coverage of Thrombin Time Testing
Thrombin Time Testing REPORT HIGHLIGHTS
| Aspects | Details |
|---|---|
| Study Period | 2020-2034 |
| Base Year | 2025 |
| Estimated Year | 2026 |
| Forecast Period | 2026-2034 |
| Historical Period | 2020-2025 |
| Growth Rate | CAGR of 10.8% from 2020-2034 |
| Segmentation |
|
Table of Contents
- 1. Introduction
- 1.1. Research Scope
- 1.2. Market Segmentation
- 1.3. Research Objective
- 1.4. Definitions and Assumptions
- 2. Executive Summary
- 2.1. Market Snapshot
- 3. Market Dynamics
- 3.1. Market Drivers
- 3.2. Market Restrains
- 3.3. Market Trends
- 3.4. Market Opportunities
- 4. Market Factor Analysis
- 4.1. Porters Five Forces
- 4.1.1. Bargaining Power of Suppliers
- 4.1.2. Bargaining Power of Buyers
- 4.1.3. Threat of New Entrants
- 4.1.4. Threat of Substitutes
- 4.1.5. Competitive Rivalry
- 4.2. PESTEL analysis
- 4.3. BCG Analysis
- 4.3.1. Stars (High Growth, High Market Share)
- 4.3.2. Cash Cows (Low Growth, High Market Share)
- 4.3.3. Question Mark (High Growth, Low Market Share)
- 4.3.4. Dogs (Low Growth, Low Market Share)
- 4.4. Ansoff Matrix Analysis
- 4.5. Supply Chain Analysis
- 4.6. Regulatory Landscape
- 4.7. Current Market Potential and Opportunity Assessment (TAM–SAM–SOM Framework)
- 4.8. MDP Analyst Note
- 4.1. Porters Five Forces
- 5. Market Analysis, Insights and Forecast 2021-2033
- 5.1. Market Analysis, Insights and Forecast - by Application
- 5.1.1. Hospital
- 5.1.2. Specialist Clinic
- 5.1.3. O ther
- 5.2. Market Analysis, Insights and Forecast - by Types
- 5.2.1. Consumables
- 5.2.2. Instrument
- 5.3. Market Analysis, Insights and Forecast - by Region
- 5.3.1. North America
- 5.3.2. South America
- 5.3.3. Europe
- 5.3.4. Middle East & Africa
- 5.3.5. Asia Pacific
- 5.1. Market Analysis, Insights and Forecast - by Application
- 6. Global Thrombin Time Testing Analysis, Insights and Forecast, 2021-2033
- 6.1. Market Analysis, Insights and Forecast - by Application
- 6.1.1. Hospital
- 6.1.2. Specialist Clinic
- 6.1.3. O ther
- 6.2. Market Analysis, Insights and Forecast - by Types
- 6.2.1. Consumables
- 6.2.2. Instrument
- 6.1. Market Analysis, Insights and Forecast - by Application
- 7. North America Thrombin Time Testing Analysis, Insights and Forecast, 2020-2032
- 7.1. Market Analysis, Insights and Forecast - by Application
- 7.1.1. Hospital
- 7.1.2. Specialist Clinic
- 7.1.3. O ther
- 7.2. Market Analysis, Insights and Forecast - by Types
- 7.2.1. Consumables
- 7.2.2. Instrument
- 7.1. Market Analysis, Insights and Forecast - by Application
- 8. South America Thrombin Time Testing Analysis, Insights and Forecast, 2020-2032
- 8.1. Market Analysis, Insights and Forecast - by Application
- 8.1.1. Hospital
- 8.1.2. Specialist Clinic
- 8.1.3. O ther
- 8.2. Market Analysis, Insights and Forecast - by Types
- 8.2.1. Consumables
- 8.2.2. Instrument
- 8.1. Market Analysis, Insights and Forecast - by Application
- 9. Europe Thrombin Time Testing Analysis, Insights and Forecast, 2020-2032
- 9.1. Market Analysis, Insights and Forecast - by Application
- 9.1.1. Hospital
- 9.1.2. Specialist Clinic
- 9.1.3. O ther
- 9.2. Market Analysis, Insights and Forecast - by Types
- 9.2.1. Consumables
- 9.2.2. Instrument
- 9.1. Market Analysis, Insights and Forecast - by Application
- 10. Middle East & Africa Thrombin Time Testing Analysis, Insights and Forecast, 2020-2032
- 10.1. Market Analysis, Insights and Forecast - by Application
- 10.1.1. Hospital
- 10.1.2. Specialist Clinic
- 10.1.3. O ther
- 10.2. Market Analysis, Insights and Forecast - by Types
- 10.2.1. Consumables
- 10.2.2. Instrument
- 10.1. Market Analysis, Insights and Forecast - by Application
- 11. Asia Pacific Thrombin Time Testing Analysis, Insights and Forecast, 2020-2032
- 11.1. Market Analysis, Insights and Forecast - by Application
- 11.1.1. Hospital
- 11.1.2. Specialist Clinic
- 11.1.3. O ther
- 11.2. Market Analysis, Insights and Forecast - by Types
- 11.2.1. Consumables
- 11.2.2. Instrument
- 11.1. Market Analysis, Insights and Forecast - by Application
- 12. Competitive Analysis
- 12.1. Company Profiles
- 12.1.1 Abbott
- 12.1.1.1. Company Overview
- 12.1.1.2. Products
- 12.1.1.3. Company Financials
- 12.1.1.4. SWOT Analysis
- 12.1.2 Danaher
- 12.1.2.1. Company Overview
- 12.1.2.2. Products
- 12.1.2.3. Company Financials
- 12.1.2.4. SWOT Analysis
- 12.1.3 Siemens Healthcare GmbH
- 12.1.3.1. Company Overview
- 12.1.3.2. Products
- 12.1.3.3. Company Financials
- 12.1.3.4. SWOT Analysis
- 12.1.4 Thermo Fisher Scientific
- 12.1.4.1. Company Overview
- 12.1.4.2. Products
- 12.1.4.3. Company Financials
- 12.1.4.4. SWOT Analysis
- 12.1.5 HORIBA
- 12.1.5.1. Company Overview
- 12.1.5.2. Products
- 12.1.5.3. Company Financials
- 12.1.5.4. SWOT Analysis
- 12.1.6 Ltd
- 12.1.6.1. Company Overview
- 12.1.6.2. Products
- 12.1.6.3. Company Financials
- 12.1.6.4. SWOT Analysis
- 12.1.7 NIHON KOHDEN CORPORATION
- 12.1.7.1. Company Overview
- 12.1.7.2. Products
- 12.1.7.3. Company Financials
- 12.1.7.4. SWOT Analysis
- 12.1.8 F. Hoffmann-La Roche Ltd
- 12.1.8.1. Company Overview
- 12.1.8.2. Products
- 12.1.8.3. Company Financials
- 12.1.8.4. SWOT Analysis
- 12.1.9 A&T Corporation
- 12.1.9.1. Company Overview
- 12.1.9.2. Products
- 12.1.9.3. Company Financials
- 12.1.9.4. SWOT Analysis
- 12.1.10 Helena Laboratories Corporation
- 12.1.10.1. Company Overview
- 12.1.10.2. Products
- 12.1.10.3. Company Financials
- 12.1.10.4. SWOT Analysis
- 12.1.11 BPC BioSed S.R.L
- 12.1.11.1. Company Overview
- 12.1.11.2. Products
- 12.1.11.3. Company Financials
- 12.1.11.4. SWOT Analysis
- 12.1.12 Meril Life Sciences Pvt. Ltd
- 12.1.12.1. Company Overview
- 12.1.12.2. Products
- 12.1.12.3. Company Financials
- 12.1.12.4. SWOT Analysis
- 12.1.13 Haemonetics Corporation
- 12.1.13.1. Company Overview
- 12.1.13.2. Products
- 12.1.13.3. Company Financials
- 12.1.13.4. SWOT Analysis
- 12.1.14 ACON Laboratories
- 12.1.14.1. Company Overview
- 12.1.14.2. Products
- 12.1.14.3. Company Financials
- 12.1.14.4. SWOT Analysis
- 12.1.15 Inc
- 12.1.15.1. Company Overview
- 12.1.15.2. Products
- 12.1.15.3. Company Financials
- 12.1.15.4. SWOT Analysis
- 12.1.16 Coagulation Sciences LLC
- 12.1.16.1. Company Overview
- 12.1.16.2. Products
- 12.1.16.3. Company Financials
- 12.1.16.4. SWOT Analysis
- 12.1.17 Shenzhen Micropoint Biotechnologies Co.
- 12.1.17.1. Company Overview
- 12.1.17.2. Products
- 12.1.17.3. Company Financials
- 12.1.17.4. SWOT Analysis
- 12.1.18 Ltd
- 12.1.18.1. Company Overview
- 12.1.18.2. Products
- 12.1.18.3. Company Financials
- 12.1.18.4. SWOT Analysis
- 12.1.1 Abbott
- 12.2. Market Entropy
- 12.2.1 Company's Key Areas Served
- 12.2.2 Recent Developments
- 12.3. Company Market Share Analysis 2025
- 12.3.1 Top 5 Companies Market Share Analysis
- 12.3.2 Top 3 Companies Market Share Analysis
- 12.4. List of Potential Customers
- 13. Research Methodology
List of Figures
- Figure 1: Global Thrombin Time Testing Revenue Breakdown (undefined, %) by Region 2025 & 2033
- Figure 2: Global Thrombin Time Testing Volume Breakdown (K, %) by Region 2025 & 2033
- Figure 3: North America Thrombin Time Testing Revenue (undefined), by Application 2025 & 2033
- Figure 4: North America Thrombin Time Testing Volume (K), by Application 2025 & 2033
- Figure 5: North America Thrombin Time Testing Revenue Share (%), by Application 2025 & 2033
- Figure 6: North America Thrombin Time Testing Volume Share (%), by Application 2025 & 2033
- Figure 7: North America Thrombin Time Testing Revenue (undefined), by Types 2025 & 2033
- Figure 8: North America Thrombin Time Testing Volume (K), by Types 2025 & 2033
- Figure 9: North America Thrombin Time Testing Revenue Share (%), by Types 2025 & 2033
- Figure 10: North America Thrombin Time Testing Volume Share (%), by Types 2025 & 2033
- Figure 11: North America Thrombin Time Testing Revenue (undefined), by Country 2025 & 2033
- Figure 12: North America Thrombin Time Testing Volume (K), by Country 2025 & 2033
- Figure 13: North America Thrombin Time Testing Revenue Share (%), by Country 2025 & 2033
- Figure 14: North America Thrombin Time Testing Volume Share (%), by Country 2025 & 2033
- Figure 15: South America Thrombin Time Testing Revenue (undefined), by Application 2025 & 2033
- Figure 16: South America Thrombin Time Testing Volume (K), by Application 2025 & 2033
- Figure 17: South America Thrombin Time Testing Revenue Share (%), by Application 2025 & 2033
- Figure 18: South America Thrombin Time Testing Volume Share (%), by Application 2025 & 2033
- Figure 19: South America Thrombin Time Testing Revenue (undefined), by Types 2025 & 2033
- Figure 20: South America Thrombin Time Testing Volume (K), by Types 2025 & 2033
- Figure 21: South America Thrombin Time Testing Revenue Share (%), by Types 2025 & 2033
- Figure 22: South America Thrombin Time Testing Volume Share (%), by Types 2025 & 2033
- Figure 23: South America Thrombin Time Testing Revenue (undefined), by Country 2025 & 2033
- Figure 24: South America Thrombin Time Testing Volume (K), by Country 2025 & 2033
- Figure 25: South America Thrombin Time Testing Revenue Share (%), by Country 2025 & 2033
- Figure 26: South America Thrombin Time Testing Volume Share (%), by Country 2025 & 2033
- Figure 27: Europe Thrombin Time Testing Revenue (undefined), by Application 2025 & 2033
- Figure 28: Europe Thrombin Time Testing Volume (K), by Application 2025 & 2033
- Figure 29: Europe Thrombin Time Testing Revenue Share (%), by Application 2025 & 2033
- Figure 30: Europe Thrombin Time Testing Volume Share (%), by Application 2025 & 2033
- Figure 31: Europe Thrombin Time Testing Revenue (undefined), by Types 2025 & 2033
- Figure 32: Europe Thrombin Time Testing Volume (K), by Types 2025 & 2033
- Figure 33: Europe Thrombin Time Testing Revenue Share (%), by Types 2025 & 2033
- Figure 34: Europe Thrombin Time Testing Volume Share (%), by Types 2025 & 2033
- Figure 35: Europe Thrombin Time Testing Revenue (undefined), by Country 2025 & 2033
- Figure 36: Europe Thrombin Time Testing Volume (K), by Country 2025 & 2033
- Figure 37: Europe Thrombin Time Testing Revenue Share (%), by Country 2025 & 2033
- Figure 38: Europe Thrombin Time Testing Volume Share (%), by Country 2025 & 2033
- Figure 39: Middle East & Africa Thrombin Time Testing Revenue (undefined), by Application 2025 & 2033
- Figure 40: Middle East & Africa Thrombin Time Testing Volume (K), by Application 2025 & 2033
- Figure 41: Middle East & Africa Thrombin Time Testing Revenue Share (%), by Application 2025 & 2033
- Figure 42: Middle East & Africa Thrombin Time Testing Volume Share (%), by Application 2025 & 2033
- Figure 43: Middle East & Africa Thrombin Time Testing Revenue (undefined), by Types 2025 & 2033
- Figure 44: Middle East & Africa Thrombin Time Testing Volume (K), by Types 2025 & 2033
- Figure 45: Middle East & Africa Thrombin Time Testing Revenue Share (%), by Types 2025 & 2033
- Figure 46: Middle East & Africa Thrombin Time Testing Volume Share (%), by Types 2025 & 2033
- Figure 47: Middle East & Africa Thrombin Time Testing Revenue (undefined), by Country 2025 & 2033
- Figure 48: Middle East & Africa Thrombin Time Testing Volume (K), by Country 2025 & 2033
- Figure 49: Middle East & Africa Thrombin Time Testing Revenue Share (%), by Country 2025 & 2033
- Figure 50: Middle East & Africa Thrombin Time Testing Volume Share (%), by Country 2025 & 2033
- Figure 51: Asia Pacific Thrombin Time Testing Revenue (undefined), by Application 2025 & 2033
- Figure 52: Asia Pacific Thrombin Time Testing Volume (K), by Application 2025 & 2033
- Figure 53: Asia Pacific Thrombin Time Testing Revenue Share (%), by Application 2025 & 2033
- Figure 54: Asia Pacific Thrombin Time Testing Volume Share (%), by Application 2025 & 2033
- Figure 55: Asia Pacific Thrombin Time Testing Revenue (undefined), by Types 2025 & 2033
- Figure 56: Asia Pacific Thrombin Time Testing Volume (K), by Types 2025 & 2033
- Figure 57: Asia Pacific Thrombin Time Testing Revenue Share (%), by Types 2025 & 2033
- Figure 58: Asia Pacific Thrombin Time Testing Volume Share (%), by Types 2025 & 2033
- Figure 59: Asia Pacific Thrombin Time Testing Revenue (undefined), by Country 2025 & 2033
- Figure 60: Asia Pacific Thrombin Time Testing Volume (K), by Country 2025 & 2033
- Figure 61: Asia Pacific Thrombin Time Testing Revenue Share (%), by Country 2025 & 2033
- Figure 62: Asia Pacific Thrombin Time Testing Volume Share (%), by Country 2025 & 2033
List of Tables
- Table 1: Global Thrombin Time Testing Revenue undefined Forecast, by Application 2020 & 2033
- Table 2: Global Thrombin Time Testing Volume K Forecast, by Application 2020 & 2033
- Table 3: Global Thrombin Time Testing Revenue undefined Forecast, by Types 2020 & 2033
- Table 4: Global Thrombin Time Testing Volume K Forecast, by Types 2020 & 2033
- Table 5: Global Thrombin Time Testing Revenue undefined Forecast, by Region 2020 & 2033
- Table 6: Global Thrombin Time Testing Volume K Forecast, by Region 2020 & 2033
- Table 7: Global Thrombin Time Testing Revenue undefined Forecast, by Application 2020 & 2033
- Table 8: Global Thrombin Time Testing Volume K Forecast, by Application 2020 & 2033
- Table 9: Global Thrombin Time Testing Revenue undefined Forecast, by Types 2020 & 2033
- Table 10: Global Thrombin Time Testing Volume K Forecast, by Types 2020 & 2033
- Table 11: Global Thrombin Time Testing Revenue undefined Forecast, by Country 2020 & 2033
- Table 12: Global Thrombin Time Testing Volume K Forecast, by Country 2020 & 2033
- Table 13: United States Thrombin Time Testing Revenue (undefined) Forecast, by Application 2020 & 2033
- Table 14: United States Thrombin Time Testing Volume (K) Forecast, by Application 2020 & 2033
- Table 15: Canada Thrombin Time Testing Revenue (undefined) Forecast, by Application 2020 & 2033
- Table 16: Canada Thrombin Time Testing Volume (K) Forecast, by Application 2020 & 2033
- Table 17: Mexico Thrombin Time Testing Revenue (undefined) Forecast, by Application 2020 & 2033
- Table 18: Mexico Thrombin Time Testing Volume (K) Forecast, by Application 2020 & 2033
- Table 19: Global Thrombin Time Testing Revenue undefined Forecast, by Application 2020 & 2033
- Table 20: Global Thrombin Time Testing Volume K Forecast, by Application 2020 & 2033
- Table 21: Global Thrombin Time Testing Revenue undefined Forecast, by Types 2020 & 2033
- Table 22: Global Thrombin Time Testing Volume K Forecast, by Types 2020 & 2033
- Table 23: Global Thrombin Time Testing Revenue undefined Forecast, by Country 2020 & 2033
- Table 24: Global Thrombin Time Testing Volume K Forecast, by Country 2020 & 2033
- Table 25: Brazil Thrombin Time Testing Revenue (undefined) Forecast, by Application 2020 & 2033
- Table 26: Brazil Thrombin Time Testing Volume (K) Forecast, by Application 2020 & 2033
- Table 27: Argentina Thrombin Time Testing Revenue (undefined) Forecast, by Application 2020 & 2033
- Table 28: Argentina Thrombin Time Testing Volume (K) Forecast, by Application 2020 & 2033
- Table 29: Rest of South America Thrombin Time Testing Revenue (undefined) Forecast, by Application 2020 & 2033
- Table 30: Rest of South America Thrombin Time Testing Volume (K) Forecast, by Application 2020 & 2033
- Table 31: Global Thrombin Time Testing Revenue undefined Forecast, by Application 2020 & 2033
- Table 32: Global Thrombin Time Testing Volume K Forecast, by Application 2020 & 2033
- Table 33: Global Thrombin Time Testing Revenue undefined Forecast, by Types 2020 & 2033
- Table 34: Global Thrombin Time Testing Volume K Forecast, by Types 2020 & 2033
- Table 35: Global Thrombin Time Testing Revenue undefined Forecast, by Country 2020 & 2033
- Table 36: Global Thrombin Time Testing Volume K Forecast, by Country 2020 & 2033
- Table 37: United Kingdom Thrombin Time Testing Revenue (undefined) Forecast, by Application 2020 & 2033
- Table 38: United Kingdom Thrombin Time Testing Volume (K) Forecast, by Application 2020 & 2033
- Table 39: Germany Thrombin Time Testing Revenue (undefined) Forecast, by Application 2020 & 2033
- Table 40: Germany Thrombin Time Testing Volume (K) Forecast, by Application 2020 & 2033
- Table 41: France Thrombin Time Testing Revenue (undefined) Forecast, by Application 2020 & 2033
- Table 42: France Thrombin Time Testing Volume (K) Forecast, by Application 2020 & 2033
- Table 43: Italy Thrombin Time Testing Revenue (undefined) Forecast, by Application 2020 & 2033
- Table 44: Italy Thrombin Time Testing Volume (K) Forecast, by Application 2020 & 2033
- Table 45: Spain Thrombin Time Testing Revenue (undefined) Forecast, by Application 2020 & 2033
- Table 46: Spain Thrombin Time Testing Volume (K) Forecast, by Application 2020 & 2033
- Table 47: Russia Thrombin Time Testing Revenue (undefined) Forecast, by Application 2020 & 2033
- Table 48: Russia Thrombin Time Testing Volume (K) Forecast, by Application 2020 & 2033
- Table 49: Benelux Thrombin Time Testing Revenue (undefined) Forecast, by Application 2020 & 2033
- Table 50: Benelux Thrombin Time Testing Volume (K) Forecast, by Application 2020 & 2033
- Table 51: Nordics Thrombin Time Testing Revenue (undefined) Forecast, by Application 2020 & 2033
- Table 52: Nordics Thrombin Time Testing Volume (K) Forecast, by Application 2020 & 2033
- Table 53: Rest of Europe Thrombin Time Testing Revenue (undefined) Forecast, by Application 2020 & 2033
- Table 54: Rest of Europe Thrombin Time Testing Volume (K) Forecast, by Application 2020 & 2033
- Table 55: Global Thrombin Time Testing Revenue undefined Forecast, by Application 2020 & 2033
- Table 56: Global Thrombin Time Testing Volume K Forecast, by Application 2020 & 2033
- Table 57: Global Thrombin Time Testing Revenue undefined Forecast, by Types 2020 & 2033
- Table 58: Global Thrombin Time Testing Volume K Forecast, by Types 2020 & 2033
- Table 59: Global Thrombin Time Testing Revenue undefined Forecast, by Country 2020 & 2033
- Table 60: Global Thrombin Time Testing Volume K Forecast, by Country 2020 & 2033
- Table 61: Turkey Thrombin Time Testing Revenue (undefined) Forecast, by Application 2020 & 2033
- Table 62: Turkey Thrombin Time Testing Volume (K) Forecast, by Application 2020 & 2033
- Table 63: Israel Thrombin Time Testing Revenue (undefined) Forecast, by Application 2020 & 2033
- Table 64: Israel Thrombin Time Testing Volume (K) Forecast, by Application 2020 & 2033
- Table 65: GCC Thrombin Time Testing Revenue (undefined) Forecast, by Application 2020 & 2033
- Table 66: GCC Thrombin Time Testing Volume (K) Forecast, by Application 2020 & 2033
- Table 67: North Africa Thrombin Time Testing Revenue (undefined) Forecast, by Application 2020 & 2033
- Table 68: North Africa Thrombin Time Testing Volume (K) Forecast, by Application 2020 & 2033
- Table 69: South Africa Thrombin Time Testing Revenue (undefined) Forecast, by Application 2020 & 2033
- Table 70: South Africa Thrombin Time Testing Volume (K) Forecast, by Application 2020 & 2033
- Table 71: Rest of Middle East & Africa Thrombin Time Testing Revenue (undefined) Forecast, by Application 2020 & 2033
- Table 72: Rest of Middle East & Africa Thrombin Time Testing Volume (K) Forecast, by Application 2020 & 2033
- Table 73: Global Thrombin Time Testing Revenue undefined Forecast, by Application 2020 & 2033
- Table 74: Global Thrombin Time Testing Volume K Forecast, by Application 2020 & 2033
- Table 75: Global Thrombin Time Testing Revenue undefined Forecast, by Types 2020 & 2033
- Table 76: Global Thrombin Time Testing Volume K Forecast, by Types 2020 & 2033
- Table 77: Global Thrombin Time Testing Revenue undefined Forecast, by Country 2020 & 2033
- Table 78: Global Thrombin Time Testing Volume K Forecast, by Country 2020 & 2033
- Table 79: China Thrombin Time Testing Revenue (undefined) Forecast, by Application 2020 & 2033
- Table 80: China Thrombin Time Testing Volume (K) Forecast, by Application 2020 & 2033
- Table 81: India Thrombin Time Testing Revenue (undefined) Forecast, by Application 2020 & 2033
- Table 82: India Thrombin Time Testing Volume (K) Forecast, by Application 2020 & 2033
- Table 83: Japan Thrombin Time Testing Revenue (undefined) Forecast, by Application 2020 & 2033
- Table 84: Japan Thrombin Time Testing Volume (K) Forecast, by Application 2020 & 2033
- Table 85: South Korea Thrombin Time Testing Revenue (undefined) Forecast, by Application 2020 & 2033
- Table 86: South Korea Thrombin Time Testing Volume (K) Forecast, by Application 2020 & 2033
- Table 87: ASEAN Thrombin Time Testing Revenue (undefined) Forecast, by Application 2020 & 2033
- Table 88: ASEAN Thrombin Time Testing Volume (K) Forecast, by Application 2020 & 2033
- Table 89: Oceania Thrombin Time Testing Revenue (undefined) Forecast, by Application 2020 & 2033
- Table 90: Oceania Thrombin Time Testing Volume (K) Forecast, by Application 2020 & 2033
- Table 91: Rest of Asia Pacific Thrombin Time Testing Revenue (undefined) Forecast, by Application 2020 & 2033
- Table 92: Rest of Asia Pacific Thrombin Time Testing Volume (K) Forecast, by Application 2020 & 2033
Frequently Asked Questions
1. What is the projected Compound Annual Growth Rate (CAGR) of the Thrombin Time Testing?
The projected CAGR is approximately 10.8%.
2. Which companies are prominent players in the Thrombin Time Testing?
Key companies in the market include Abbott, Danaher, Siemens Healthcare GmbH, Thermo Fisher Scientific, HORIBA, Ltd, NIHON KOHDEN CORPORATION, F. Hoffmann-La Roche Ltd, A&T Corporation, Helena Laboratories Corporation, BPC BioSed S.R.L, Meril Life Sciences Pvt. Ltd, Haemonetics Corporation, ACON Laboratories, Inc, Coagulation Sciences LLC, Shenzhen Micropoint Biotechnologies Co., Ltd.
3. What are the main segments of the Thrombin Time Testing?
The market segments include Application, Types.
4. Can you provide details about the market size?
The market size is estimated to be USD XXX N/A as of 2022.
5. What are some drivers contributing to market growth?
N/A
6. What are the notable trends driving market growth?
N/A
7. Are there any restraints impacting market growth?
N/A
8. Can you provide examples of recent developments in the market?
N/A
9. What pricing options are available for accessing the report?
Pricing options include single-user, multi-user, and enterprise licenses priced at USD 3950.00, USD 5925.00, and USD 7900.00 respectively.
10. Is the market size provided in terms of value or volume?
The market size is provided in terms of value, measured in N/A and volume, measured in K.
11. Are there any specific market keywords associated with the report?
Yes, the market keyword associated with the report is "Thrombin Time Testing," which aids in identifying and referencing the specific market segment covered.
12. How do I determine which pricing option suits my needs best?
The pricing options vary based on user requirements and access needs. Individual users may opt for single-user licenses, while businesses requiring broader access may choose multi-user or enterprise licenses for cost-effective access to the report.
13. Are there any additional resources or data provided in the Thrombin Time Testing report?
While the report offers comprehensive insights, it's advisable to review the specific contents or supplementary materials provided to ascertain if additional resources or data are available.
14. How can I stay updated on further developments or reports in the Thrombin Time Testing?
To stay informed about further developments, trends, and reports in the Thrombin Time Testing, consider subscribing to industry newsletters, following relevant companies and organizations, or regularly checking reputable industry news sources and publications.
Methodology
Step 1 - Identification of Relevant Samples Size from Population Database


Step 2 - Approaches for Defining Global Market Size (Value, Volume* & Price*)

Note*: In applicable scenarios
Step 3 - Data Sources
Primary Research
- Web Analytics
- Survey Reports
- Research Institute
- Latest Research Reports
- Opinion Leaders
Secondary Research
- Annual Reports
- White Paper
- Latest Press Release
- Industry Association
- Paid Database
- Investor Presentations

Step 4 - Data Triangulation
Involves using different sources of information in order to increase the validity of a study
These sources are likely to be stakeholders in a program - participants, other researchers, program staff, other community members, and so on.
Then we put all data in single framework & apply various statistical tools to find out the dynamic on the market.
During the analysis stage, feedback from the stakeholder groups would be compared to determine areas of agreement as well as areas of divergence