

Key Insights
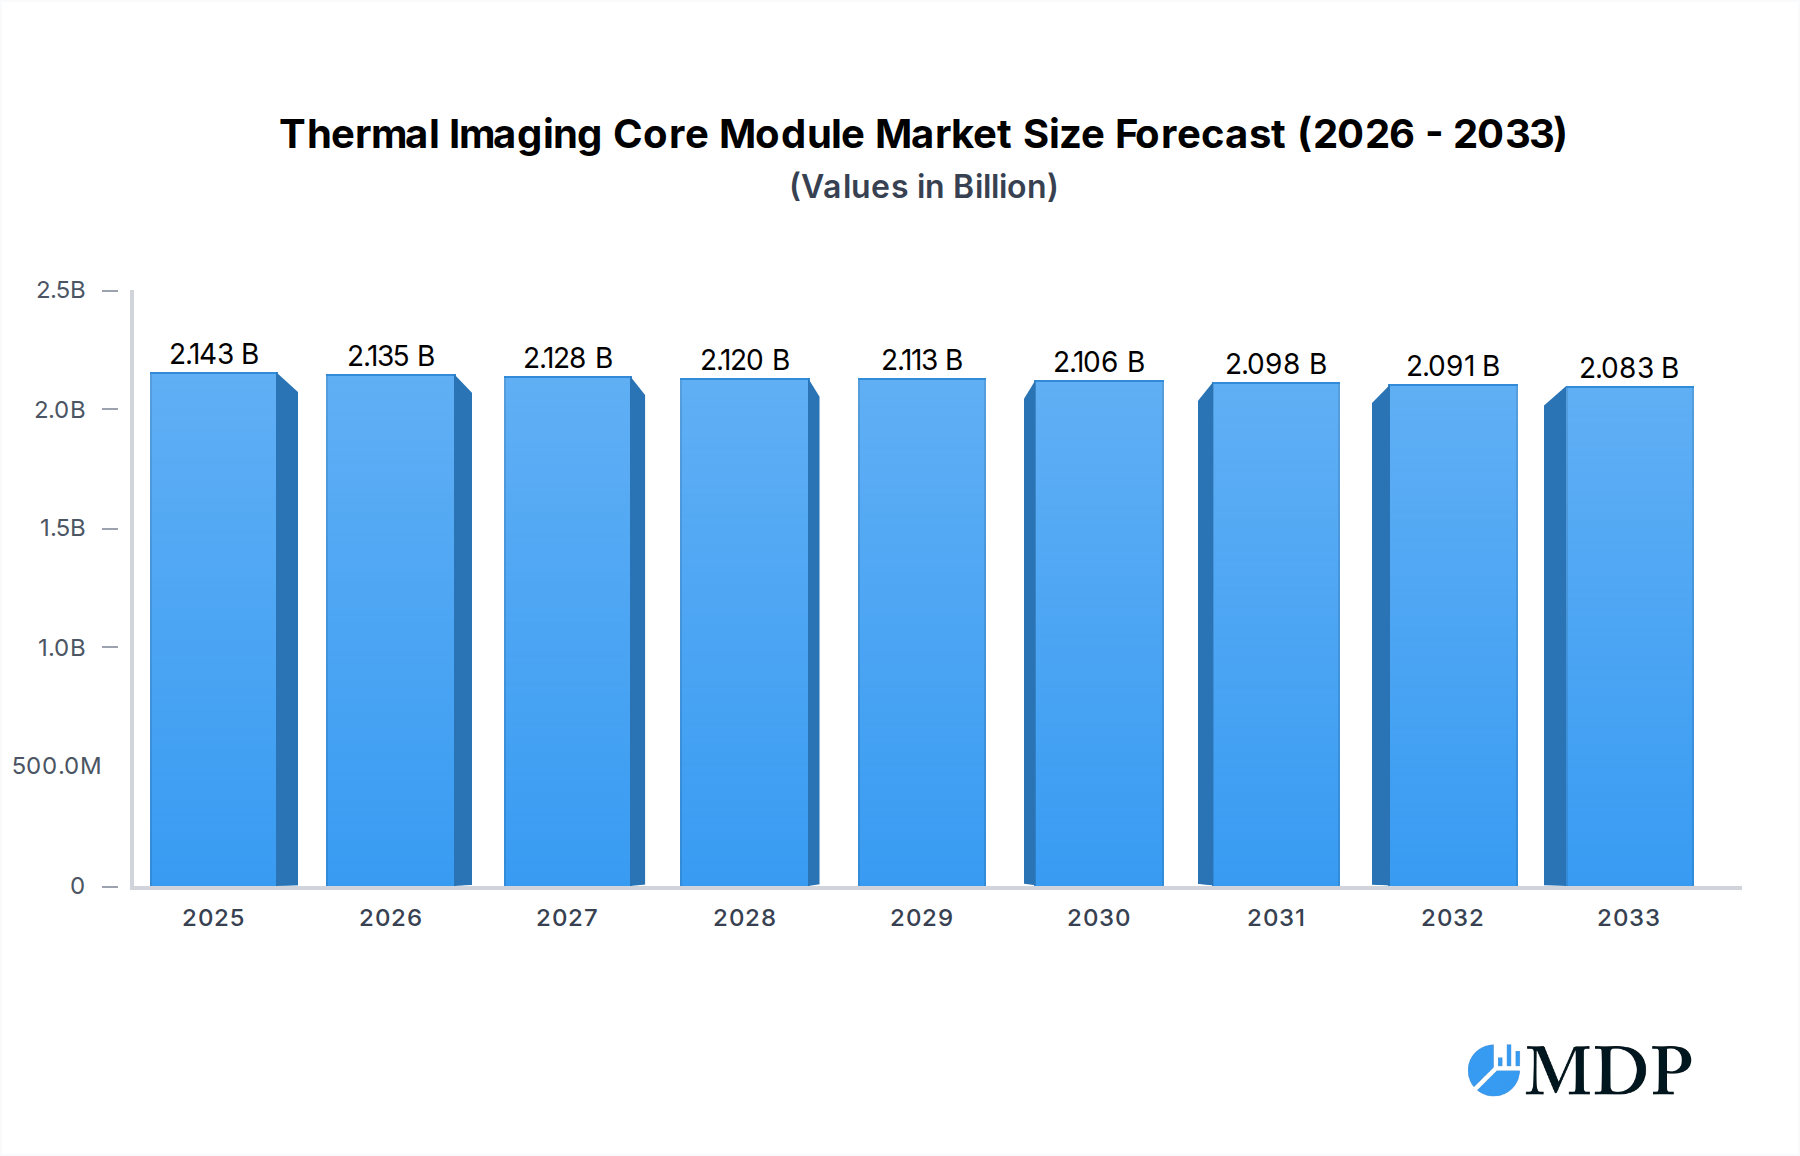
The global Thermal Imaging Core Module market is projected to reach $2142.7 million by 2025, exhibiting a slight -0.4% CAGR from 2019-2033. This modest contraction suggests a mature market with shifting dynamics, potentially driven by increased component efficiency and a stabilization in demand from core applications. While the overall growth appears flat, significant opportunities likely lie within specific segments and evolving applications. The market is characterized by a duplicity of applications: Civil Use, which encompasses a broad range of commercial and industrial uses, and Military Use, a critical sector for defense applications. On the technology front, the market is bifurcated into Uncooled Type and Cooled Type modules. Uncooled thermal imaging cores are generally more cost-effective and suitable for widespread civil applications due to their lower power consumption and maintenance needs. Conversely, Cooled thermal imaging cores offer superior performance, higher sensitivity, and faster response times, making them indispensable for demanding military and advanced scientific research applications where precision and clarity are paramount. This segmentation highlights a strategic division in the market catering to vastly different performance requirements and price points, suggesting a nuanced market landscape rather than a uniform decline.

Thermal Imaging Core Module Market Size (In Billion)
The industry is influenced by several key drivers, including advancements in sensor technology leading to smaller, more power-efficient, and higher-resolution thermal imaging cores. The increasing adoption of thermal imaging in non-traditional sectors like automotive (for advanced driver-assistance systems), building diagnostics, and predictive maintenance is also a significant growth enabler. However, the market faces restraints such as the high cost of advanced cooled thermal imaging modules and stringent export controls for certain defense-related technologies. Emerging trends point towards miniaturization, enhanced processing capabilities integrated within the core modules, and the development of lower-cost uncooled solutions for broader consumer and commercial adoption. Major players like Teledyne FLIR, Lynred, and Wuhan Guide Infrared Co., Ltd. are actively investing in research and development to innovate and maintain their competitive edge in this evolving landscape. The geographical distribution of the market shows a strong presence in North America and Asia Pacific, driven by both defense spending and industrial growth.
Thermal Imaging Core Module Company Market Share
Explore the rapidly evolving landscape of thermal imaging core modules, a critical technology underpinning advancements in civil and military applications. This comprehensive report provides an in-depth analysis of market dynamics, key trends, leading players, and future opportunities within the global thermal imaging core module industry from 2019 to 2033.
Gain unparalleled insights into market concentration, innovation drivers, regulatory frameworks, product substitutes, end-user trends, and M&A activities within the thermal imaging core module sector. With a projected market value reaching over $10 million by 2025, this report dissects the competitive landscape and identifies key strategic moves that are shaping the industry.
Thermal Imaging Core Module Market Dynamics & Concentration
The global thermal imaging core module market exhibits moderate concentration, with several key players dominating significant portions of the industry. Leading companies such as Teledyne FLIR, Lynred, and Wuhan Guide Infrared Co.,Ltd. have established strong market positions through continuous innovation and strategic acquisitions. The study period (2019–2033) highlights a consistent drive for technological advancement, with R&D investments exceeding $500 million annually across the sector. Regulatory frameworks, particularly concerning defense applications and export controls, play a crucial role in shaping market access and product development. Product substitutes, while nascent, are emerging in specific niche applications, prompting manufacturers to focus on enhancing performance and reducing costs. End-user trends reveal a growing demand for miniaturized, high-resolution thermal imaging cores across a wide array of civilian sectors, including industrial inspection, automotive safety, and consumer electronics. Mergers and acquisitions (M&A) have been a significant driver of market consolidation, with approximately 15 major M&A deals valued at over $50 million each recorded between 2019 and 2024, further concentrating market share among established entities.
Thermal Imaging Core Module Industry Trends & Analysis
The thermal imaging core module industry is poised for substantial growth, driven by an escalating demand for advanced sensing capabilities across both civil and military spheres. The market is projected to experience a Compound Annual Growth Rate (CAGR) of approximately 8.5% during the forecast period (2025–2033), expanding from an estimated $10 million in the base year 2025 to over $20 million by 2033. This growth is fueled by significant technological disruptions, including the development of more sensitive and cost-effective microbolometer technologies and the increasing integration of artificial intelligence (AI) for enhanced image processing and analysis. Consumer preferences are shifting towards more user-friendly and integrated thermal solutions, particularly in sectors like building diagnostics, fire safety, and security surveillance. Competitive dynamics are intensifying, with companies continually investing in R&D to offer superior resolution, lower power consumption, and smaller form factors. Market penetration is deepening across various applications, as the benefits of thermal imaging become more widely recognized and its cost becomes more accessible. For instance, the adoption rate in the automotive sector for advanced driver-assistance systems (ADAS) is expected to climb from under 5% in 2023 to over 15% by 2028. The military segment continues to be a significant revenue generator, with ongoing investments in enhanced situational awareness and precision targeting systems driving demand for high-performance cooled and uncooled thermal cores. The civil use segment, however, is exhibiting a faster growth trajectory, propelled by widespread adoption in emerging markets and innovative new product applications in smart cities and IoT devices.
Leading Markets & Segments in Thermal Imaging Core Module
The Civil Use segment is emerging as a dominant force in the thermal imaging core module market, driven by a confluence of factors including increasing infrastructure development, growing awareness of safety and security needs, and the proliferation of smart technologies. Within the Civil Use application, the Uncooled Type thermal imaging core modules are experiencing exceptional demand due to their cost-effectiveness and compact size, making them ideal for integration into a broad range of consumer and commercial products. Regions such as North America and Europe currently lead in terms of market penetration, owing to their advanced technological infrastructure and stringent safety regulations that mandate the use of advanced imaging systems.
- North America: Dominance fueled by extensive R&D investments, significant military spending, and a robust adoption rate in civilian sectors like industrial inspection and public safety.
- Europe: Strong market presence driven by government initiatives for smart city development, stringent energy efficiency regulations for buildings, and a mature automotive industry's demand for ADAS.
- Asia-Pacific: Exhibiting the fastest growth, propelled by rapid industrialization, expanding manufacturing capabilities, and increasing adoption of thermal imaging in emerging economies for infrastructure monitoring and security.
In terms of Types, the Uncooled Type thermal imaging core modules are set to outpace the Cooled Type in overall market volume. This is primarily attributed to their decreasing cost of production and continuous improvements in performance, making them a more accessible solution for a wider array of applications. While Cooled Type modules will remain critical for high-end military and scientific applications requiring extreme sensitivity, the sheer volume of adoption in consumer electronics, security systems, and industrial maintenance will propel the Uncooled segment to greater market share.
Thermal Imaging Core Module Product Developments
Recent product developments in thermal imaging core modules are characterized by a relentless pursuit of higher resolution, lower power consumption, and miniaturization. Innovations are focusing on enhancing detector sensitivity and reducing pixel pitch to enable more detailed thermal imagery in smaller form factors. The integration of advanced algorithms for image enhancement and object detection is becoming standard, improving the usability and effectiveness of these modules across diverse applications. Competitive advantages are being forged through the development of highly integrated System-on-Chip (SoC) solutions and advanced packaging techniques that further reduce size and cost.
Key Drivers of Thermal Imaging Core Module Growth
The growth of the thermal imaging core module market is propelled by several key factors. Technological advancements, such as the development of advanced microbolometer technologies and lower-cost manufacturing processes, are expanding accessibility. Economic drivers include increasing investments in infrastructure development, the growing demand for industrial automation and quality control, and the rising need for enhanced security and surveillance systems across both public and private sectors. Regulatory frameworks mandating safety standards in sectors like automotive and construction also contribute significantly to market expansion.
Challenges in the Thermal Imaging Core Module Market
Despite robust growth, the thermal imaging core module market faces several challenges. Regulatory hurdles, particularly concerning export controls for sensitive technologies and evolving product safety standards, can impact market access and development timelines. Supply chain complexities, especially for specialized semiconductor components and raw materials, can lead to production delays and increased costs. Intense competitive pressures from both established players and emerging manufacturers necessitate continuous innovation and cost optimization, creating a challenging environment for achieving significant market share without substantial R&D investment.
Emerging Opportunities in Thermal Imaging Core Module
Emerging opportunities in the thermal imaging core module market lie in the expanding applications within the Internet of Things (IoT), smart cities, and predictive maintenance. Technological breakthroughs in advanced materials and quantum dot detectors promise higher performance and novel functionalities. Strategic partnerships between module manufacturers and end-product developers are accelerating the integration of thermal imaging into consumer electronics, automotive systems, and wearable devices. Market expansion into developing economies, driven by the increasing need for affordable safety and industrial monitoring solutions, presents significant long-term growth potential.
Leading Players in the Thermal Imaging Core Module Sector
- Teledyne FLIR
- Lynred
- Wuhan Guide Infrared Co.,Ltd.
- Zhejiang Dali Technology Co.,Ltd.
- Leonardo DRS
- BAE Systems
- Semi Conductor Devices (SCD)
- L3Harris Technologies
- IRay Technology Co.,Ltd.
- North GuangWei Technology Inc.
- Shenzhen Dianyang Technology Co.,Ltd.
- NEC
- Hamamatsu Photonics
Key Milestones in Thermal Imaging Core Module Industry
- 2019: Introduction of ultra-low power uncooled thermal sensors, enabling wider consumer device integration.
- 2020: Significant advancements in microbolometer resolution exceeding xx pixels, enhancing detail and range.
- 2021: Increased M&A activity focused on consolidating R&D capabilities and market reach.
- 2022: Development of AI-powered thermal imaging analysis platforms for enhanced threat detection.
- 2023: Emergence of new players from the Asia-Pacific region, driving down average selling prices.
- 2024: Enhanced focus on sustainability and reduced environmental impact in manufacturing processes.
Strategic Outlook for Thermal Imaging Core Module Market
The strategic outlook for the thermal imaging core module market is highly positive, driven by sustained demand and continuous innovation. Growth accelerators include the increasing integration of thermal imaging into automotive safety systems, the expansion of smart city initiatives requiring advanced environmental and security monitoring, and the growing adoption in industrial predictive maintenance to prevent costly equipment failures. Further advancements in detector technology and cost reductions will unlock new market segments, particularly in consumer electronics and the broader IoT ecosystem. Strategic opportunities lie in developing specialized modules for niche applications and forging strong partnerships to drive market penetration and technological adoption.
Thermal Imaging Core Module Segmentation
-
1. Application
- 1.1. Civil Use
- 1.2. Military Use
-
2. Types
- 2.1. Uncooled Type
- 2.2. Cooled Type
Thermal Imaging Core Module Segmentation By Geography
-
1. North America
- 1.1. United States
- 1.2. Canada
- 1.3. Mexico
-
2. South America
- 2.1. Brazil
- 2.2. Argentina
- 2.3. Rest of South America
-
3. Europe
- 3.1. United Kingdom
- 3.2. Germany
- 3.3. France
- 3.4. Italy
- 3.5. Spain
- 3.6. Russia
- 3.7. Benelux
- 3.8. Nordics
- 3.9. Rest of Europe
-
4. Middle East & Africa
- 4.1. Turkey
- 4.2. Israel
- 4.3. GCC
- 4.4. North Africa
- 4.5. South Africa
- 4.6. Rest of Middle East & Africa
-
5. Asia Pacific
- 5.1. China
- 5.2. India
- 5.3. Japan
- 5.4. South Korea
- 5.5. ASEAN
- 5.6. Oceania
- 5.7. Rest of Asia Pacific
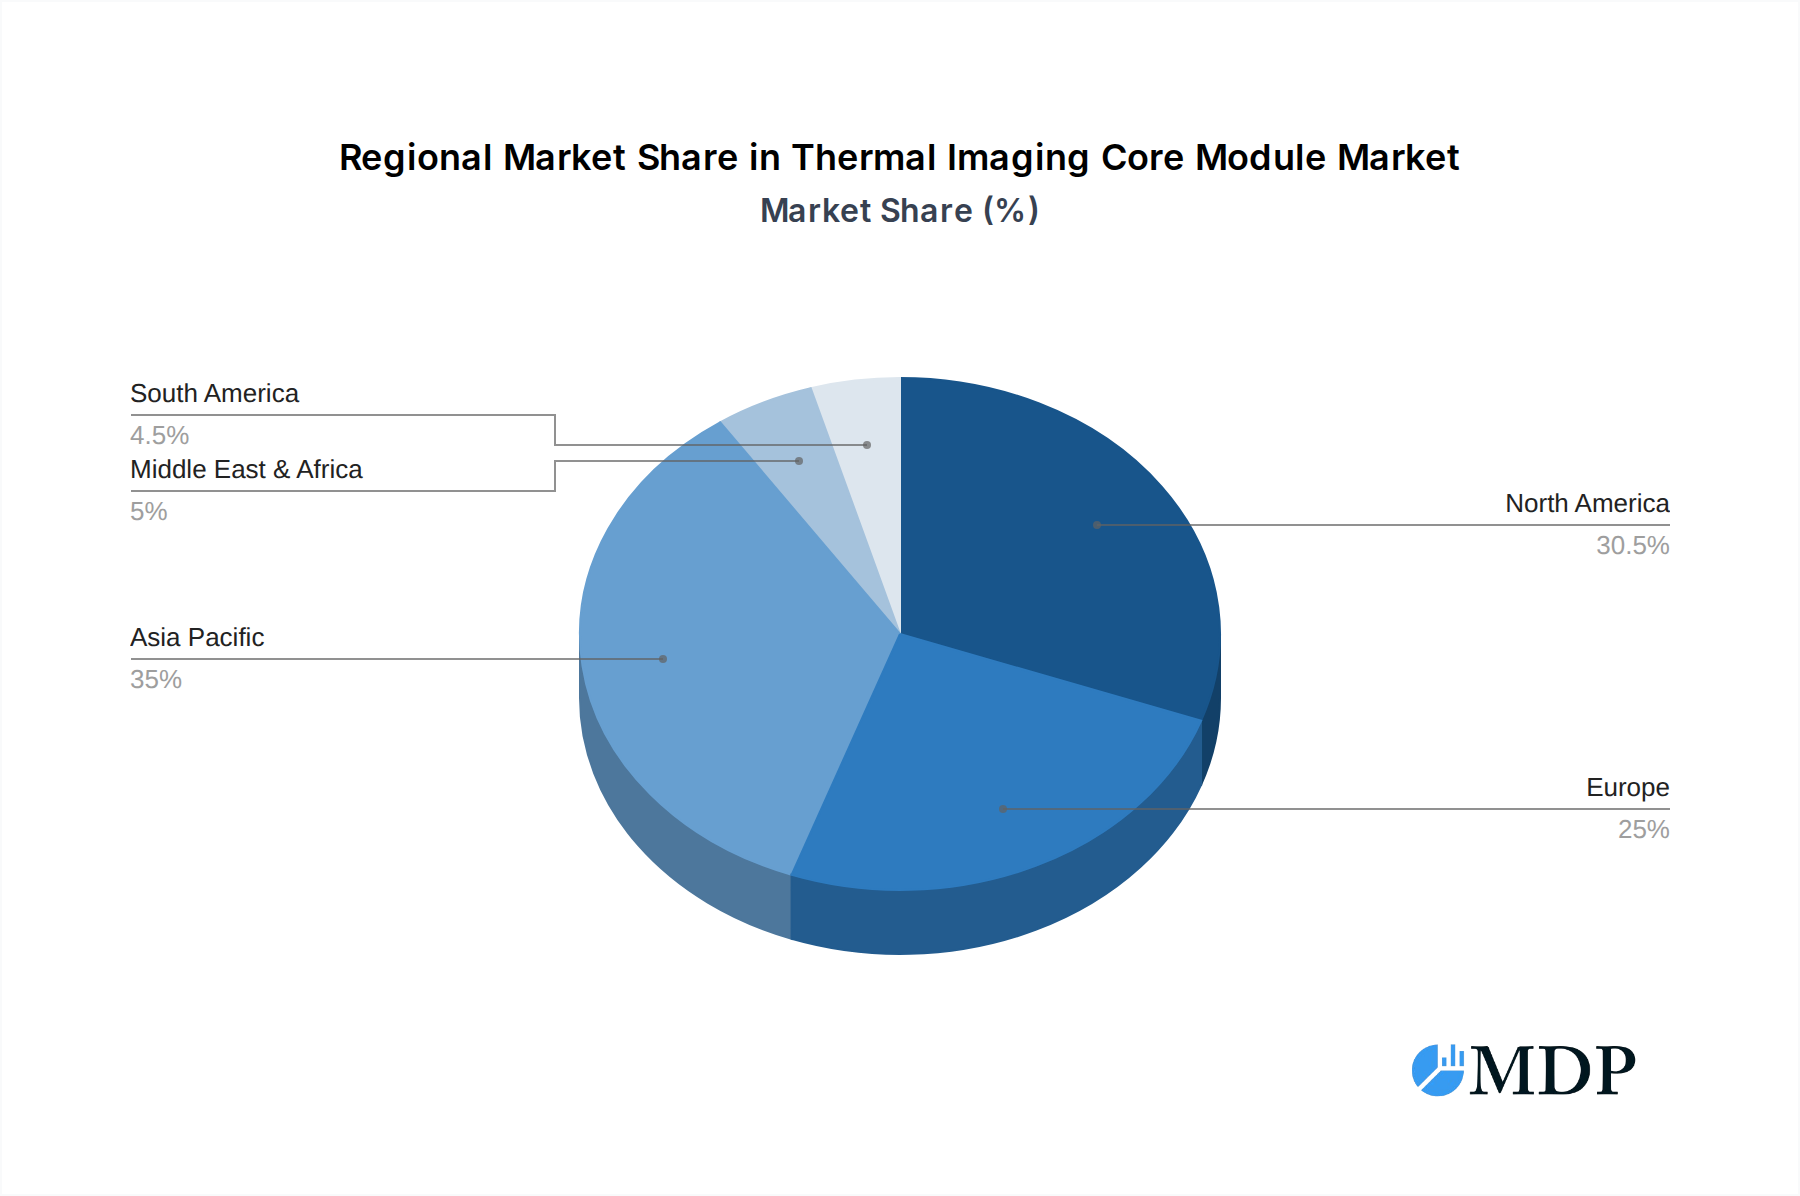
Thermal Imaging Core Module Regional Market Share
Geographic Coverage of Thermal Imaging Core Module
Thermal Imaging Core Module REPORT HIGHLIGHTS
| Aspects | Details |
|---|---|
| Study Period | 2020-2034 |
| Base Year | 2025 |
| Estimated Year | 2026 |
| Forecast Period | 2026-2034 |
| Historical Period | 2020-2025 |
| Growth Rate | CAGR of -0.4% from 2020-2034 |
| Segmentation |
|
Table of Contents
- 1. Introduction
- 1.1. Research Scope
- 1.2. Market Segmentation
- 1.3. Research Methodology
- 1.4. Definitions and Assumptions
- 2. Executive Summary
- 2.1. Introduction
- 3. Market Dynamics
- 3.1. Introduction
- 3.2. Market Drivers
- 3.3. Market Restrains
- 3.4. Market Trends
- 4. Market Factor Analysis
- 4.1. Porters Five Forces
- 4.2. Supply/Value Chain
- 4.3. PESTEL analysis
- 4.4. Market Entropy
- 4.5. Patent/Trademark Analysis
- 5. Global Thermal Imaging Core Module Analysis, Insights and Forecast, 2020-2032
- 5.1. Market Analysis, Insights and Forecast - by Application
- 5.1.1. Civil Use
- 5.1.2. Military Use
- 5.2. Market Analysis, Insights and Forecast - by Types
- 5.2.1. Uncooled Type
- 5.2.2. Cooled Type
- 5.3. Market Analysis, Insights and Forecast - by Region
- 5.3.1. North America
- 5.3.2. South America
- 5.3.3. Europe
- 5.3.4. Middle East & Africa
- 5.3.5. Asia Pacific
- 5.1. Market Analysis, Insights and Forecast - by Application
- 6. North America Thermal Imaging Core Module Analysis, Insights and Forecast, 2020-2032
- 6.1. Market Analysis, Insights and Forecast - by Application
- 6.1.1. Civil Use
- 6.1.2. Military Use
- 6.2. Market Analysis, Insights and Forecast - by Types
- 6.2.1. Uncooled Type
- 6.2.2. Cooled Type
- 6.1. Market Analysis, Insights and Forecast - by Application
- 7. South America Thermal Imaging Core Module Analysis, Insights and Forecast, 2020-2032
- 7.1. Market Analysis, Insights and Forecast - by Application
- 7.1.1. Civil Use
- 7.1.2. Military Use
- 7.2. Market Analysis, Insights and Forecast - by Types
- 7.2.1. Uncooled Type
- 7.2.2. Cooled Type
- 7.1. Market Analysis, Insights and Forecast - by Application
- 8. Europe Thermal Imaging Core Module Analysis, Insights and Forecast, 2020-2032
- 8.1. Market Analysis, Insights and Forecast - by Application
- 8.1.1. Civil Use
- 8.1.2. Military Use
- 8.2. Market Analysis, Insights and Forecast - by Types
- 8.2.1. Uncooled Type
- 8.2.2. Cooled Type
- 8.1. Market Analysis, Insights and Forecast - by Application
- 9. Middle East & Africa Thermal Imaging Core Module Analysis, Insights and Forecast, 2020-2032
- 9.1. Market Analysis, Insights and Forecast - by Application
- 9.1.1. Civil Use
- 9.1.2. Military Use
- 9.2. Market Analysis, Insights and Forecast - by Types
- 9.2.1. Uncooled Type
- 9.2.2. Cooled Type
- 9.1. Market Analysis, Insights and Forecast - by Application
- 10. Asia Pacific Thermal Imaging Core Module Analysis, Insights and Forecast, 2020-2032
- 10.1. Market Analysis, Insights and Forecast - by Application
- 10.1.1. Civil Use
- 10.1.2. Military Use
- 10.2. Market Analysis, Insights and Forecast - by Types
- 10.2.1. Uncooled Type
- 10.2.2. Cooled Type
- 10.1. Market Analysis, Insights and Forecast - by Application
- 11. Competitive Analysis
- 11.1. Global Market Share Analysis 2025
- 11.2. Company Profiles
- 11.2.1 Teledyne FLIR
- 11.2.1.1. Overview
- 11.2.1.2. Products
- 11.2.1.3. SWOT Analysis
- 11.2.1.4. Recent Developments
- 11.2.1.5. Financials (Based on Availability)
- 11.2.2 Lynred
- 11.2.2.1. Overview
- 11.2.2.2. Products
- 11.2.2.3. SWOT Analysis
- 11.2.2.4. Recent Developments
- 11.2.2.5. Financials (Based on Availability)
- 11.2.3 Wuhan Guide Infrared Co.
- 11.2.3.1. Overview
- 11.2.3.2. Products
- 11.2.3.3. SWOT Analysis
- 11.2.3.4. Recent Developments
- 11.2.3.5. Financials (Based on Availability)
- 11.2.4 Ltd.
- 11.2.4.1. Overview
- 11.2.4.2. Products
- 11.2.4.3. SWOT Analysis
- 11.2.4.4. Recent Developments
- 11.2.4.5. Financials (Based on Availability)
- 11.2.5 Zhejiang Dali Technology Co.
- 11.2.5.1. Overview
- 11.2.5.2. Products
- 11.2.5.3. SWOT Analysis
- 11.2.5.4. Recent Developments
- 11.2.5.5. Financials (Based on Availability)
- 11.2.6 Ltd.
- 11.2.6.1. Overview
- 11.2.6.2. Products
- 11.2.6.3. SWOT Analysis
- 11.2.6.4. Recent Developments
- 11.2.6.5. Financials (Based on Availability)
- 11.2.7 Leonardo DRS
- 11.2.7.1. Overview
- 11.2.7.2. Products
- 11.2.7.3. SWOT Analysis
- 11.2.7.4. Recent Developments
- 11.2.7.5. Financials (Based on Availability)
- 11.2.8 BAE Systems
- 11.2.8.1. Overview
- 11.2.8.2. Products
- 11.2.8.3. SWOT Analysis
- 11.2.8.4. Recent Developments
- 11.2.8.5. Financials (Based on Availability)
- 11.2.9 Semi Conductor Devices (SCD)
- 11.2.9.1. Overview
- 11.2.9.2. Products
- 11.2.9.3. SWOT Analysis
- 11.2.9.4. Recent Developments
- 11.2.9.5. Financials (Based on Availability)
- 11.2.10 L3Harris Technologies
- 11.2.10.1. Overview
- 11.2.10.2. Products
- 11.2.10.3. SWOT Analysis
- 11.2.10.4. Recent Developments
- 11.2.10.5. Financials (Based on Availability)
- 11.2.11 IRay Technology Co.
- 11.2.11.1. Overview
- 11.2.11.2. Products
- 11.2.11.3. SWOT Analysis
- 11.2.11.4. Recent Developments
- 11.2.11.5. Financials (Based on Availability)
- 11.2.12 Ltd.
- 11.2.12.1. Overview
- 11.2.12.2. Products
- 11.2.12.3. SWOT Analysis
- 11.2.12.4. Recent Developments
- 11.2.12.5. Financials (Based on Availability)
- 11.2.13 North GuangWei Technology Inc.
- 11.2.13.1. Overview
- 11.2.13.2. Products
- 11.2.13.3. SWOT Analysis
- 11.2.13.4. Recent Developments
- 11.2.13.5. Financials (Based on Availability)
- 11.2.14 Shenzhen Dianyang Technology Co.
- 11.2.14.1. Overview
- 11.2.14.2. Products
- 11.2.14.3. SWOT Analysis
- 11.2.14.4. Recent Developments
- 11.2.14.5. Financials (Based on Availability)
- 11.2.15 Ltd.
- 11.2.15.1. Overview
- 11.2.15.2. Products
- 11.2.15.3. SWOT Analysis
- 11.2.15.4. Recent Developments
- 11.2.15.5. Financials (Based on Availability)
- 11.2.16 NEC
- 11.2.16.1. Overview
- 11.2.16.2. Products
- 11.2.16.3. SWOT Analysis
- 11.2.16.4. Recent Developments
- 11.2.16.5. Financials (Based on Availability)
- 11.2.17 Hamamatsu Photonics
- 11.2.17.1. Overview
- 11.2.17.2. Products
- 11.2.17.3. SWOT Analysis
- 11.2.17.4. Recent Developments
- 11.2.17.5. Financials (Based on Availability)
- 11.2.1 Teledyne FLIR
List of Figures
- Figure 1: Global Thermal Imaging Core Module Revenue Breakdown (million, %) by Region 2025 & 2033
- Figure 2: Global Thermal Imaging Core Module Volume Breakdown (K, %) by Region 2025 & 2033
- Figure 3: North America Thermal Imaging Core Module Revenue (million), by Application 2025 & 2033
- Figure 4: North America Thermal Imaging Core Module Volume (K), by Application 2025 & 2033
- Figure 5: North America Thermal Imaging Core Module Revenue Share (%), by Application 2025 & 2033
- Figure 6: North America Thermal Imaging Core Module Volume Share (%), by Application 2025 & 2033
- Figure 7: North America Thermal Imaging Core Module Revenue (million), by Types 2025 & 2033
- Figure 8: North America Thermal Imaging Core Module Volume (K), by Types 2025 & 2033
- Figure 9: North America Thermal Imaging Core Module Revenue Share (%), by Types 2025 & 2033
- Figure 10: North America Thermal Imaging Core Module Volume Share (%), by Types 2025 & 2033
- Figure 11: North America Thermal Imaging Core Module Revenue (million), by Country 2025 & 2033
- Figure 12: North America Thermal Imaging Core Module Volume (K), by Country 2025 & 2033
- Figure 13: North America Thermal Imaging Core Module Revenue Share (%), by Country 2025 & 2033
- Figure 14: North America Thermal Imaging Core Module Volume Share (%), by Country 2025 & 2033
- Figure 15: South America Thermal Imaging Core Module Revenue (million), by Application 2025 & 2033
- Figure 16: South America Thermal Imaging Core Module Volume (K), by Application 2025 & 2033
- Figure 17: South America Thermal Imaging Core Module Revenue Share (%), by Application 2025 & 2033
- Figure 18: South America Thermal Imaging Core Module Volume Share (%), by Application 2025 & 2033
- Figure 19: South America Thermal Imaging Core Module Revenue (million), by Types 2025 & 2033
- Figure 20: South America Thermal Imaging Core Module Volume (K), by Types 2025 & 2033
- Figure 21: South America Thermal Imaging Core Module Revenue Share (%), by Types 2025 & 2033
- Figure 22: South America Thermal Imaging Core Module Volume Share (%), by Types 2025 & 2033
- Figure 23: South America Thermal Imaging Core Module Revenue (million), by Country 2025 & 2033
- Figure 24: South America Thermal Imaging Core Module Volume (K), by Country 2025 & 2033
- Figure 25: South America Thermal Imaging Core Module Revenue Share (%), by Country 2025 & 2033
- Figure 26: South America Thermal Imaging Core Module Volume Share (%), by Country 2025 & 2033
- Figure 27: Europe Thermal Imaging Core Module Revenue (million), by Application 2025 & 2033
- Figure 28: Europe Thermal Imaging Core Module Volume (K), by Application 2025 & 2033
- Figure 29: Europe Thermal Imaging Core Module Revenue Share (%), by Application 2025 & 2033
- Figure 30: Europe Thermal Imaging Core Module Volume Share (%), by Application 2025 & 2033
- Figure 31: Europe Thermal Imaging Core Module Revenue (million), by Types 2025 & 2033
- Figure 32: Europe Thermal Imaging Core Module Volume (K), by Types 2025 & 2033
- Figure 33: Europe Thermal Imaging Core Module Revenue Share (%), by Types 2025 & 2033
- Figure 34: Europe Thermal Imaging Core Module Volume Share (%), by Types 2025 & 2033
- Figure 35: Europe Thermal Imaging Core Module Revenue (million), by Country 2025 & 2033
- Figure 36: Europe Thermal Imaging Core Module Volume (K), by Country 2025 & 2033
- Figure 37: Europe Thermal Imaging Core Module Revenue Share (%), by Country 2025 & 2033
- Figure 38: Europe Thermal Imaging Core Module Volume Share (%), by Country 2025 & 2033
- Figure 39: Middle East & Africa Thermal Imaging Core Module Revenue (million), by Application 2025 & 2033
- Figure 40: Middle East & Africa Thermal Imaging Core Module Volume (K), by Application 2025 & 2033
- Figure 41: Middle East & Africa Thermal Imaging Core Module Revenue Share (%), by Application 2025 & 2033
- Figure 42: Middle East & Africa Thermal Imaging Core Module Volume Share (%), by Application 2025 & 2033
- Figure 43: Middle East & Africa Thermal Imaging Core Module Revenue (million), by Types 2025 & 2033
- Figure 44: Middle East & Africa Thermal Imaging Core Module Volume (K), by Types 2025 & 2033
- Figure 45: Middle East & Africa Thermal Imaging Core Module Revenue Share (%), by Types 2025 & 2033
- Figure 46: Middle East & Africa Thermal Imaging Core Module Volume Share (%), by Types 2025 & 2033
- Figure 47: Middle East & Africa Thermal Imaging Core Module Revenue (million), by Country 2025 & 2033
- Figure 48: Middle East & Africa Thermal Imaging Core Module Volume (K), by Country 2025 & 2033
- Figure 49: Middle East & Africa Thermal Imaging Core Module Revenue Share (%), by Country 2025 & 2033
- Figure 50: Middle East & Africa Thermal Imaging Core Module Volume Share (%), by Country 2025 & 2033
- Figure 51: Asia Pacific Thermal Imaging Core Module Revenue (million), by Application 2025 & 2033
- Figure 52: Asia Pacific Thermal Imaging Core Module Volume (K), by Application 2025 & 2033
- Figure 53: Asia Pacific Thermal Imaging Core Module Revenue Share (%), by Application 2025 & 2033
- Figure 54: Asia Pacific Thermal Imaging Core Module Volume Share (%), by Application 2025 & 2033
- Figure 55: Asia Pacific Thermal Imaging Core Module Revenue (million), by Types 2025 & 2033
- Figure 56: Asia Pacific Thermal Imaging Core Module Volume (K), by Types 2025 & 2033
- Figure 57: Asia Pacific Thermal Imaging Core Module Revenue Share (%), by Types 2025 & 2033
- Figure 58: Asia Pacific Thermal Imaging Core Module Volume Share (%), by Types 2025 & 2033
- Figure 59: Asia Pacific Thermal Imaging Core Module Revenue (million), by Country 2025 & 2033
- Figure 60: Asia Pacific Thermal Imaging Core Module Volume (K), by Country 2025 & 2033
- Figure 61: Asia Pacific Thermal Imaging Core Module Revenue Share (%), by Country 2025 & 2033
- Figure 62: Asia Pacific Thermal Imaging Core Module Volume Share (%), by Country 2025 & 2033
List of Tables
- Table 1: Global Thermal Imaging Core Module Revenue million Forecast, by Application 2020 & 2033
- Table 2: Global Thermal Imaging Core Module Volume K Forecast, by Application 2020 & 2033
- Table 3: Global Thermal Imaging Core Module Revenue million Forecast, by Types 2020 & 2033
- Table 4: Global Thermal Imaging Core Module Volume K Forecast, by Types 2020 & 2033
- Table 5: Global Thermal Imaging Core Module Revenue million Forecast, by Region 2020 & 2033
- Table 6: Global Thermal Imaging Core Module Volume K Forecast, by Region 2020 & 2033
- Table 7: Global Thermal Imaging Core Module Revenue million Forecast, by Application 2020 & 2033
- Table 8: Global Thermal Imaging Core Module Volume K Forecast, by Application 2020 & 2033
- Table 9: Global Thermal Imaging Core Module Revenue million Forecast, by Types 2020 & 2033
- Table 10: Global Thermal Imaging Core Module Volume K Forecast, by Types 2020 & 2033
- Table 11: Global Thermal Imaging Core Module Revenue million Forecast, by Country 2020 & 2033
- Table 12: Global Thermal Imaging Core Module Volume K Forecast, by Country 2020 & 2033
- Table 13: United States Thermal Imaging Core Module Revenue (million) Forecast, by Application 2020 & 2033
- Table 14: United States Thermal Imaging Core Module Volume (K) Forecast, by Application 2020 & 2033
- Table 15: Canada Thermal Imaging Core Module Revenue (million) Forecast, by Application 2020 & 2033
- Table 16: Canada Thermal Imaging Core Module Volume (K) Forecast, by Application 2020 & 2033
- Table 17: Mexico Thermal Imaging Core Module Revenue (million) Forecast, by Application 2020 & 2033
- Table 18: Mexico Thermal Imaging Core Module Volume (K) Forecast, by Application 2020 & 2033
- Table 19: Global Thermal Imaging Core Module Revenue million Forecast, by Application 2020 & 2033
- Table 20: Global Thermal Imaging Core Module Volume K Forecast, by Application 2020 & 2033
- Table 21: Global Thermal Imaging Core Module Revenue million Forecast, by Types 2020 & 2033
- Table 22: Global Thermal Imaging Core Module Volume K Forecast, by Types 2020 & 2033
- Table 23: Global Thermal Imaging Core Module Revenue million Forecast, by Country 2020 & 2033
- Table 24: Global Thermal Imaging Core Module Volume K Forecast, by Country 2020 & 2033
- Table 25: Brazil Thermal Imaging Core Module Revenue (million) Forecast, by Application 2020 & 2033
- Table 26: Brazil Thermal Imaging Core Module Volume (K) Forecast, by Application 2020 & 2033
- Table 27: Argentina Thermal Imaging Core Module Revenue (million) Forecast, by Application 2020 & 2033
- Table 28: Argentina Thermal Imaging Core Module Volume (K) Forecast, by Application 2020 & 2033
- Table 29: Rest of South America Thermal Imaging Core Module Revenue (million) Forecast, by Application 2020 & 2033
- Table 30: Rest of South America Thermal Imaging Core Module Volume (K) Forecast, by Application 2020 & 2033
- Table 31: Global Thermal Imaging Core Module Revenue million Forecast, by Application 2020 & 2033
- Table 32: Global Thermal Imaging Core Module Volume K Forecast, by Application 2020 & 2033
- Table 33: Global Thermal Imaging Core Module Revenue million Forecast, by Types 2020 & 2033
- Table 34: Global Thermal Imaging Core Module Volume K Forecast, by Types 2020 & 2033
- Table 35: Global Thermal Imaging Core Module Revenue million Forecast, by Country 2020 & 2033
- Table 36: Global Thermal Imaging Core Module Volume K Forecast, by Country 2020 & 2033
- Table 37: United Kingdom Thermal Imaging Core Module Revenue (million) Forecast, by Application 2020 & 2033
- Table 38: United Kingdom Thermal Imaging Core Module Volume (K) Forecast, by Application 2020 & 2033
- Table 39: Germany Thermal Imaging Core Module Revenue (million) Forecast, by Application 2020 & 2033
- Table 40: Germany Thermal Imaging Core Module Volume (K) Forecast, by Application 2020 & 2033
- Table 41: France Thermal Imaging Core Module Revenue (million) Forecast, by Application 2020 & 2033
- Table 42: France Thermal Imaging Core Module Volume (K) Forecast, by Application 2020 & 2033
- Table 43: Italy Thermal Imaging Core Module Revenue (million) Forecast, by Application 2020 & 2033
- Table 44: Italy Thermal Imaging Core Module Volume (K) Forecast, by Application 2020 & 2033
- Table 45: Spain Thermal Imaging Core Module Revenue (million) Forecast, by Application 2020 & 2033
- Table 46: Spain Thermal Imaging Core Module Volume (K) Forecast, by Application 2020 & 2033
- Table 47: Russia Thermal Imaging Core Module Revenue (million) Forecast, by Application 2020 & 2033
- Table 48: Russia Thermal Imaging Core Module Volume (K) Forecast, by Application 2020 & 2033
- Table 49: Benelux Thermal Imaging Core Module Revenue (million) Forecast, by Application 2020 & 2033
- Table 50: Benelux Thermal Imaging Core Module Volume (K) Forecast, by Application 2020 & 2033
- Table 51: Nordics Thermal Imaging Core Module Revenue (million) Forecast, by Application 2020 & 2033
- Table 52: Nordics Thermal Imaging Core Module Volume (K) Forecast, by Application 2020 & 2033
- Table 53: Rest of Europe Thermal Imaging Core Module Revenue (million) Forecast, by Application 2020 & 2033
- Table 54: Rest of Europe Thermal Imaging Core Module Volume (K) Forecast, by Application 2020 & 2033
- Table 55: Global Thermal Imaging Core Module Revenue million Forecast, by Application 2020 & 2033
- Table 56: Global Thermal Imaging Core Module Volume K Forecast, by Application 2020 & 2033
- Table 57: Global Thermal Imaging Core Module Revenue million Forecast, by Types 2020 & 2033
- Table 58: Global Thermal Imaging Core Module Volume K Forecast, by Types 2020 & 2033
- Table 59: Global Thermal Imaging Core Module Revenue million Forecast, by Country 2020 & 2033
- Table 60: Global Thermal Imaging Core Module Volume K Forecast, by Country 2020 & 2033
- Table 61: Turkey Thermal Imaging Core Module Revenue (million) Forecast, by Application 2020 & 2033
- Table 62: Turkey Thermal Imaging Core Module Volume (K) Forecast, by Application 2020 & 2033
- Table 63: Israel Thermal Imaging Core Module Revenue (million) Forecast, by Application 2020 & 2033
- Table 64: Israel Thermal Imaging Core Module Volume (K) Forecast, by Application 2020 & 2033
- Table 65: GCC Thermal Imaging Core Module Revenue (million) Forecast, by Application 2020 & 2033
- Table 66: GCC Thermal Imaging Core Module Volume (K) Forecast, by Application 2020 & 2033
- Table 67: North Africa Thermal Imaging Core Module Revenue (million) Forecast, by Application 2020 & 2033
- Table 68: North Africa Thermal Imaging Core Module Volume (K) Forecast, by Application 2020 & 2033
- Table 69: South Africa Thermal Imaging Core Module Revenue (million) Forecast, by Application 2020 & 2033
- Table 70: South Africa Thermal Imaging Core Module Volume (K) Forecast, by Application 2020 & 2033
- Table 71: Rest of Middle East & Africa Thermal Imaging Core Module Revenue (million) Forecast, by Application 2020 & 2033
- Table 72: Rest of Middle East & Africa Thermal Imaging Core Module Volume (K) Forecast, by Application 2020 & 2033
- Table 73: Global Thermal Imaging Core Module Revenue million Forecast, by Application 2020 & 2033
- Table 74: Global Thermal Imaging Core Module Volume K Forecast, by Application 2020 & 2033
- Table 75: Global Thermal Imaging Core Module Revenue million Forecast, by Types 2020 & 2033
- Table 76: Global Thermal Imaging Core Module Volume K Forecast, by Types 2020 & 2033
- Table 77: Global Thermal Imaging Core Module Revenue million Forecast, by Country 2020 & 2033
- Table 78: Global Thermal Imaging Core Module Volume K Forecast, by Country 2020 & 2033
- Table 79: China Thermal Imaging Core Module Revenue (million) Forecast, by Application 2020 & 2033
- Table 80: China Thermal Imaging Core Module Volume (K) Forecast, by Application 2020 & 2033
- Table 81: India Thermal Imaging Core Module Revenue (million) Forecast, by Application 2020 & 2033
- Table 82: India Thermal Imaging Core Module Volume (K) Forecast, by Application 2020 & 2033
- Table 83: Japan Thermal Imaging Core Module Revenue (million) Forecast, by Application 2020 & 2033
- Table 84: Japan Thermal Imaging Core Module Volume (K) Forecast, by Application 2020 & 2033
- Table 85: South Korea Thermal Imaging Core Module Revenue (million) Forecast, by Application 2020 & 2033
- Table 86: South Korea Thermal Imaging Core Module Volume (K) Forecast, by Application 2020 & 2033
- Table 87: ASEAN Thermal Imaging Core Module Revenue (million) Forecast, by Application 2020 & 2033
- Table 88: ASEAN Thermal Imaging Core Module Volume (K) Forecast, by Application 2020 & 2033
- Table 89: Oceania Thermal Imaging Core Module Revenue (million) Forecast, by Application 2020 & 2033
- Table 90: Oceania Thermal Imaging Core Module Volume (K) Forecast, by Application 2020 & 2033
- Table 91: Rest of Asia Pacific Thermal Imaging Core Module Revenue (million) Forecast, by Application 2020 & 2033
- Table 92: Rest of Asia Pacific Thermal Imaging Core Module Volume (K) Forecast, by Application 2020 & 2033
Frequently Asked Questions
1. What is the projected Compound Annual Growth Rate (CAGR) of the Thermal Imaging Core Module?
The projected CAGR is approximately -0.4%.
2. Which companies are prominent players in the Thermal Imaging Core Module?
Key companies in the market include Teledyne FLIR, Lynred, Wuhan Guide Infrared Co., Ltd., Zhejiang Dali Technology Co., Ltd., Leonardo DRS, BAE Systems, Semi Conductor Devices (SCD), L3Harris Technologies, IRay Technology Co., Ltd., North GuangWei Technology Inc., Shenzhen Dianyang Technology Co., Ltd., NEC, Hamamatsu Photonics.
3. What are the main segments of the Thermal Imaging Core Module?
The market segments include Application, Types.
4. Can you provide details about the market size?
The market size is estimated to be USD 2142.7 million as of 2022.
5. What are some drivers contributing to market growth?
N/A
6. What are the notable trends driving market growth?
N/A
7. Are there any restraints impacting market growth?
N/A
8. Can you provide examples of recent developments in the market?
N/A
9. What pricing options are available for accessing the report?
Pricing options include single-user, multi-user, and enterprise licenses priced at USD 3350.00, USD 5025.00, and USD 6700.00 respectively.
10. Is the market size provided in terms of value or volume?
The market size is provided in terms of value, measured in million and volume, measured in K.
11. Are there any specific market keywords associated with the report?
Yes, the market keyword associated with the report is "Thermal Imaging Core Module," which aids in identifying and referencing the specific market segment covered.
12. How do I determine which pricing option suits my needs best?
The pricing options vary based on user requirements and access needs. Individual users may opt for single-user licenses, while businesses requiring broader access may choose multi-user or enterprise licenses for cost-effective access to the report.
13. Are there any additional resources or data provided in the Thermal Imaging Core Module report?
While the report offers comprehensive insights, it's advisable to review the specific contents or supplementary materials provided to ascertain if additional resources or data are available.
14. How can I stay updated on further developments or reports in the Thermal Imaging Core Module?
To stay informed about further developments, trends, and reports in the Thermal Imaging Core Module, consider subscribing to industry newsletters, following relevant companies and organizations, or regularly checking reputable industry news sources and publications.
Methodology
Step 1 - Identification of Relevant Samples Size from Population Database


Step 2 - Approaches for Defining Global Market Size (Value, Volume* & Price*)

Note*: In applicable scenarios
Step 3 - Data Sources
Primary Research
- Web Analytics
- Survey Reports
- Research Institute
- Latest Research Reports
- Opinion Leaders
Secondary Research
- Annual Reports
- White Paper
- Latest Press Release
- Industry Association
- Paid Database
- Investor Presentations

Step 4 - Data Triangulation
Involves using different sources of information in order to increase the validity of a study
These sources are likely to be stakeholders in a program - participants, other researchers, program staff, other community members, and so on.
Then we put all data in single framework & apply various statistical tools to find out the dynamic on the market.
During the analysis stage, feedback from the stakeholder groups would be compared to determine areas of agreement as well as areas of divergence