

Key Insights
The global synthetic artificial blood vessels market is projected for significant expansion, driven by the escalating prevalence of cardiovascular diseases, breakthroughs in biomaterial science enhancing graft durability and biocompatibility, and a growing preference for minimally invasive surgical techniques. The market's growth is further supported by the inherent limitations of autologous vein grafts, including insufficient length or quality for intricate vascular reconstructions. While challenges such as thrombosis and infection persist, dedicated research and development are actively pursuing innovative materials and surface modifications to mitigate these risks. The market is segmented by material type (e.g., polyurethane, PTFE, Dacron), application (e.g., coronary artery bypass grafting, peripheral artery bypass grafting, arteriovenous fistula creation), and end-user (e.g., hospitals, clinics). Leading industry players, including Getinge, BD (Bard), Terumo, and W.L. Gore, are at the forefront of developing and commercializing advanced synthetic grafts, stimulating innovation and competition. The market is estimated to grow at a Compound Annual Growth Rate (CAGR) of 4.4%, reaching a market size of 292.7 million in the base year 2024.
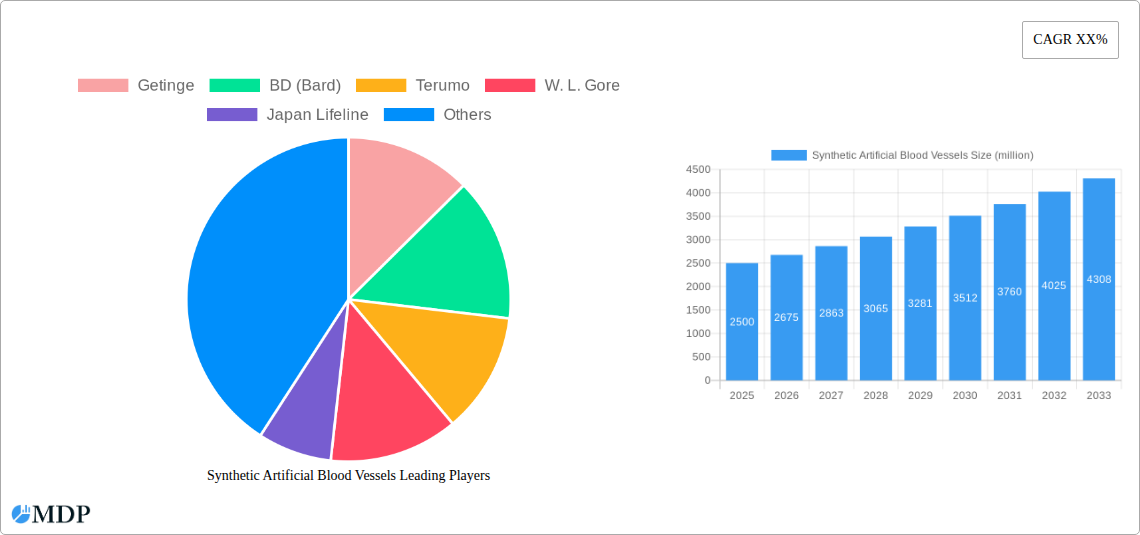
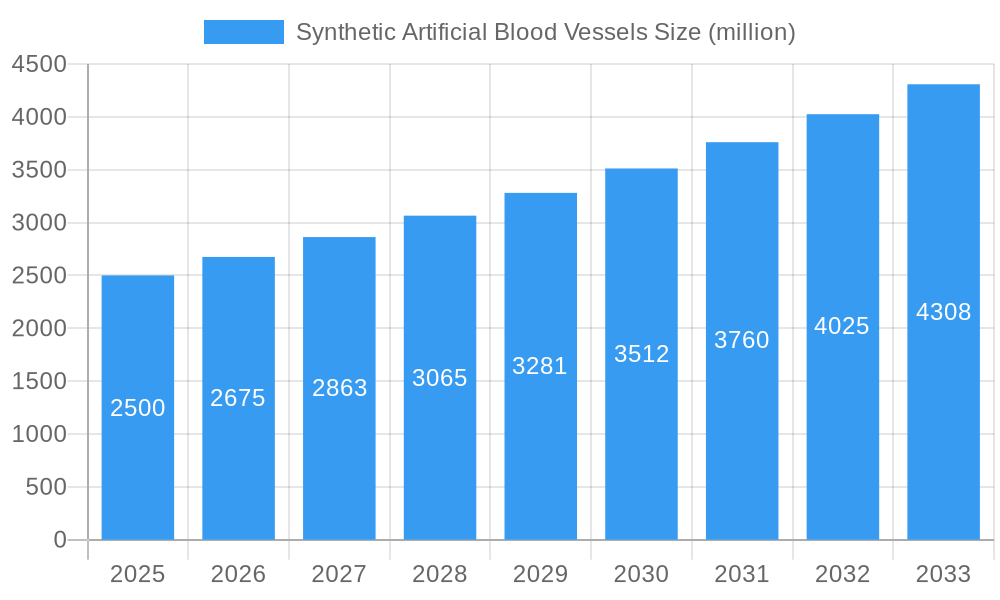
Synthetic Artificial Blood Vessels Market Size (In Million)
The competitive environment features a dynamic interplay between established corporations and agile startups, all striving for market dominance through technological innovation and strategic alliances. Geographic market distribution is shaped by healthcare infrastructure development, the incidence of cardiovascular conditions, and regulatory landscapes. North America and Europe currently lead market share, with emerging economies in Asia-Pacific and Latin America poised for substantial growth, propelled by increased healthcare investments and heightened awareness of cardiovascular health. Continuous advancements in graft longevity, complication reduction, and broader access to sophisticated surgical methodologies will be crucial for sustained market success. Future expansion will hinge on the adoption of novel materials, refined manufacturing processes, and demonstrable positive clinical outcomes.
Synthetic Artificial Blood Vessels Company Market Share
Synthetic Artificial Blood Vessels Market Report: 2019-2033
This comprehensive report provides an in-depth analysis of the global synthetic artificial blood vessels market, offering valuable insights for stakeholders across the medical device industry. From market dynamics and competitive landscapes to technological advancements and future growth projections, this report equips you with the knowledge needed to navigate this rapidly evolving sector. The study period covers 2019-2033, with 2025 serving as the base and estimated year. The forecast period spans 2025-2033, and the historical period encompasses 2019-2024. The market is expected to reach xx million by 2033, exhibiting a CAGR of xx% during the forecast period.
Synthetic Artificial Blood Vessels Market Dynamics & Concentration
The global synthetic artificial blood vessels market exhibits a moderately concentrated landscape, with key players such as Getinge, BD (Bard), Terumo, W. L. Gore, Japan Lifeline, B. Braun, LeMaitre Vascular, Suokang, and Chest Medical vying for market share. Market concentration is influenced by factors including stringent regulatory approvals, high capital investment requirements for R&D, and the specialized nature of the technology. The market share of the top five players is estimated at xx%. Innovation drivers such as advancements in biomaterials, minimally invasive surgical techniques, and the increasing prevalence of cardiovascular diseases are pushing market expansion. Regulatory frameworks, while stringent, are evolving to facilitate innovation and faster product approvals. Product substitutes, such as autologous vein grafts, pose a significant challenge, although synthetic vessels offer advantages in terms of availability and reduced surgical complexity. End-user trends are shifting towards minimally invasive procedures and personalized medicine, driving demand for smaller-diameter and more biocompatible synthetic vessels. M&A activity within the sector has been moderate, with approximately xx deals recorded between 2019 and 2024, primarily focusing on expanding product portfolios and geographical reach.
- Market Share: Top 5 players: xx%
- M&A Deals (2019-2024): xx
Synthetic Artificial Blood Vessels Industry Trends & Analysis
The synthetic artificial blood vessels market is experiencing robust growth, propelled by a confluence of factors. The rising prevalence of cardiovascular diseases globally, coupled with an aging population, constitutes a major driver. Technological advancements, particularly in biomaterial science and manufacturing processes, are enabling the development of more biocompatible and durable synthetic vessels. Consumer preferences are increasingly leaning towards minimally invasive procedures, reducing recovery times and improving patient outcomes. This trend is further amplified by the rising adoption of advanced imaging techniques facilitating precise implantation. Competitive dynamics are characterized by ongoing R&D efforts, strategic partnerships, and a focus on developing innovative products with superior performance characteristics. The market is witnessing significant growth, with a projected CAGR of xx% during the forecast period. Market penetration remains relatively low compared to the total addressable market, indicating significant untapped potential.
Leading Markets & Segments in Synthetic Artificial Blood Vessels
North America currently dominates the synthetic artificial blood vessels market, driven by factors such as high healthcare expenditure, advanced healthcare infrastructure, and a robust regulatory environment. The region's high prevalence of cardiovascular diseases and increased adoption of minimally invasive surgical techniques further contribute to its market leadership. Europe holds the second largest market share, exhibiting steady growth fueled by an aging population and increasing investments in healthcare infrastructure. Asia-Pacific is experiencing rapid growth due to rising healthcare awareness, increasing disposable incomes, and burgeoning medical tourism.
- North America:
- Advanced healthcare infrastructure
- High healthcare expenditure
- High prevalence of cardiovascular diseases
- Europe:
- Aging population
- Increasing healthcare investments
- Asia-Pacific:
- Rising healthcare awareness
- Increasing disposable incomes
- Expanding medical tourism
Synthetic Artificial Blood Vessels Product Developments
Recent advancements in synthetic artificial blood vessels include the development of biocompatible polymers, improved surface modifications to reduce thrombogenicity, and the incorporation of drug-eluting properties to enhance long-term patency. These innovations are enabling the creation of smaller-diameter vessels suitable for peripheral vascular applications and improving the overall clinical outcomes. The market is witnessing a shift towards personalized medicine, with the development of customized vascular grafts tailored to individual patient needs. This addresses limitations of off-the-shelf products.
Key Drivers of Synthetic Artificial Blood Vessels Growth
Several key factors are driving the growth of the synthetic artificial blood vessels market. The surging prevalence of cardiovascular diseases globally is a primary driver, necessitating an increased demand for vascular grafts. Technological advancements in biomaterials science have led to the creation of more durable and biocompatible grafts, improving clinical outcomes and patient satisfaction. Favorable regulatory landscapes in key markets are expediting product approvals and facilitating market entry for innovative products. Furthermore, increasing healthcare expenditure and investments in healthcare infrastructure are supporting market expansion.
Challenges in the Synthetic Artificial Blood Vessels Market
Despite significant market growth potential, several challenges exist. Stringent regulatory requirements and lengthy approval processes pose significant hurdles for new entrants. The high cost of developing and manufacturing advanced synthetic vessels can impact market accessibility. Supply chain disruptions and fluctuations in raw material costs can affect product pricing and availability. Intense competition from established players and the presence of alternative treatment options (e.g., autologous vein grafts) further complicates market dynamics. The overall impact of these factors is estimated to restrain market growth by xx% during the forecast period.
Emerging Opportunities in Synthetic Artificial Blood Vessels
The future of the synthetic artificial blood vessels market is bright, with several emerging opportunities. Advances in tissue engineering and regenerative medicine offer the potential to create even more biocompatible and functional grafts. Strategic collaborations between medical device companies and research institutions can accelerate innovation and bring new products to market more quickly. Expanding into emerging markets with high unmet needs and untapped potential presents significant growth opportunities. The development of next-generation biomaterials with enhanced properties and improved manufacturing processes will further enhance market prospects.
Leading Players in the Synthetic Artificial Blood Vessels Sector
- Getinge
- BD (Bard)
- Terumo
- W. L. Gore
- Japan Lifeline
- B. Braun
- LeMaitre Vascular
- Suokang
- Chest Medical
Key Milestones in Synthetic Artificial Blood Vessels Industry
- 2020: FDA approval of a new generation of biocompatible synthetic vascular graft by Company X.
- 2022: Launch of a novel drug-eluting stent by Company Y, improving graft patency.
- 2023: Acquisition of Company Z by a major medical device company, strengthening market consolidation.
- 2024: Successful completion of a large-scale clinical trial demonstrating superior efficacy of a new synthetic blood vessel.
Strategic Outlook for Synthetic Artificial Blood Vessels Market
The synthetic artificial blood vessels market is poised for sustained growth, driven by technological innovation and a growing global need for effective vascular grafts. Strategic partnerships, focusing on research and development, are becoming increasingly crucial. Companies focusing on personalized medicine and minimally invasive solutions are well-positioned to capture a significant market share. Expanding into emerging markets and developing tailored products for specific patient populations will further drive market expansion. The long-term outlook remains positive, with potential for significant market growth over the next decade.
Synthetic Artificial Blood Vessels Segmentation
-
1. Application
- 1.1. Aortic Disease
- 1.2. Peripheral Artery Disease
- 1.3. Hemodialysis
-
2. Types
- 2.1. EPTFE
- 2.2. Polyethylene Terephthalate
- 2.3. Polyurethane
- 2.4. Others
Synthetic Artificial Blood Vessels Segmentation By Geography
-
1. North America
- 1.1. United States
- 1.2. Canada
- 1.3. Mexico
-
2. South America
- 2.1. Brazil
- 2.2. Argentina
- 2.3. Rest of South America
-
3. Europe
- 3.1. United Kingdom
- 3.2. Germany
- 3.3. France
- 3.4. Italy
- 3.5. Spain
- 3.6. Russia
- 3.7. Benelux
- 3.8. Nordics
- 3.9. Rest of Europe
-
4. Middle East & Africa
- 4.1. Turkey
- 4.2. Israel
- 4.3. GCC
- 4.4. North Africa
- 4.5. South Africa
- 4.6. Rest of Middle East & Africa
-
5. Asia Pacific
- 5.1. China
- 5.2. India
- 5.3. Japan
- 5.4. South Korea
- 5.5. ASEAN
- 5.6. Oceania
- 5.7. Rest of Asia Pacific
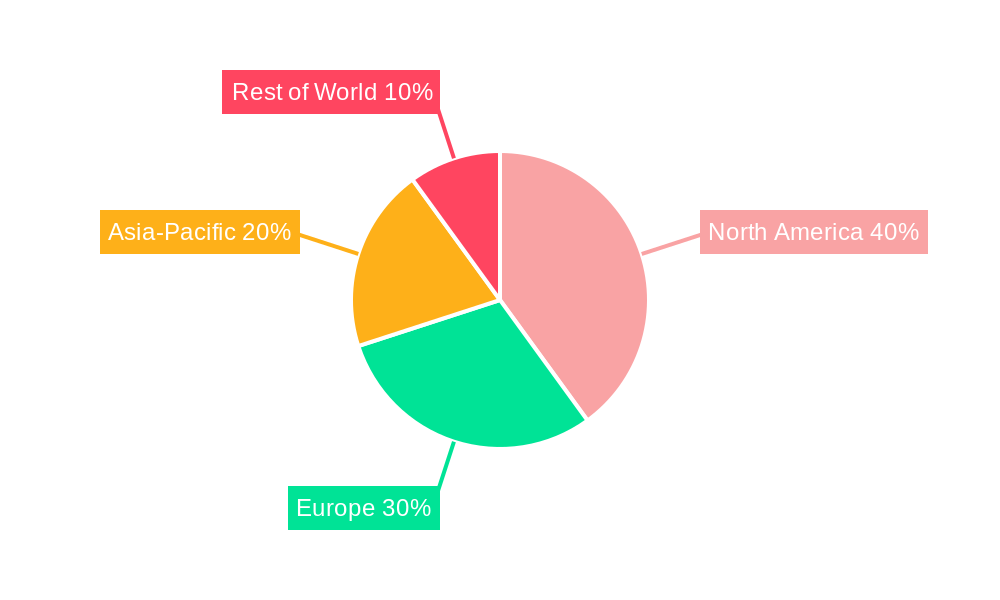
Synthetic Artificial Blood Vessels Regional Market Share
Geographic Coverage of Synthetic Artificial Blood Vessels
Synthetic Artificial Blood Vessels REPORT HIGHLIGHTS
| Aspects | Details |
|---|---|
| Study Period | 2020-2034 |
| Base Year | 2025 |
| Estimated Year | 2026 |
| Forecast Period | 2026-2034 |
| Historical Period | 2020-2025 |
| Growth Rate | CAGR of 4.4% from 2020-2034 |
| Segmentation |
|
Table of Contents
- 1. Introduction
- 1.1. Research Scope
- 1.2. Market Segmentation
- 1.3. Research Objective
- 1.4. Definitions and Assumptions
- 2. Executive Summary
- 2.1. Market Snapshot
- 3. Market Dynamics
- 3.1. Market Drivers
- 3.2. Market Restrains
- 3.3. Market Trends
- 3.4. Market Opportunities
- 4. Market Factor Analysis
- 4.1. Porters Five Forces
- 4.1.1. Bargaining Power of Suppliers
- 4.1.2. Bargaining Power of Buyers
- 4.1.3. Threat of New Entrants
- 4.1.4. Threat of Substitutes
- 4.1.5. Competitive Rivalry
- 4.2. PESTEL analysis
- 4.3. BCG Analysis
- 4.3.1. Stars (High Growth, High Market Share)
- 4.3.2. Cash Cows (Low Growth, High Market Share)
- 4.3.3. Question Mark (High Growth, Low Market Share)
- 4.3.4. Dogs (Low Growth, Low Market Share)
- 4.4. Ansoff Matrix Analysis
- 4.5. Supply Chain Analysis
- 4.6. Regulatory Landscape
- 4.7. Current Market Potential and Opportunity Assessment (TAM–SAM–SOM Framework)
- 4.8. MDP Analyst Note
- 4.1. Porters Five Forces
- 5. Market Analysis, Insights and Forecast 2021-2033
- 5.1. Market Analysis, Insights and Forecast - by Application
- 5.1.1. Aortic Disease
- 5.1.2. Peripheral Artery Disease
- 5.1.3. Hemodialysis
- 5.2. Market Analysis, Insights and Forecast - by Types
- 5.2.1. EPTFE
- 5.2.2. Polyethylene Terephthalate
- 5.2.3. Polyurethane
- 5.2.4. Others
- 5.3. Market Analysis, Insights and Forecast - by Region
- 5.3.1. North America
- 5.3.2. South America
- 5.3.3. Europe
- 5.3.4. Middle East & Africa
- 5.3.5. Asia Pacific
- 5.1. Market Analysis, Insights and Forecast - by Application
- 6. Global Synthetic Artificial Blood Vessels Analysis, Insights and Forecast, 2021-2033
- 6.1. Market Analysis, Insights and Forecast - by Application
- 6.1.1. Aortic Disease
- 6.1.2. Peripheral Artery Disease
- 6.1.3. Hemodialysis
- 6.2. Market Analysis, Insights and Forecast - by Types
- 6.2.1. EPTFE
- 6.2.2. Polyethylene Terephthalate
- 6.2.3. Polyurethane
- 6.2.4. Others
- 6.1. Market Analysis, Insights and Forecast - by Application
- 7. North America Synthetic Artificial Blood Vessels Analysis, Insights and Forecast, 2020-2032
- 7.1. Market Analysis, Insights and Forecast - by Application
- 7.1.1. Aortic Disease
- 7.1.2. Peripheral Artery Disease
- 7.1.3. Hemodialysis
- 7.2. Market Analysis, Insights and Forecast - by Types
- 7.2.1. EPTFE
- 7.2.2. Polyethylene Terephthalate
- 7.2.3. Polyurethane
- 7.2.4. Others
- 7.1. Market Analysis, Insights and Forecast - by Application
- 8. South America Synthetic Artificial Blood Vessels Analysis, Insights and Forecast, 2020-2032
- 8.1. Market Analysis, Insights and Forecast - by Application
- 8.1.1. Aortic Disease
- 8.1.2. Peripheral Artery Disease
- 8.1.3. Hemodialysis
- 8.2. Market Analysis, Insights and Forecast - by Types
- 8.2.1. EPTFE
- 8.2.2. Polyethylene Terephthalate
- 8.2.3. Polyurethane
- 8.2.4. Others
- 8.1. Market Analysis, Insights and Forecast - by Application
- 9. Europe Synthetic Artificial Blood Vessels Analysis, Insights and Forecast, 2020-2032
- 9.1. Market Analysis, Insights and Forecast - by Application
- 9.1.1. Aortic Disease
- 9.1.2. Peripheral Artery Disease
- 9.1.3. Hemodialysis
- 9.2. Market Analysis, Insights and Forecast - by Types
- 9.2.1. EPTFE
- 9.2.2. Polyethylene Terephthalate
- 9.2.3. Polyurethane
- 9.2.4. Others
- 9.1. Market Analysis, Insights and Forecast - by Application
- 10. Middle East & Africa Synthetic Artificial Blood Vessels Analysis, Insights and Forecast, 2020-2032
- 10.1. Market Analysis, Insights and Forecast - by Application
- 10.1.1. Aortic Disease
- 10.1.2. Peripheral Artery Disease
- 10.1.3. Hemodialysis
- 10.2. Market Analysis, Insights and Forecast - by Types
- 10.2.1. EPTFE
- 10.2.2. Polyethylene Terephthalate
- 10.2.3. Polyurethane
- 10.2.4. Others
- 10.1. Market Analysis, Insights and Forecast - by Application
- 11. Asia Pacific Synthetic Artificial Blood Vessels Analysis, Insights and Forecast, 2020-2032
- 11.1. Market Analysis, Insights and Forecast - by Application
- 11.1.1. Aortic Disease
- 11.1.2. Peripheral Artery Disease
- 11.1.3. Hemodialysis
- 11.2. Market Analysis, Insights and Forecast - by Types
- 11.2.1. EPTFE
- 11.2.2. Polyethylene Terephthalate
- 11.2.3. Polyurethane
- 11.2.4. Others
- 11.1. Market Analysis, Insights and Forecast - by Application
- 12. Competitive Analysis
- 12.1. Company Profiles
- 12.1.1 Getinge
- 12.1.1.1. Company Overview
- 12.1.1.2. Products
- 12.1.1.3. Company Financials
- 12.1.1.4. SWOT Analysis
- 12.1.2 BD (Bard)
- 12.1.2.1. Company Overview
- 12.1.2.2. Products
- 12.1.2.3. Company Financials
- 12.1.2.4. SWOT Analysis
- 12.1.3 Terumo
- 12.1.3.1. Company Overview
- 12.1.3.2. Products
- 12.1.3.3. Company Financials
- 12.1.3.4. SWOT Analysis
- 12.1.4 W. L. Gore
- 12.1.4.1. Company Overview
- 12.1.4.2. Products
- 12.1.4.3. Company Financials
- 12.1.4.4. SWOT Analysis
- 12.1.5 Japan Lifeline
- 12.1.5.1. Company Overview
- 12.1.5.2. Products
- 12.1.5.3. Company Financials
- 12.1.5.4. SWOT Analysis
- 12.1.6 B.Braun
- 12.1.6.1. Company Overview
- 12.1.6.2. Products
- 12.1.6.3. Company Financials
- 12.1.6.4. SWOT Analysis
- 12.1.7 LeMaitre Vascular
- 12.1.7.1. Company Overview
- 12.1.7.2. Products
- 12.1.7.3. Company Financials
- 12.1.7.4. SWOT Analysis
- 12.1.8 Suokang
- 12.1.8.1. Company Overview
- 12.1.8.2. Products
- 12.1.8.3. Company Financials
- 12.1.8.4. SWOT Analysis
- 12.1.9 Chest Medical
- 12.1.9.1. Company Overview
- 12.1.9.2. Products
- 12.1.9.3. Company Financials
- 12.1.9.4. SWOT Analysis
- 12.1.1 Getinge
- 12.2. Market Entropy
- 12.2.1 Company's Key Areas Served
- 12.2.2 Recent Developments
- 12.3. Company Market Share Analysis 2025
- 12.3.1 Top 5 Companies Market Share Analysis
- 12.3.2 Top 3 Companies Market Share Analysis
- 12.4. List of Potential Customers
- 13. Research Methodology
List of Figures
- Figure 1: Global Synthetic Artificial Blood Vessels Revenue Breakdown (million, %) by Region 2025 & 2033
- Figure 2: Global Synthetic Artificial Blood Vessels Volume Breakdown (K, %) by Region 2025 & 2033
- Figure 3: North America Synthetic Artificial Blood Vessels Revenue (million), by Application 2025 & 2033
- Figure 4: North America Synthetic Artificial Blood Vessels Volume (K), by Application 2025 & 2033
- Figure 5: North America Synthetic Artificial Blood Vessels Revenue Share (%), by Application 2025 & 2033
- Figure 6: North America Synthetic Artificial Blood Vessels Volume Share (%), by Application 2025 & 2033
- Figure 7: North America Synthetic Artificial Blood Vessels Revenue (million), by Types 2025 & 2033
- Figure 8: North America Synthetic Artificial Blood Vessels Volume (K), by Types 2025 & 2033
- Figure 9: North America Synthetic Artificial Blood Vessels Revenue Share (%), by Types 2025 & 2033
- Figure 10: North America Synthetic Artificial Blood Vessels Volume Share (%), by Types 2025 & 2033
- Figure 11: North America Synthetic Artificial Blood Vessels Revenue (million), by Country 2025 & 2033
- Figure 12: North America Synthetic Artificial Blood Vessels Volume (K), by Country 2025 & 2033
- Figure 13: North America Synthetic Artificial Blood Vessels Revenue Share (%), by Country 2025 & 2033
- Figure 14: North America Synthetic Artificial Blood Vessels Volume Share (%), by Country 2025 & 2033
- Figure 15: South America Synthetic Artificial Blood Vessels Revenue (million), by Application 2025 & 2033
- Figure 16: South America Synthetic Artificial Blood Vessels Volume (K), by Application 2025 & 2033
- Figure 17: South America Synthetic Artificial Blood Vessels Revenue Share (%), by Application 2025 & 2033
- Figure 18: South America Synthetic Artificial Blood Vessels Volume Share (%), by Application 2025 & 2033
- Figure 19: South America Synthetic Artificial Blood Vessels Revenue (million), by Types 2025 & 2033
- Figure 20: South America Synthetic Artificial Blood Vessels Volume (K), by Types 2025 & 2033
- Figure 21: South America Synthetic Artificial Blood Vessels Revenue Share (%), by Types 2025 & 2033
- Figure 22: South America Synthetic Artificial Blood Vessels Volume Share (%), by Types 2025 & 2033
- Figure 23: South America Synthetic Artificial Blood Vessels Revenue (million), by Country 2025 & 2033
- Figure 24: South America Synthetic Artificial Blood Vessels Volume (K), by Country 2025 & 2033
- Figure 25: South America Synthetic Artificial Blood Vessels Revenue Share (%), by Country 2025 & 2033
- Figure 26: South America Synthetic Artificial Blood Vessels Volume Share (%), by Country 2025 & 2033
- Figure 27: Europe Synthetic Artificial Blood Vessels Revenue (million), by Application 2025 & 2033
- Figure 28: Europe Synthetic Artificial Blood Vessels Volume (K), by Application 2025 & 2033
- Figure 29: Europe Synthetic Artificial Blood Vessels Revenue Share (%), by Application 2025 & 2033
- Figure 30: Europe Synthetic Artificial Blood Vessels Volume Share (%), by Application 2025 & 2033
- Figure 31: Europe Synthetic Artificial Blood Vessels Revenue (million), by Types 2025 & 2033
- Figure 32: Europe Synthetic Artificial Blood Vessels Volume (K), by Types 2025 & 2033
- Figure 33: Europe Synthetic Artificial Blood Vessels Revenue Share (%), by Types 2025 & 2033
- Figure 34: Europe Synthetic Artificial Blood Vessels Volume Share (%), by Types 2025 & 2033
- Figure 35: Europe Synthetic Artificial Blood Vessels Revenue (million), by Country 2025 & 2033
- Figure 36: Europe Synthetic Artificial Blood Vessels Volume (K), by Country 2025 & 2033
- Figure 37: Europe Synthetic Artificial Blood Vessels Revenue Share (%), by Country 2025 & 2033
- Figure 38: Europe Synthetic Artificial Blood Vessels Volume Share (%), by Country 2025 & 2033
- Figure 39: Middle East & Africa Synthetic Artificial Blood Vessels Revenue (million), by Application 2025 & 2033
- Figure 40: Middle East & Africa Synthetic Artificial Blood Vessels Volume (K), by Application 2025 & 2033
- Figure 41: Middle East & Africa Synthetic Artificial Blood Vessels Revenue Share (%), by Application 2025 & 2033
- Figure 42: Middle East & Africa Synthetic Artificial Blood Vessels Volume Share (%), by Application 2025 & 2033
- Figure 43: Middle East & Africa Synthetic Artificial Blood Vessels Revenue (million), by Types 2025 & 2033
- Figure 44: Middle East & Africa Synthetic Artificial Blood Vessels Volume (K), by Types 2025 & 2033
- Figure 45: Middle East & Africa Synthetic Artificial Blood Vessels Revenue Share (%), by Types 2025 & 2033
- Figure 46: Middle East & Africa Synthetic Artificial Blood Vessels Volume Share (%), by Types 2025 & 2033
- Figure 47: Middle East & Africa Synthetic Artificial Blood Vessels Revenue (million), by Country 2025 & 2033
- Figure 48: Middle East & Africa Synthetic Artificial Blood Vessels Volume (K), by Country 2025 & 2033
- Figure 49: Middle East & Africa Synthetic Artificial Blood Vessels Revenue Share (%), by Country 2025 & 2033
- Figure 50: Middle East & Africa Synthetic Artificial Blood Vessels Volume Share (%), by Country 2025 & 2033
- Figure 51: Asia Pacific Synthetic Artificial Blood Vessels Revenue (million), by Application 2025 & 2033
- Figure 52: Asia Pacific Synthetic Artificial Blood Vessels Volume (K), by Application 2025 & 2033
- Figure 53: Asia Pacific Synthetic Artificial Blood Vessels Revenue Share (%), by Application 2025 & 2033
- Figure 54: Asia Pacific Synthetic Artificial Blood Vessels Volume Share (%), by Application 2025 & 2033
- Figure 55: Asia Pacific Synthetic Artificial Blood Vessels Revenue (million), by Types 2025 & 2033
- Figure 56: Asia Pacific Synthetic Artificial Blood Vessels Volume (K), by Types 2025 & 2033
- Figure 57: Asia Pacific Synthetic Artificial Blood Vessels Revenue Share (%), by Types 2025 & 2033
- Figure 58: Asia Pacific Synthetic Artificial Blood Vessels Volume Share (%), by Types 2025 & 2033
- Figure 59: Asia Pacific Synthetic Artificial Blood Vessels Revenue (million), by Country 2025 & 2033
- Figure 60: Asia Pacific Synthetic Artificial Blood Vessels Volume (K), by Country 2025 & 2033
- Figure 61: Asia Pacific Synthetic Artificial Blood Vessels Revenue Share (%), by Country 2025 & 2033
- Figure 62: Asia Pacific Synthetic Artificial Blood Vessels Volume Share (%), by Country 2025 & 2033
List of Tables
- Table 1: Global Synthetic Artificial Blood Vessels Revenue million Forecast, by Application 2020 & 2033
- Table 2: Global Synthetic Artificial Blood Vessels Volume K Forecast, by Application 2020 & 2033
- Table 3: Global Synthetic Artificial Blood Vessels Revenue million Forecast, by Types 2020 & 2033
- Table 4: Global Synthetic Artificial Blood Vessels Volume K Forecast, by Types 2020 & 2033
- Table 5: Global Synthetic Artificial Blood Vessels Revenue million Forecast, by Region 2020 & 2033
- Table 6: Global Synthetic Artificial Blood Vessels Volume K Forecast, by Region 2020 & 2033
- Table 7: Global Synthetic Artificial Blood Vessels Revenue million Forecast, by Application 2020 & 2033
- Table 8: Global Synthetic Artificial Blood Vessels Volume K Forecast, by Application 2020 & 2033
- Table 9: Global Synthetic Artificial Blood Vessels Revenue million Forecast, by Types 2020 & 2033
- Table 10: Global Synthetic Artificial Blood Vessels Volume K Forecast, by Types 2020 & 2033
- Table 11: Global Synthetic Artificial Blood Vessels Revenue million Forecast, by Country 2020 & 2033
- Table 12: Global Synthetic Artificial Blood Vessels Volume K Forecast, by Country 2020 & 2033
- Table 13: United States Synthetic Artificial Blood Vessels Revenue (million) Forecast, by Application 2020 & 2033
- Table 14: United States Synthetic Artificial Blood Vessels Volume (K) Forecast, by Application 2020 & 2033
- Table 15: Canada Synthetic Artificial Blood Vessels Revenue (million) Forecast, by Application 2020 & 2033
- Table 16: Canada Synthetic Artificial Blood Vessels Volume (K) Forecast, by Application 2020 & 2033
- Table 17: Mexico Synthetic Artificial Blood Vessels Revenue (million) Forecast, by Application 2020 & 2033
- Table 18: Mexico Synthetic Artificial Blood Vessels Volume (K) Forecast, by Application 2020 & 2033
- Table 19: Global Synthetic Artificial Blood Vessels Revenue million Forecast, by Application 2020 & 2033
- Table 20: Global Synthetic Artificial Blood Vessels Volume K Forecast, by Application 2020 & 2033
- Table 21: Global Synthetic Artificial Blood Vessels Revenue million Forecast, by Types 2020 & 2033
- Table 22: Global Synthetic Artificial Blood Vessels Volume K Forecast, by Types 2020 & 2033
- Table 23: Global Synthetic Artificial Blood Vessels Revenue million Forecast, by Country 2020 & 2033
- Table 24: Global Synthetic Artificial Blood Vessels Volume K Forecast, by Country 2020 & 2033
- Table 25: Brazil Synthetic Artificial Blood Vessels Revenue (million) Forecast, by Application 2020 & 2033
- Table 26: Brazil Synthetic Artificial Blood Vessels Volume (K) Forecast, by Application 2020 & 2033
- Table 27: Argentina Synthetic Artificial Blood Vessels Revenue (million) Forecast, by Application 2020 & 2033
- Table 28: Argentina Synthetic Artificial Blood Vessels Volume (K) Forecast, by Application 2020 & 2033
- Table 29: Rest of South America Synthetic Artificial Blood Vessels Revenue (million) Forecast, by Application 2020 & 2033
- Table 30: Rest of South America Synthetic Artificial Blood Vessels Volume (K) Forecast, by Application 2020 & 2033
- Table 31: Global Synthetic Artificial Blood Vessels Revenue million Forecast, by Application 2020 & 2033
- Table 32: Global Synthetic Artificial Blood Vessels Volume K Forecast, by Application 2020 & 2033
- Table 33: Global Synthetic Artificial Blood Vessels Revenue million Forecast, by Types 2020 & 2033
- Table 34: Global Synthetic Artificial Blood Vessels Volume K Forecast, by Types 2020 & 2033
- Table 35: Global Synthetic Artificial Blood Vessels Revenue million Forecast, by Country 2020 & 2033
- Table 36: Global Synthetic Artificial Blood Vessels Volume K Forecast, by Country 2020 & 2033
- Table 37: United Kingdom Synthetic Artificial Blood Vessels Revenue (million) Forecast, by Application 2020 & 2033
- Table 38: United Kingdom Synthetic Artificial Blood Vessels Volume (K) Forecast, by Application 2020 & 2033
- Table 39: Germany Synthetic Artificial Blood Vessels Revenue (million) Forecast, by Application 2020 & 2033
- Table 40: Germany Synthetic Artificial Blood Vessels Volume (K) Forecast, by Application 2020 & 2033
- Table 41: France Synthetic Artificial Blood Vessels Revenue (million) Forecast, by Application 2020 & 2033
- Table 42: France Synthetic Artificial Blood Vessels Volume (K) Forecast, by Application 2020 & 2033
- Table 43: Italy Synthetic Artificial Blood Vessels Revenue (million) Forecast, by Application 2020 & 2033
- Table 44: Italy Synthetic Artificial Blood Vessels Volume (K) Forecast, by Application 2020 & 2033
- Table 45: Spain Synthetic Artificial Blood Vessels Revenue (million) Forecast, by Application 2020 & 2033
- Table 46: Spain Synthetic Artificial Blood Vessels Volume (K) Forecast, by Application 2020 & 2033
- Table 47: Russia Synthetic Artificial Blood Vessels Revenue (million) Forecast, by Application 2020 & 2033
- Table 48: Russia Synthetic Artificial Blood Vessels Volume (K) Forecast, by Application 2020 & 2033
- Table 49: Benelux Synthetic Artificial Blood Vessels Revenue (million) Forecast, by Application 2020 & 2033
- Table 50: Benelux Synthetic Artificial Blood Vessels Volume (K) Forecast, by Application 2020 & 2033
- Table 51: Nordics Synthetic Artificial Blood Vessels Revenue (million) Forecast, by Application 2020 & 2033
- Table 52: Nordics Synthetic Artificial Blood Vessels Volume (K) Forecast, by Application 2020 & 2033
- Table 53: Rest of Europe Synthetic Artificial Blood Vessels Revenue (million) Forecast, by Application 2020 & 2033
- Table 54: Rest of Europe Synthetic Artificial Blood Vessels Volume (K) Forecast, by Application 2020 & 2033
- Table 55: Global Synthetic Artificial Blood Vessels Revenue million Forecast, by Application 2020 & 2033
- Table 56: Global Synthetic Artificial Blood Vessels Volume K Forecast, by Application 2020 & 2033
- Table 57: Global Synthetic Artificial Blood Vessels Revenue million Forecast, by Types 2020 & 2033
- Table 58: Global Synthetic Artificial Blood Vessels Volume K Forecast, by Types 2020 & 2033
- Table 59: Global Synthetic Artificial Blood Vessels Revenue million Forecast, by Country 2020 & 2033
- Table 60: Global Synthetic Artificial Blood Vessels Volume K Forecast, by Country 2020 & 2033
- Table 61: Turkey Synthetic Artificial Blood Vessels Revenue (million) Forecast, by Application 2020 & 2033
- Table 62: Turkey Synthetic Artificial Blood Vessels Volume (K) Forecast, by Application 2020 & 2033
- Table 63: Israel Synthetic Artificial Blood Vessels Revenue (million) Forecast, by Application 2020 & 2033
- Table 64: Israel Synthetic Artificial Blood Vessels Volume (K) Forecast, by Application 2020 & 2033
- Table 65: GCC Synthetic Artificial Blood Vessels Revenue (million) Forecast, by Application 2020 & 2033
- Table 66: GCC Synthetic Artificial Blood Vessels Volume (K) Forecast, by Application 2020 & 2033
- Table 67: North Africa Synthetic Artificial Blood Vessels Revenue (million) Forecast, by Application 2020 & 2033
- Table 68: North Africa Synthetic Artificial Blood Vessels Volume (K) Forecast, by Application 2020 & 2033
- Table 69: South Africa Synthetic Artificial Blood Vessels Revenue (million) Forecast, by Application 2020 & 2033
- Table 70: South Africa Synthetic Artificial Blood Vessels Volume (K) Forecast, by Application 2020 & 2033
- Table 71: Rest of Middle East & Africa Synthetic Artificial Blood Vessels Revenue (million) Forecast, by Application 2020 & 2033
- Table 72: Rest of Middle East & Africa Synthetic Artificial Blood Vessels Volume (K) Forecast, by Application 2020 & 2033
- Table 73: Global Synthetic Artificial Blood Vessels Revenue million Forecast, by Application 2020 & 2033
- Table 74: Global Synthetic Artificial Blood Vessels Volume K Forecast, by Application 2020 & 2033
- Table 75: Global Synthetic Artificial Blood Vessels Revenue million Forecast, by Types 2020 & 2033
- Table 76: Global Synthetic Artificial Blood Vessels Volume K Forecast, by Types 2020 & 2033
- Table 77: Global Synthetic Artificial Blood Vessels Revenue million Forecast, by Country 2020 & 2033
- Table 78: Global Synthetic Artificial Blood Vessels Volume K Forecast, by Country 2020 & 2033
- Table 79: China Synthetic Artificial Blood Vessels Revenue (million) Forecast, by Application 2020 & 2033
- Table 80: China Synthetic Artificial Blood Vessels Volume (K) Forecast, by Application 2020 & 2033
- Table 81: India Synthetic Artificial Blood Vessels Revenue (million) Forecast, by Application 2020 & 2033
- Table 82: India Synthetic Artificial Blood Vessels Volume (K) Forecast, by Application 2020 & 2033
- Table 83: Japan Synthetic Artificial Blood Vessels Revenue (million) Forecast, by Application 2020 & 2033
- Table 84: Japan Synthetic Artificial Blood Vessels Volume (K) Forecast, by Application 2020 & 2033
- Table 85: South Korea Synthetic Artificial Blood Vessels Revenue (million) Forecast, by Application 2020 & 2033
- Table 86: South Korea Synthetic Artificial Blood Vessels Volume (K) Forecast, by Application 2020 & 2033
- Table 87: ASEAN Synthetic Artificial Blood Vessels Revenue (million) Forecast, by Application 2020 & 2033
- Table 88: ASEAN Synthetic Artificial Blood Vessels Volume (K) Forecast, by Application 2020 & 2033
- Table 89: Oceania Synthetic Artificial Blood Vessels Revenue (million) Forecast, by Application 2020 & 2033
- Table 90: Oceania Synthetic Artificial Blood Vessels Volume (K) Forecast, by Application 2020 & 2033
- Table 91: Rest of Asia Pacific Synthetic Artificial Blood Vessels Revenue (million) Forecast, by Application 2020 & 2033
- Table 92: Rest of Asia Pacific Synthetic Artificial Blood Vessels Volume (K) Forecast, by Application 2020 & 2033
Frequently Asked Questions
1. What is the projected Compound Annual Growth Rate (CAGR) of the Synthetic Artificial Blood Vessels?
The projected CAGR is approximately 4.4%.
2. Which companies are prominent players in the Synthetic Artificial Blood Vessels?
Key companies in the market include Getinge, BD (Bard), Terumo, W. L. Gore, Japan Lifeline, B.Braun, LeMaitre Vascular, Suokang, Chest Medical.
3. What are the main segments of the Synthetic Artificial Blood Vessels?
The market segments include Application, Types.
4. Can you provide details about the market size?
The market size is estimated to be USD 292.7 million as of 2022.
5. What are some drivers contributing to market growth?
N/A
6. What are the notable trends driving market growth?
N/A
7. Are there any restraints impacting market growth?
N/A
8. Can you provide examples of recent developments in the market?
N/A
9. What pricing options are available for accessing the report?
Pricing options include single-user, multi-user, and enterprise licenses priced at USD 3950.00, USD 5925.00, and USD 7900.00 respectively.
10. Is the market size provided in terms of value or volume?
The market size is provided in terms of value, measured in million and volume, measured in K.
11. Are there any specific market keywords associated with the report?
Yes, the market keyword associated with the report is "Synthetic Artificial Blood Vessels," which aids in identifying and referencing the specific market segment covered.
12. How do I determine which pricing option suits my needs best?
The pricing options vary based on user requirements and access needs. Individual users may opt for single-user licenses, while businesses requiring broader access may choose multi-user or enterprise licenses for cost-effective access to the report.
13. Are there any additional resources or data provided in the Synthetic Artificial Blood Vessels report?
While the report offers comprehensive insights, it's advisable to review the specific contents or supplementary materials provided to ascertain if additional resources or data are available.
14. How can I stay updated on further developments or reports in the Synthetic Artificial Blood Vessels?
To stay informed about further developments, trends, and reports in the Synthetic Artificial Blood Vessels, consider subscribing to industry newsletters, following relevant companies and organizations, or regularly checking reputable industry news sources and publications.
Methodology
Step 1 - Identification of Relevant Samples Size from Population Database


Step 2 - Approaches for Defining Global Market Size (Value, Volume* & Price*)

Note*: In applicable scenarios
Step 3 - Data Sources
Primary Research
- Web Analytics
- Survey Reports
- Research Institute
- Latest Research Reports
- Opinion Leaders
Secondary Research
- Annual Reports
- White Paper
- Latest Press Release
- Industry Association
- Paid Database
- Investor Presentations

Step 4 - Data Triangulation
Involves using different sources of information in order to increase the validity of a study
These sources are likely to be stakeholders in a program - participants, other researchers, program staff, other community members, and so on.
Then we put all data in single framework & apply various statistical tools to find out the dynamic on the market.
During the analysis stage, feedback from the stakeholder groups would be compared to determine areas of agreement as well as areas of divergence