

Key Insights
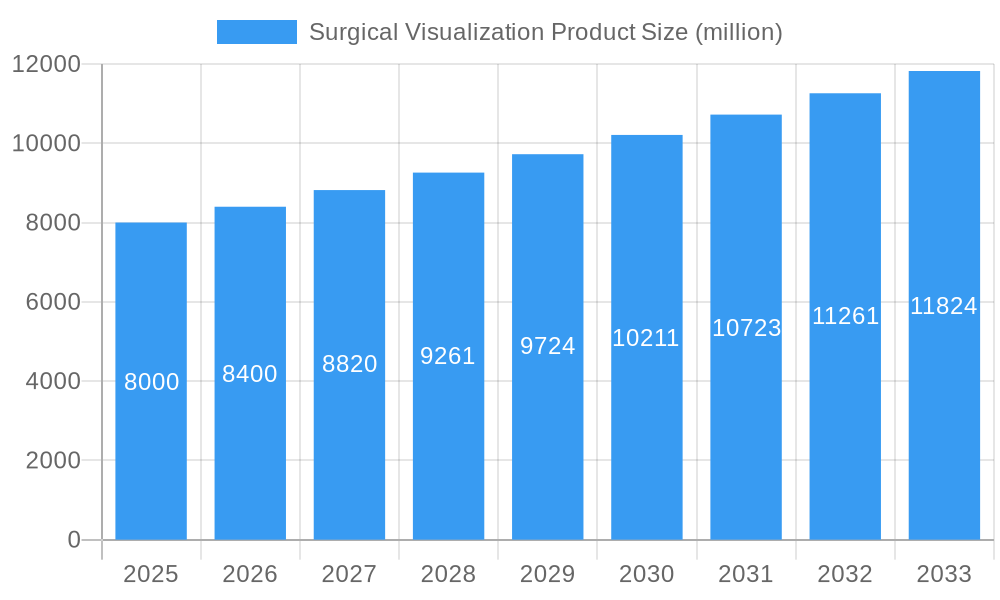
The surgical visualization market, encompassing technologies like endoscopes, laparoscopes, and imaging systems, is experiencing robust growth, driven by advancements in minimally invasive surgery (MIS), rising prevalence of chronic diseases requiring surgical intervention, and an increasing demand for improved surgical precision and patient outcomes. The market's size in 2025 is estimated at $8 billion, projected to reach approximately $12 billion by 2033, exhibiting a compound annual growth rate (CAGR) of around 5%. This growth is fueled by several key factors: the ongoing adoption of robotic-assisted surgery, which enhances visualization capabilities; the development of high-definition and 3D imaging systems providing surgeons with clearer, more detailed views of the surgical field; and the increasing integration of artificial intelligence (AI) and augmented reality (AR) technologies for improved diagnostic accuracy and surgical planning. Technological innovation is a major driver, leading to smaller, more versatile devices, and better integration with other surgical tools. Furthermore, the growing demand for improved surgical training and simulation platforms, further bolsters market growth.
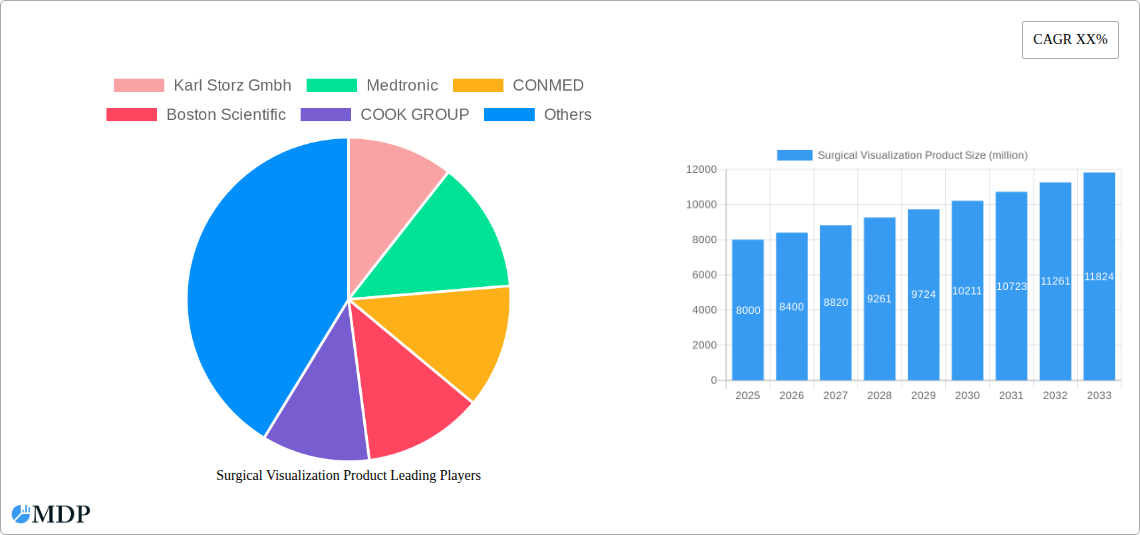
Surgical Visualization Product Market Size (In Billion)
However, the market also faces certain restraints. High initial investment costs associated with advanced visualization systems can limit adoption, particularly in resource-constrained healthcare settings. Furthermore, the stringent regulatory landscape for medical devices and the complexities of integrating new technologies into existing surgical workflows can present challenges. Despite these limitations, the long-term outlook for the surgical visualization market remains positive. Market segmentation reveals a robust demand across various surgical specialities, including laparoscopy, endoscopy, neurosurgery, and cardiovascular surgery. Key players like Karl Storz, Medtronic, and Boston Scientific are driving innovation and competition, leading to continuous improvement in product offerings and market expansion. The continued focus on improving patient safety, minimizing surgical trauma, and enhancing surgical efficiency will further propel the growth of this vital market sector.
Surgical Visualization Product Company Market Share
Surgical Visualization Product Market Report: 2019-2033 - A Comprehensive Analysis
This comprehensive report provides an in-depth analysis of the global surgical visualization product market, offering invaluable insights for industry stakeholders, investors, and researchers. The report covers the period 2019-2033, with a focus on the estimated year 2025 and a forecast period of 2025-2033. The market is projected to reach a value of $XX million by 2033, exhibiting a CAGR of XX% during the forecast period. This detailed analysis examines market dynamics, leading players, technological advancements, and future opportunities, providing actionable intelligence for strategic decision-making.
Surgical Visualization Product Market Dynamics & Concentration
The global surgical visualization product market is characterized by a moderately concentrated landscape, with several key players holding significant market share. While the exact market share for each company is proprietary and confidential, it is estimated that the top 5 players hold approximately 60% of the market in 2025. Key drivers of market innovation include advancements in imaging technologies (e.g., 4K and 3D visualization), integration with robotic surgery, and the growing demand for minimally invasive procedures. Regulatory frameworks, such as those set by the FDA and other global health agencies, significantly influence product development and market entry. Substitutes for surgical visualization products are limited, primarily consisting of traditional surgical techniques with lower precision and larger incisions. End-user trends, notably the preference for improved visualization for better surgical outcomes, fuel market growth. Mergers and acquisitions (M&A) activities have been moderate in recent years, with approximately XX M&A deals recorded between 2019 and 2024. This moderate level reflects consolidation strategies among existing players and a quest for advanced technologies.
- Market Concentration: Moderately concentrated, with top 5 players holding ~60% market share (2025 estimate).
- Innovation Drivers: Advancements in imaging, integration with robotics, minimally invasive surgery demand.
- Regulatory Impact: Significant influence from FDA and other global health agencies.
- Product Substitutes: Limited, mainly traditional surgical techniques.
- End-User Trends: Growing preference for improved visualization for better surgical outcomes.
- M&A Activity: Approximately XX deals between 2019 and 2024.
Surgical Visualization Product Industry Trends & Analysis
The surgical visualization product market is experiencing robust growth fueled by several key factors. The increasing prevalence of chronic diseases requiring surgical intervention, coupled with the rising adoption of minimally invasive procedures, is a primary driver. Technological advancements, such as the development of higher-resolution imaging systems (including 4K and 3D capabilities), AI-powered image enhancement, and improved intraoperative guidance systems, are significantly enhancing surgical precision and efficiency. This increased precision leads to better patient outcomes, shorter recovery times, and reduced hospital stays, factors driving market expansion. Consumer preferences are shifting toward minimally invasive, less-traumatic surgeries, which directly fuels demand for advanced visualization technologies. Competitive dynamics are shaped by continuous innovation, strategic partnerships, and a focus on product differentiation. The global market is witnessing a substantial increase in demand for surgical visualization products, with a projected CAGR of XX% during the forecast period (2025-2033). Market penetration is expected to grow, especially in emerging economies, as healthcare infrastructure improves and access to advanced surgical techniques increases.
Leading Markets & Segments in Surgical Visualization Product
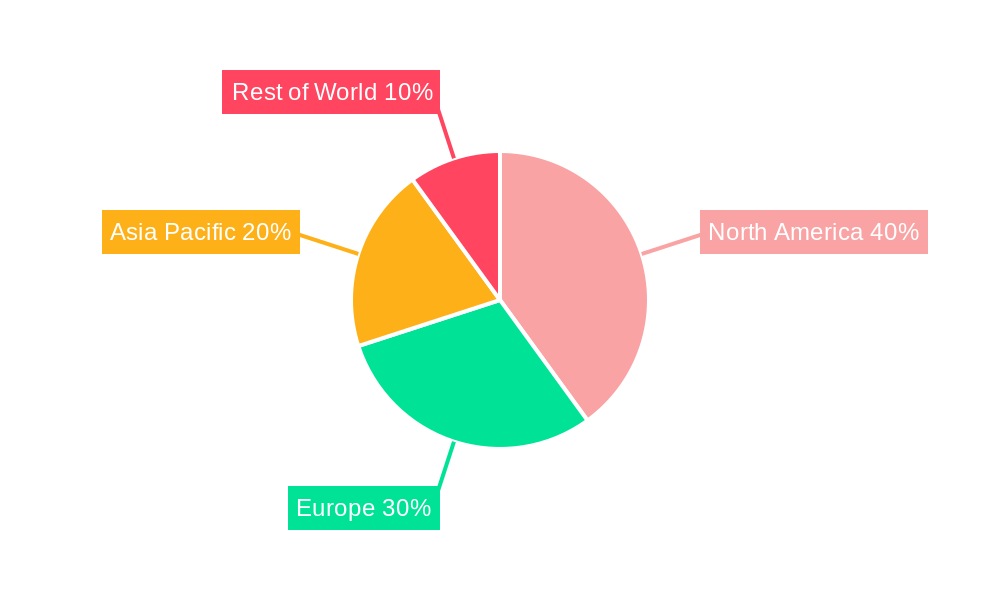
The North American region currently dominates the surgical visualization product market, driven by factors such as higher healthcare expenditure, advanced healthcare infrastructure, and a large base of surgical procedures performed annually. Strong regulatory support, substantial investment in R&D, and high adoption rates of advanced technologies further contribute to this dominance. The United States is the leading country within this region. Key drivers of this dominance include:
- High Healthcare Expenditure: Robust funding for healthcare infrastructure and new technologies.
- Advanced Healthcare Infrastructure: Well-equipped hospitals and surgical centers.
- High Surgical Procedure Volume: Large patient population requiring surgical interventions.
- Strong Regulatory Support: Favorable regulatory environment facilitating innovation and market entry.
- R&D Investment: Significant investment in developing new surgical visualization technologies.
Europe represents the second-largest market, with significant growth potential across various segments. Asia-Pacific is witnessing rapid expansion, driven by increasing disposable incomes, rising healthcare expenditure, and an expanding middle class.
Surgical Visualization Product Product Developments
Recent product developments in surgical visualization showcase a strong emphasis on integration with robotic surgery platforms, advanced imaging capabilities (including 4K and 3D), AI-powered image enhancement, and improved user interfaces. These advancements are leading to enhanced surgical precision, better visualization of complex anatomical structures, and improved workflow efficiency. The market is also witnessing the emergence of portable and more cost-effective solutions to expand accessibility. These developments address market needs for improved surgical outcomes, minimally invasive procedures, and affordable healthcare solutions.
Key Drivers of Surgical Visualization Product Growth
Several factors contribute to the robust growth of the surgical visualization product market. Technological advancements in imaging technology, robotic integration, and AI-driven image processing are at the forefront. Furthermore, the rising prevalence of chronic diseases necessitating surgical intervention significantly fuels market growth. The increasing demand for minimally invasive procedures (MIS), which rely heavily on advanced visualization, further expands the market. Favorable regulatory frameworks in many regions encourage the adoption of innovative surgical visualization technologies.
Challenges in the Surgical Visualization Product Market
The surgical visualization product market faces challenges, including stringent regulatory requirements for product approvals and certifications, which can increase development times and costs. Supply chain disruptions can also impact product availability and pricing. Intense competition among established players and the entry of new competitors with innovative solutions put pressure on profit margins and market share. These factors can collectively affect market growth trajectories and require strategic adaptation by market participants. The estimated impact of these factors on the market is a reduction of approximately XX million dollars annually.
Emerging Opportunities in Surgical Visualization Product
The long-term growth of the surgical visualization product market hinges on several key emerging opportunities. Advancements in artificial intelligence (AI) and machine learning (ML) hold immense potential to enhance image quality, automate tasks, and improve surgical decision-making. Strategic partnerships between technology providers and healthcare institutions can accelerate the adoption of innovative solutions and expand market reach. Expansion into emerging markets with increasing demand for surgical care and growing healthcare infrastructure offers significant growth potential.
Leading Players in the Surgical Visualization Product Sector
- Karl Storz GmbH
- Medtronic
- CONMED
- Boston Scientific
- COOK GROUP
- Smith & Nephew
- Richard Wolf GmbH
- Zowietek Electronics
- Cogentix Medical
- ACUTRONIC Medical Systems
- Optomic
- Happersberger otopront
- SonoScape Medical
- MEDI-CARE SOLUTIONS
- PENTAX Medical
- Johnson & Johnson
- MEDI-CARE SOLUTIONS
- Fujifilm
- Olympus
- Stryker
- B. Braun Melsungen
Key Milestones in Surgical Visualization Product Industry
- 2020: Launch of the first AI-powered image enhancement system by Company X.
- 2021: Acquisition of Company Y by Company Z, creating a larger market player.
- 2022: FDA approval of a novel 4K surgical visualization system.
- 2023: Significant investment in R&D by multiple industry leaders.
- 2024: Introduction of a new generation of portable surgical visualization units.
Strategic Outlook for Surgical Visualization Product Market
The future of the surgical visualization product market is bright, fueled by continuous technological advancements and an ever-increasing demand for minimally invasive surgical techniques. Strategic partnerships and collaborations are likely to increase, driving innovation and market expansion. Significant investments in research and development are poised to introduce novel visualization technologies and further improve surgical outcomes. The market is expected to continue experiencing substantial growth in the coming years.
Surgical Visualization Product Segmentation
-
1. Application
- 1.1. ENT Endoscopy
- 1.2. Laparoscopy
- 1.3. Gastroscopy
- 1.4. Obstetrics/Gynaecology Endoscopy
- 1.5. Arthroscopy
- 1.6. Others
-
2. Types
- 2.1. Endoscopic Cameras
- 2.2. Camera Heads
- 2.3. Video Recorders And Processors
- 2.4. Video Convertors
- 2.5. Accessories
Surgical Visualization Product Segmentation By Geography
-
1. North America
- 1.1. United States
- 1.2. Canada
- 1.3. Mexico
-
2. South America
- 2.1. Brazil
- 2.2. Argentina
- 2.3. Rest of South America
-
3. Europe
- 3.1. United Kingdom
- 3.2. Germany
- 3.3. France
- 3.4. Italy
- 3.5. Spain
- 3.6. Russia
- 3.7. Benelux
- 3.8. Nordics
- 3.9. Rest of Europe
-
4. Middle East & Africa
- 4.1. Turkey
- 4.2. Israel
- 4.3. GCC
- 4.4. North Africa
- 4.5. South Africa
- 4.6. Rest of Middle East & Africa
-
5. Asia Pacific
- 5.1. China
- 5.2. India
- 5.3. Japan
- 5.4. South Korea
- 5.5. ASEAN
- 5.6. Oceania
- 5.7. Rest of Asia Pacific
Surgical Visualization Product Regional Market Share
Geographic Coverage of Surgical Visualization Product
Surgical Visualization Product REPORT HIGHLIGHTS
| Aspects | Details |
|---|---|
| Study Period | 2020-2034 |
| Base Year | 2025 |
| Estimated Year | 2026 |
| Forecast Period | 2026-2034 |
| Historical Period | 2020-2025 |
| Growth Rate | CAGR of 10.7% from 2020-2034 |
| Segmentation |
|
Table of Contents
- 1. Introduction
- 1.1. Research Scope
- 1.2. Market Segmentation
- 1.3. Research Objective
- 1.4. Definitions and Assumptions
- 2. Executive Summary
- 2.1. Market Snapshot
- 3. Market Dynamics
- 3.1. Market Drivers
- 3.2. Market Restrains
- 3.3. Market Trends
- 3.4. Market Opportunities
- 4. Market Factor Analysis
- 4.1. Porters Five Forces
- 4.1.1. Bargaining Power of Suppliers
- 4.1.2. Bargaining Power of Buyers
- 4.1.3. Threat of New Entrants
- 4.1.4. Threat of Substitutes
- 4.1.5. Competitive Rivalry
- 4.2. PESTEL analysis
- 4.3. BCG Analysis
- 4.3.1. Stars (High Growth, High Market Share)
- 4.3.2. Cash Cows (Low Growth, High Market Share)
- 4.3.3. Question Mark (High Growth, Low Market Share)
- 4.3.4. Dogs (Low Growth, Low Market Share)
- 4.4. Ansoff Matrix Analysis
- 4.5. Supply Chain Analysis
- 4.6. Regulatory Landscape
- 4.7. Current Market Potential and Opportunity Assessment (TAM–SAM–SOM Framework)
- 4.8. MDP Analyst Note
- 4.1. Porters Five Forces
- 5. Market Analysis, Insights and Forecast 2021-2033
- 5.1. Market Analysis, Insights and Forecast - by Application
- 5.1.1. ENT Endoscopy
- 5.1.2. Laparoscopy
- 5.1.3. Gastroscopy
- 5.1.4. Obstetrics/Gynaecology Endoscopy
- 5.1.5. Arthroscopy
- 5.1.6. Others
- 5.2. Market Analysis, Insights and Forecast - by Types
- 5.2.1. Endoscopic Cameras
- 5.2.2. Camera Heads
- 5.2.3. Video Recorders And Processors
- 5.2.4. Video Convertors
- 5.2.5. Accessories
- 5.3. Market Analysis, Insights and Forecast - by Region
- 5.3.1. North America
- 5.3.2. South America
- 5.3.3. Europe
- 5.3.4. Middle East & Africa
- 5.3.5. Asia Pacific
- 5.1. Market Analysis, Insights and Forecast - by Application
- 6. Global Surgical Visualization Product Analysis, Insights and Forecast, 2021-2033
- 6.1. Market Analysis, Insights and Forecast - by Application
- 6.1.1. ENT Endoscopy
- 6.1.2. Laparoscopy
- 6.1.3. Gastroscopy
- 6.1.4. Obstetrics/Gynaecology Endoscopy
- 6.1.5. Arthroscopy
- 6.1.6. Others
- 6.2. Market Analysis, Insights and Forecast - by Types
- 6.2.1. Endoscopic Cameras
- 6.2.2. Camera Heads
- 6.2.3. Video Recorders And Processors
- 6.2.4. Video Convertors
- 6.2.5. Accessories
- 6.1. Market Analysis, Insights and Forecast - by Application
- 7. North America Surgical Visualization Product Analysis, Insights and Forecast, 2020-2032
- 7.1. Market Analysis, Insights and Forecast - by Application
- 7.1.1. ENT Endoscopy
- 7.1.2. Laparoscopy
- 7.1.3. Gastroscopy
- 7.1.4. Obstetrics/Gynaecology Endoscopy
- 7.1.5. Arthroscopy
- 7.1.6. Others
- 7.2. Market Analysis, Insights and Forecast - by Types
- 7.2.1. Endoscopic Cameras
- 7.2.2. Camera Heads
- 7.2.3. Video Recorders And Processors
- 7.2.4. Video Convertors
- 7.2.5. Accessories
- 7.1. Market Analysis, Insights and Forecast - by Application
- 8. South America Surgical Visualization Product Analysis, Insights and Forecast, 2020-2032
- 8.1. Market Analysis, Insights and Forecast - by Application
- 8.1.1. ENT Endoscopy
- 8.1.2. Laparoscopy
- 8.1.3. Gastroscopy
- 8.1.4. Obstetrics/Gynaecology Endoscopy
- 8.1.5. Arthroscopy
- 8.1.6. Others
- 8.2. Market Analysis, Insights and Forecast - by Types
- 8.2.1. Endoscopic Cameras
- 8.2.2. Camera Heads
- 8.2.3. Video Recorders And Processors
- 8.2.4. Video Convertors
- 8.2.5. Accessories
- 8.1. Market Analysis, Insights and Forecast - by Application
- 9. Europe Surgical Visualization Product Analysis, Insights and Forecast, 2020-2032
- 9.1. Market Analysis, Insights and Forecast - by Application
- 9.1.1. ENT Endoscopy
- 9.1.2. Laparoscopy
- 9.1.3. Gastroscopy
- 9.1.4. Obstetrics/Gynaecology Endoscopy
- 9.1.5. Arthroscopy
- 9.1.6. Others
- 9.2. Market Analysis, Insights and Forecast - by Types
- 9.2.1. Endoscopic Cameras
- 9.2.2. Camera Heads
- 9.2.3. Video Recorders And Processors
- 9.2.4. Video Convertors
- 9.2.5. Accessories
- 9.1. Market Analysis, Insights and Forecast - by Application
- 10. Middle East & Africa Surgical Visualization Product Analysis, Insights and Forecast, 2020-2032
- 10.1. Market Analysis, Insights and Forecast - by Application
- 10.1.1. ENT Endoscopy
- 10.1.2. Laparoscopy
- 10.1.3. Gastroscopy
- 10.1.4. Obstetrics/Gynaecology Endoscopy
- 10.1.5. Arthroscopy
- 10.1.6. Others
- 10.2. Market Analysis, Insights and Forecast - by Types
- 10.2.1. Endoscopic Cameras
- 10.2.2. Camera Heads
- 10.2.3. Video Recorders And Processors
- 10.2.4. Video Convertors
- 10.2.5. Accessories
- 10.1. Market Analysis, Insights and Forecast - by Application
- 11. Asia Pacific Surgical Visualization Product Analysis, Insights and Forecast, 2020-2032
- 11.1. Market Analysis, Insights and Forecast - by Application
- 11.1.1. ENT Endoscopy
- 11.1.2. Laparoscopy
- 11.1.3. Gastroscopy
- 11.1.4. Obstetrics/Gynaecology Endoscopy
- 11.1.5. Arthroscopy
- 11.1.6. Others
- 11.2. Market Analysis, Insights and Forecast - by Types
- 11.2.1. Endoscopic Cameras
- 11.2.2. Camera Heads
- 11.2.3. Video Recorders And Processors
- 11.2.4. Video Convertors
- 11.2.5. Accessories
- 11.1. Market Analysis, Insights and Forecast - by Application
- 12. Competitive Analysis
- 12.1. Company Profiles
- 12.1.1 Karl Storz Gmbh
- 12.1.1.1. Company Overview
- 12.1.1.2. Products
- 12.1.1.3. Company Financials
- 12.1.1.4. SWOT Analysis
- 12.1.2 Medtronic
- 12.1.2.1. Company Overview
- 12.1.2.2. Products
- 12.1.2.3. Company Financials
- 12.1.2.4. SWOT Analysis
- 12.1.3 CONMED
- 12.1.3.1. Company Overview
- 12.1.3.2. Products
- 12.1.3.3. Company Financials
- 12.1.3.4. SWOT Analysis
- 12.1.4 Boston Scientific
- 12.1.4.1. Company Overview
- 12.1.4.2. Products
- 12.1.4.3. Company Financials
- 12.1.4.4. SWOT Analysis
- 12.1.5 COOK GROUP
- 12.1.5.1. Company Overview
- 12.1.5.2. Products
- 12.1.5.3. Company Financials
- 12.1.5.4. SWOT Analysis
- 12.1.6 Smith & Nephew
- 12.1.6.1. Company Overview
- 12.1.6.2. Products
- 12.1.6.3. Company Financials
- 12.1.6.4. SWOT Analysis
- 12.1.7 Richard Wolf GmbH
- 12.1.7.1. Company Overview
- 12.1.7.2. Products
- 12.1.7.3. Company Financials
- 12.1.7.4. SWOT Analysis
- 12.1.8 Zowietek Electronics
- 12.1.8.1. Company Overview
- 12.1.8.2. Products
- 12.1.8.3. Company Financials
- 12.1.8.4. SWOT Analysis
- 12.1.9 Cogentix Medical
- 12.1.9.1. Company Overview
- 12.1.9.2. Products
- 12.1.9.3. Company Financials
- 12.1.9.4. SWOT Analysis
- 12.1.10 ACUTRONIC Medical Systems
- 12.1.10.1. Company Overview
- 12.1.10.2. Products
- 12.1.10.3. Company Financials
- 12.1.10.4. SWOT Analysis
- 12.1.11 Optomic
- 12.1.11.1. Company Overview
- 12.1.11.2. Products
- 12.1.11.3. Company Financials
- 12.1.11.4. SWOT Analysis
- 12.1.12 Happersberger otopront
- 12.1.12.1. Company Overview
- 12.1.12.2. Products
- 12.1.12.3. Company Financials
- 12.1.12.4. SWOT Analysis
- 12.1.13 SonoScape Medical
- 12.1.13.1. Company Overview
- 12.1.13.2. Products
- 12.1.13.3. Company Financials
- 12.1.13.4. SWOT Analysis
- 12.1.14 MEDI-CARE SOLUTIONS
- 12.1.14.1. Company Overview
- 12.1.14.2. Products
- 12.1.14.3. Company Financials
- 12.1.14.4. SWOT Analysis
- 12.1.15 PENTAX Medical
- 12.1.15.1. Company Overview
- 12.1.15.2. Products
- 12.1.15.3. Company Financials
- 12.1.15.4. SWOT Analysis
- 12.1.16 Johnson & Johnson
- 12.1.16.1. Company Overview
- 12.1.16.2. Products
- 12.1.16.3. Company Financials
- 12.1.16.4. SWOT Analysis
- 12.1.17 MEDI-CARE SOLUTIONS
- 12.1.17.1. Company Overview
- 12.1.17.2. Products
- 12.1.17.3. Company Financials
- 12.1.17.4. SWOT Analysis
- 12.1.18 Fujifilm
- 12.1.18.1. Company Overview
- 12.1.18.2. Products
- 12.1.18.3. Company Financials
- 12.1.18.4. SWOT Analysis
- 12.1.19 Olympus
- 12.1.19.1. Company Overview
- 12.1.19.2. Products
- 12.1.19.3. Company Financials
- 12.1.19.4. SWOT Analysis
- 12.1.20 Stryker
- 12.1.20.1. Company Overview
- 12.1.20.2. Products
- 12.1.20.3. Company Financials
- 12.1.20.4. SWOT Analysis
- 12.1.21 B. Braun Melsungen
- 12.1.21.1. Company Overview
- 12.1.21.2. Products
- 12.1.21.3. Company Financials
- 12.1.21.4. SWOT Analysis
- 12.1.1 Karl Storz Gmbh
- 12.2. Market Entropy
- 12.2.1 Company's Key Areas Served
- 12.2.2 Recent Developments
- 12.3. Company Market Share Analysis 2025
- 12.3.1 Top 5 Companies Market Share Analysis
- 12.3.2 Top 3 Companies Market Share Analysis
- 12.4. List of Potential Customers
- 13. Research Methodology
List of Figures
- Figure 1: Global Surgical Visualization Product Revenue Breakdown (undefined, %) by Region 2025 & 2033
- Figure 2: North America Surgical Visualization Product Revenue (undefined), by Application 2025 & 2033
- Figure 3: North America Surgical Visualization Product Revenue Share (%), by Application 2025 & 2033
- Figure 4: North America Surgical Visualization Product Revenue (undefined), by Types 2025 & 2033
- Figure 5: North America Surgical Visualization Product Revenue Share (%), by Types 2025 & 2033
- Figure 6: North America Surgical Visualization Product Revenue (undefined), by Country 2025 & 2033
- Figure 7: North America Surgical Visualization Product Revenue Share (%), by Country 2025 & 2033
- Figure 8: South America Surgical Visualization Product Revenue (undefined), by Application 2025 & 2033
- Figure 9: South America Surgical Visualization Product Revenue Share (%), by Application 2025 & 2033
- Figure 10: South America Surgical Visualization Product Revenue (undefined), by Types 2025 & 2033
- Figure 11: South America Surgical Visualization Product Revenue Share (%), by Types 2025 & 2033
- Figure 12: South America Surgical Visualization Product Revenue (undefined), by Country 2025 & 2033
- Figure 13: South America Surgical Visualization Product Revenue Share (%), by Country 2025 & 2033
- Figure 14: Europe Surgical Visualization Product Revenue (undefined), by Application 2025 & 2033
- Figure 15: Europe Surgical Visualization Product Revenue Share (%), by Application 2025 & 2033
- Figure 16: Europe Surgical Visualization Product Revenue (undefined), by Types 2025 & 2033
- Figure 17: Europe Surgical Visualization Product Revenue Share (%), by Types 2025 & 2033
- Figure 18: Europe Surgical Visualization Product Revenue (undefined), by Country 2025 & 2033
- Figure 19: Europe Surgical Visualization Product Revenue Share (%), by Country 2025 & 2033
- Figure 20: Middle East & Africa Surgical Visualization Product Revenue (undefined), by Application 2025 & 2033
- Figure 21: Middle East & Africa Surgical Visualization Product Revenue Share (%), by Application 2025 & 2033
- Figure 22: Middle East & Africa Surgical Visualization Product Revenue (undefined), by Types 2025 & 2033
- Figure 23: Middle East & Africa Surgical Visualization Product Revenue Share (%), by Types 2025 & 2033
- Figure 24: Middle East & Africa Surgical Visualization Product Revenue (undefined), by Country 2025 & 2033
- Figure 25: Middle East & Africa Surgical Visualization Product Revenue Share (%), by Country 2025 & 2033
- Figure 26: Asia Pacific Surgical Visualization Product Revenue (undefined), by Application 2025 & 2033
- Figure 27: Asia Pacific Surgical Visualization Product Revenue Share (%), by Application 2025 & 2033
- Figure 28: Asia Pacific Surgical Visualization Product Revenue (undefined), by Types 2025 & 2033
- Figure 29: Asia Pacific Surgical Visualization Product Revenue Share (%), by Types 2025 & 2033
- Figure 30: Asia Pacific Surgical Visualization Product Revenue (undefined), by Country 2025 & 2033
- Figure 31: Asia Pacific Surgical Visualization Product Revenue Share (%), by Country 2025 & 2033
List of Tables
- Table 1: Global Surgical Visualization Product Revenue undefined Forecast, by Application 2020 & 2033
- Table 2: Global Surgical Visualization Product Revenue undefined Forecast, by Types 2020 & 2033
- Table 3: Global Surgical Visualization Product Revenue undefined Forecast, by Region 2020 & 2033
- Table 4: Global Surgical Visualization Product Revenue undefined Forecast, by Application 2020 & 2033
- Table 5: Global Surgical Visualization Product Revenue undefined Forecast, by Types 2020 & 2033
- Table 6: Global Surgical Visualization Product Revenue undefined Forecast, by Country 2020 & 2033
- Table 7: United States Surgical Visualization Product Revenue (undefined) Forecast, by Application 2020 & 2033
- Table 8: Canada Surgical Visualization Product Revenue (undefined) Forecast, by Application 2020 & 2033
- Table 9: Mexico Surgical Visualization Product Revenue (undefined) Forecast, by Application 2020 & 2033
- Table 10: Global Surgical Visualization Product Revenue undefined Forecast, by Application 2020 & 2033
- Table 11: Global Surgical Visualization Product Revenue undefined Forecast, by Types 2020 & 2033
- Table 12: Global Surgical Visualization Product Revenue undefined Forecast, by Country 2020 & 2033
- Table 13: Brazil Surgical Visualization Product Revenue (undefined) Forecast, by Application 2020 & 2033
- Table 14: Argentina Surgical Visualization Product Revenue (undefined) Forecast, by Application 2020 & 2033
- Table 15: Rest of South America Surgical Visualization Product Revenue (undefined) Forecast, by Application 2020 & 2033
- Table 16: Global Surgical Visualization Product Revenue undefined Forecast, by Application 2020 & 2033
- Table 17: Global Surgical Visualization Product Revenue undefined Forecast, by Types 2020 & 2033
- Table 18: Global Surgical Visualization Product Revenue undefined Forecast, by Country 2020 & 2033
- Table 19: United Kingdom Surgical Visualization Product Revenue (undefined) Forecast, by Application 2020 & 2033
- Table 20: Germany Surgical Visualization Product Revenue (undefined) Forecast, by Application 2020 & 2033
- Table 21: France Surgical Visualization Product Revenue (undefined) Forecast, by Application 2020 & 2033
- Table 22: Italy Surgical Visualization Product Revenue (undefined) Forecast, by Application 2020 & 2033
- Table 23: Spain Surgical Visualization Product Revenue (undefined) Forecast, by Application 2020 & 2033
- Table 24: Russia Surgical Visualization Product Revenue (undefined) Forecast, by Application 2020 & 2033
- Table 25: Benelux Surgical Visualization Product Revenue (undefined) Forecast, by Application 2020 & 2033
- Table 26: Nordics Surgical Visualization Product Revenue (undefined) Forecast, by Application 2020 & 2033
- Table 27: Rest of Europe Surgical Visualization Product Revenue (undefined) Forecast, by Application 2020 & 2033
- Table 28: Global Surgical Visualization Product Revenue undefined Forecast, by Application 2020 & 2033
- Table 29: Global Surgical Visualization Product Revenue undefined Forecast, by Types 2020 & 2033
- Table 30: Global Surgical Visualization Product Revenue undefined Forecast, by Country 2020 & 2033
- Table 31: Turkey Surgical Visualization Product Revenue (undefined) Forecast, by Application 2020 & 2033
- Table 32: Israel Surgical Visualization Product Revenue (undefined) Forecast, by Application 2020 & 2033
- Table 33: GCC Surgical Visualization Product Revenue (undefined) Forecast, by Application 2020 & 2033
- Table 34: North Africa Surgical Visualization Product Revenue (undefined) Forecast, by Application 2020 & 2033
- Table 35: South Africa Surgical Visualization Product Revenue (undefined) Forecast, by Application 2020 & 2033
- Table 36: Rest of Middle East & Africa Surgical Visualization Product Revenue (undefined) Forecast, by Application 2020 & 2033
- Table 37: Global Surgical Visualization Product Revenue undefined Forecast, by Application 2020 & 2033
- Table 38: Global Surgical Visualization Product Revenue undefined Forecast, by Types 2020 & 2033
- Table 39: Global Surgical Visualization Product Revenue undefined Forecast, by Country 2020 & 2033
- Table 40: China Surgical Visualization Product Revenue (undefined) Forecast, by Application 2020 & 2033
- Table 41: India Surgical Visualization Product Revenue (undefined) Forecast, by Application 2020 & 2033
- Table 42: Japan Surgical Visualization Product Revenue (undefined) Forecast, by Application 2020 & 2033
- Table 43: South Korea Surgical Visualization Product Revenue (undefined) Forecast, by Application 2020 & 2033
- Table 44: ASEAN Surgical Visualization Product Revenue (undefined) Forecast, by Application 2020 & 2033
- Table 45: Oceania Surgical Visualization Product Revenue (undefined) Forecast, by Application 2020 & 2033
- Table 46: Rest of Asia Pacific Surgical Visualization Product Revenue (undefined) Forecast, by Application 2020 & 2033
Frequently Asked Questions
1. What is the projected Compound Annual Growth Rate (CAGR) of the Surgical Visualization Product?
The projected CAGR is approximately 10.7%.
2. Which companies are prominent players in the Surgical Visualization Product?
Key companies in the market include Karl Storz Gmbh, Medtronic, CONMED, Boston Scientific, COOK GROUP, Smith & Nephew, Richard Wolf GmbH, Zowietek Electronics, Cogentix Medical, ACUTRONIC Medical Systems, Optomic, Happersberger otopront, SonoScape Medical, MEDI-CARE SOLUTIONS, PENTAX Medical, Johnson & Johnson, MEDI-CARE SOLUTIONS, Fujifilm, Olympus, Stryker, B. Braun Melsungen.
3. What are the main segments of the Surgical Visualization Product?
The market segments include Application, Types.
4. Can you provide details about the market size?
The market size is estimated to be USD XXX N/A as of 2022.
5. What are some drivers contributing to market growth?
N/A
6. What are the notable trends driving market growth?
N/A
7. Are there any restraints impacting market growth?
N/A
8. Can you provide examples of recent developments in the market?
N/A
9. What pricing options are available for accessing the report?
Pricing options include single-user, multi-user, and enterprise licenses priced at USD 2900.00, USD 4350.00, and USD 5800.00 respectively.
10. Is the market size provided in terms of value or volume?
The market size is provided in terms of value, measured in N/A.
11. Are there any specific market keywords associated with the report?
Yes, the market keyword associated with the report is "Surgical Visualization Product," which aids in identifying and referencing the specific market segment covered.
12. How do I determine which pricing option suits my needs best?
The pricing options vary based on user requirements and access needs. Individual users may opt for single-user licenses, while businesses requiring broader access may choose multi-user or enterprise licenses for cost-effective access to the report.
13. Are there any additional resources or data provided in the Surgical Visualization Product report?
While the report offers comprehensive insights, it's advisable to review the specific contents or supplementary materials provided to ascertain if additional resources or data are available.
14. How can I stay updated on further developments or reports in the Surgical Visualization Product?
To stay informed about further developments, trends, and reports in the Surgical Visualization Product, consider subscribing to industry newsletters, following relevant companies and organizations, or regularly checking reputable industry news sources and publications.
Methodology
Step 1 - Identification of Relevant Samples Size from Population Database


Step 2 - Approaches for Defining Global Market Size (Value, Volume* & Price*)

Note*: In applicable scenarios
Step 3 - Data Sources
Primary Research
- Web Analytics
- Survey Reports
- Research Institute
- Latest Research Reports
- Opinion Leaders
Secondary Research
- Annual Reports
- White Paper
- Latest Press Release
- Industry Association
- Paid Database
- Investor Presentations

Step 4 - Data Triangulation
Involves using different sources of information in order to increase the validity of a study
These sources are likely to be stakeholders in a program - participants, other researchers, program staff, other community members, and so on.
Then we put all data in single framework & apply various statistical tools to find out the dynamic on the market.
During the analysis stage, feedback from the stakeholder groups would be compared to determine areas of agreement as well as areas of divergence