

Key Insights
The global Surgical Robotics market is projected to achieve an estimated market size of $13.69 billion by 2025, exhibiting a robust compound annual growth rate (CAGR) of 14.7%. This significant expansion is driven by the escalating demand for minimally invasive surgical (MIS) procedures, which offer patients enhanced outcomes including faster recovery, reduced pain, and minimized scarring. Continuous advancements in robotic technology, enhancing precision, dexterity, and visualization, are solidifying their role as essential surgical tools across diverse specialties. The increasing integration of these sophisticated systems in complex procedures such as laparoscopy and orthopedics further supports this growth. Additionally, supportive governmental policies promoting healthcare innovation and heightened patient awareness of the advantages of robotic-assisted surgery are key market accelerators.
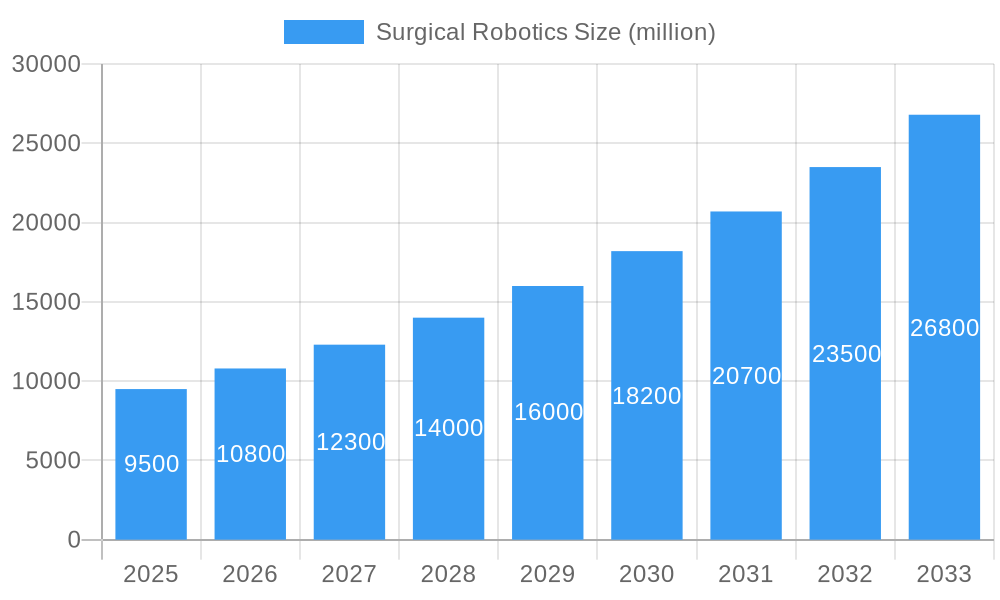
Surgical Robotics Market Size (In Billion)
While the market demonstrates strong growth potential, certain factors may influence its trajectory. The substantial upfront investment for surgical robotic systems and the requirement for specialized surgical team training pose significant adoption hurdles, particularly for healthcare facilities in emerging economies. Reimbursement policies and the rare possibility of system malfunctions also contribute to a cautious approach. However, ongoing technological innovations, including the development of more cost-effective and adaptable robotic platforms, and the expansion of applications into new specialties, are anticipated to offset these challenges. The market segmentation clearly indicates a strong preference for MIS techniques, with laparoscopy and orthopedics identified as primary application areas, underscoring the promising future of advanced surgical automation.
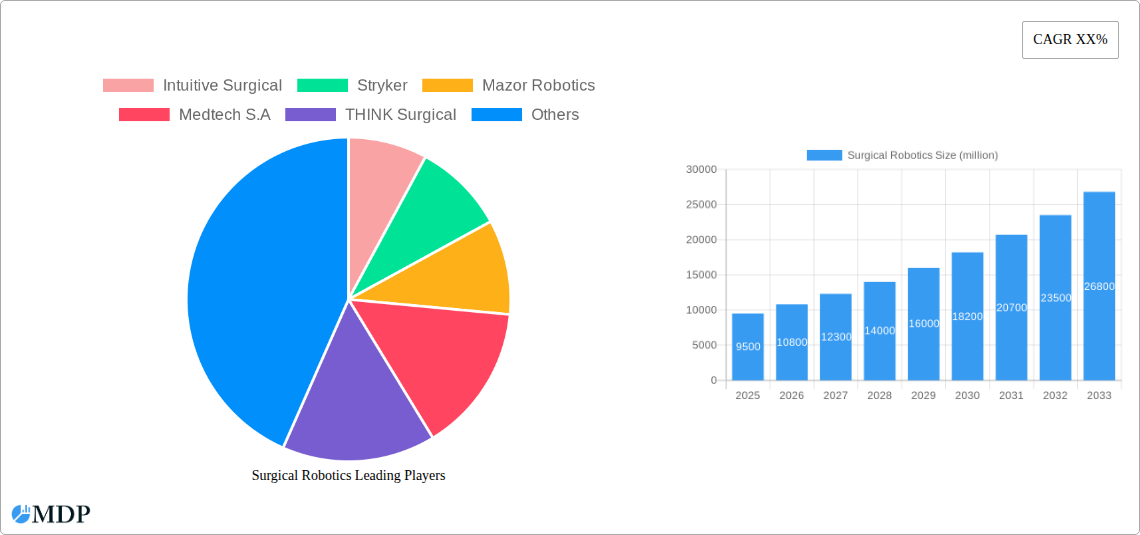
Surgical Robotics Company Market Share
This comprehensive report offers an in-depth analysis of the dynamic surgical robotics market, detailing its growth prospects, technological innovations, and competitive environment. Spanning the forecast period from 2019 to 2033, with a base year of 2025, this study provides crucial intelligence for industry participants, investors, and healthcare providers. Gain insights into key segments such as minimally invasive surgery, laparoscopic surgery, and orthopedic surgery, and understand the drivers behind this multi-billion dollar sector.
Surgical Robotics Market Dynamics & Concentration
The surgical robotics market exhibits a moderately concentrated landscape, with established players like Intuitive Surgical holding a significant market share, estimated to be over 50% in 2025. Innovation remains a primary driver, fueled by continuous research and development in areas such as artificial intelligence, miniaturization, and enhanced haptic feedback. Regulatory frameworks, though evolving, continue to shape market entry and product approvals, with stringent standards for safety and efficacy. Product substitutes, while present in traditional surgical methods, are increasingly being displaced by the precision and efficiency offered by robotic systems. End-user trends highlight a growing preference for less invasive procedures, leading to higher adoption rates in minimally invasive applications. Mergers and acquisitions (M&A) activity has been moderate, with approximately 5-10 significant deals annually, primarily aimed at acquiring innovative technologies or expanding market reach. The overall market value is projected to reach over $20 billion by 2025.
Surgical Robotics Industry Trends & Analysis
The surgical robotics industry is poised for substantial expansion, driven by a confluence of technological advancements and evolving healthcare demands. The global market is projected to experience a Compound Annual Growth Rate (CAGR) of approximately 15% from 2025 to 2033. This growth is primarily fueled by the increasing demand for minimally invasive surgical procedures, which offer patients reduced recovery times, minimized scarring, and lower risk of complications. Technological disruptions, including advancements in artificial intelligence (AI) and machine learning (ML), are enabling surgical robots to perform more complex tasks with greater precision, enhancing surgical outcomes. Furthermore, the integration of advanced imaging and navigation systems within robotic platforms is significantly improving surgical planning and execution. Consumer preferences are shifting towards treatments that minimize patient trauma and accelerate rehabilitation, making robotic-assisted surgery a preferred option for both surgeons and patients. The competitive dynamics within the market are characterized by a blend of established giants and emerging innovators, each vying for market penetration through product differentiation, strategic partnerships, and aggressive R&D investments. Market penetration for surgical robotics is projected to increase from roughly 20% in 2025 to over 40% by 2033 across key surgical specialties. The increasing prevalence of chronic diseases and the aging global population also contribute significantly to the demand for advanced surgical solutions. The continuous refinement of robotic instruments and control systems, along with the development of specialized robots for niche applications, are further bolstering market growth. The ongoing efforts to reduce the cost of robotic surgical systems are also expected to drive broader adoption in a wider range of healthcare facilities globally.
Leading Markets & Segments in Surgical Robotics
The surgical robotics market is currently dominated by North America, accounting for over 45% of the global market share in 2025, driven by robust healthcare infrastructure, high disposable incomes, and early adoption of advanced medical technologies. Within this region, the United States leads due to significant investments in R&D and widespread availability of robotic surgical systems.
Dominant Application: Minimal Invasive Surgery
- Market Penetration: Minimal invasive surgery is the leading application segment, projected to capture over 70% of the surgical robotics market by 2025.
- Key Drivers:
- Patient Demand: Growing patient preference for reduced pain, shorter hospital stays, and faster recovery times.
- Technological Advancements: Development of smaller, more dexterous robotic instruments enabling complex minimally invasive procedures.
- Cost-Effectiveness: While initial investment is high, reduced complication rates and shorter hospital stays contribute to long-term cost savings.
- Surgeon Training: Increasing availability of comprehensive training programs for robotic-assisted minimally invasive procedures.
Dominant Type: Laparoscopy
- Market Share: Laparoscopic procedures represent the largest segment within minimally invasive surgery, estimated to account for over 55% of robotic surgeries in 2025.
- Key Drivers:
- Versatility: Laparoscopic robotic systems are widely used across various surgical specialties, including general surgery, gynecology, and urology.
- Established Ecosystem: A mature ecosystem of instruments, accessories, and training support has been developed for laparoscopic robotics.
- Proven Outcomes: Decades of experience with laparoscopic surgery have built confidence and trust in its efficacy, with robotic assistance further enhancing these benefits.
Other Significant Segments
- Orthopedics: This segment is experiencing rapid growth, driven by the increasing demand for robotic-assisted joint replacements (knee and hip) and spine surgeries. The precision offered by robotic systems leads to improved implant placement and patient outcomes. The market share for orthopedics is expected to grow from approximately 15% in 2025 to over 25% by 2033.
- Open Surgery: While less dominant, robotic assistance is also being explored and implemented in certain complex open surgery scenarios to enhance surgeon control and visualization.
Surgical Robotics Product Developments
Product innovation in surgical robotics is characterized by a focus on enhanced dexterity, miniaturization, and AI integration. Companies are developing smaller, more agile robotic arms and instruments capable of performing intricate maneuvers with sub-millimeter precision. The integration of AI and machine learning algorithms is enabling real-time data analysis, predictive diagnostics, and improved surgical planning. Furthermore, advancements in imaging technologies, such as 3D visualization and augmented reality overlays, are providing surgeons with unparalleled situational awareness. These developments are not only improving patient outcomes by enabling less invasive procedures and reducing recovery times but also creating significant competitive advantages for manufacturers through proprietary technologies and enhanced system capabilities. The market is witnessing a surge in single-port robotic systems and specialized robots for emerging applications.
Key Drivers of Surgical Robotics Growth
The surgical robotics market is experiencing robust growth fueled by several key factors. Technological advancements, particularly in AI, miniaturization, and advanced imaging, are continuously enhancing the capabilities of robotic systems, leading to improved surgical precision and patient outcomes. The increasing prevalence of chronic diseases and an aging global population are driving higher demand for complex surgical interventions. Favorable economic policies and increasing healthcare expenditure in developing nations are expanding access to advanced medical technologies. Furthermore, the growing emphasis on minimally invasive procedures, due to their benefits of faster recovery and reduced complications, directly boosts the adoption of surgical robots. Regulatory bodies are also increasingly approving new robotic systems and applications, further accelerating market penetration.
Challenges in the Surgical Robotics Market
Despite its strong growth, the surgical robotics market faces several significant challenges. The high initial cost of robotic surgical systems remains a substantial barrier to adoption for many healthcare institutions, particularly in price-sensitive markets. Stringent regulatory hurdles and lengthy approval processes can delay the launch of new technologies. Supply chain disruptions and the need for specialized maintenance and servicing of complex robotic equipment can also pose logistical challenges. Furthermore, the availability of a sufficient number of well-trained surgeons and support staff is crucial for widespread implementation, and a shortage in this area can limit market expansion. Finally, the ongoing development of less invasive surgical techniques that do not require robotics also presents a competitive pressure. The estimated impact of these challenges on market growth is around 5-7%.
Emerging Opportunities in Surgical Robotics
Emerging opportunities in the surgical robotics market are predominantly driven by technological breakthroughs and strategic market expansion. The continued development of AI and machine learning algorithms for surgical guidance, autonomous task execution, and predictive analytics presents a vast frontier. Miniaturization of robotic instruments and the development of flexible, snake-like robots are opening doors to new endoscopic and trans-luminal surgical applications. Strategic partnerships between robotic manufacturers, AI developers, and healthcare providers are crucial for fostering innovation and accelerating adoption. Furthermore, significant growth potential lies in expanding the market reach to underserved regions and developing countries, where the demand for advanced healthcare solutions is high and unmet. The development of specialized robotic systems for niche surgical areas and the increasing focus on remote surgery and telesurgery also represent lucrative future avenues.
Leading Players in the Surgical Robotics Sector
- Intuitive Surgical
- Stryker
- Mazor Robotics
- Medtech S.A
- THINK Surgical
- Restoration Robotics
- Medrobotics
- TransEnterix
- Globus Medical
- Accuray Incorporated
Key Milestones in Surgical Robotics Industry
- 2019: FDA clearance for new robotic systems focused on specific orthopedic applications, increasing market segmentation.
- 2020: Significant advancements in AI algorithms for surgical planning and intraoperative guidance, enhancing robot precision.
- 2021: Expansion of minimally invasive robotic surgery to a wider range of general surgery procedures, including bariatric and colorectal.
- 2022: Introduction of single-port robotic surgical systems, further reducing invasiveness and patient recovery time.
- 2023: Increased investment in research and development of AI-powered robotic surgery, projecting future autonomous capabilities.
- 2024: Growing adoption of robotic surgery in emerging markets, driven by improved affordability and accessibility initiatives.
- 2025 (Estimated): Anticipated regulatory approvals for advanced AI-driven robotic surgery platforms, marking a new era of precision.
Strategic Outlook for Surgical Robotics Market
The strategic outlook for the surgical robotics market is exceptionally positive, projected for sustained high growth through 2033. Key growth accelerators include the continued integration of artificial intelligence for enhanced surgical decision-making and automation, alongside the miniaturization of robotic systems to enable more complex and less invasive procedures. Expansion into emerging economies and the development of cost-effective solutions will unlock significant market potential. Strategic partnerships and collaborations will be crucial for fostering innovation and driving widespread adoption. The market is expected to witness diversification with specialized robotic platforms for niche applications, further solidifying its indispensable role in modern healthcare.
Surgical Robotics Segmentation
-
1. Application
- 1.1. Open Surgery
- 1.2. Minimal Invasive
-
2. Types
- 2.1. Laparoscopy
- 2.2. Orthopedics
- 2.3. Others
Surgical Robotics Segmentation By Geography
-
1. North America
- 1.1. United States
- 1.2. Canada
- 1.3. Mexico
-
2. South America
- 2.1. Brazil
- 2.2. Argentina
- 2.3. Rest of South America
-
3. Europe
- 3.1. United Kingdom
- 3.2. Germany
- 3.3. France
- 3.4. Italy
- 3.5. Spain
- 3.6. Russia
- 3.7. Benelux
- 3.8. Nordics
- 3.9. Rest of Europe
-
4. Middle East & Africa
- 4.1. Turkey
- 4.2. Israel
- 4.3. GCC
- 4.4. North Africa
- 4.5. South Africa
- 4.6. Rest of Middle East & Africa
-
5. Asia Pacific
- 5.1. China
- 5.2. India
- 5.3. Japan
- 5.4. South Korea
- 5.5. ASEAN
- 5.6. Oceania
- 5.7. Rest of Asia Pacific
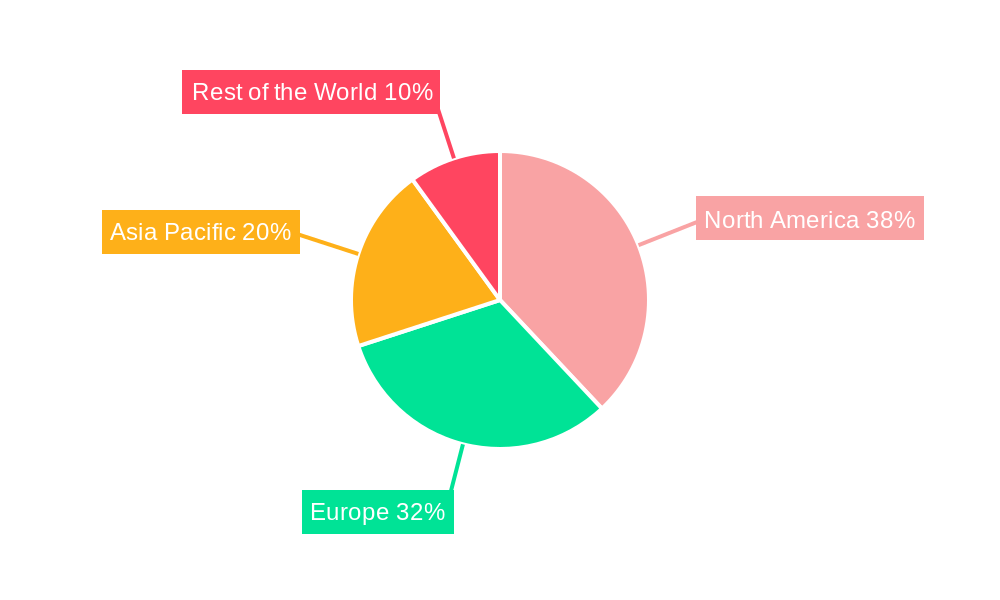
Surgical Robotics Regional Market Share
Geographic Coverage of Surgical Robotics
Surgical Robotics REPORT HIGHLIGHTS
| Aspects | Details |
|---|---|
| Study Period | 2020-2034 |
| Base Year | 2025 |
| Estimated Year | 2026 |
| Forecast Period | 2026-2034 |
| Historical Period | 2020-2025 |
| Growth Rate | CAGR of 14.7% from 2020-2034 |
| Segmentation |
|
Table of Contents
- 1. Introduction
- 1.1. Research Scope
- 1.2. Market Segmentation
- 1.3. Research Objective
- 1.4. Definitions and Assumptions
- 2. Executive Summary
- 2.1. Market Snapshot
- 3. Market Dynamics
- 3.1. Market Drivers
- 3.2. Market Restrains
- 3.3. Market Trends
- 3.4. Market Opportunities
- 4. Market Factor Analysis
- 4.1. Porters Five Forces
- 4.1.1. Bargaining Power of Suppliers
- 4.1.2. Bargaining Power of Buyers
- 4.1.3. Threat of New Entrants
- 4.1.4. Threat of Substitutes
- 4.1.5. Competitive Rivalry
- 4.2. PESTEL analysis
- 4.3. BCG Analysis
- 4.3.1. Stars (High Growth, High Market Share)
- 4.3.2. Cash Cows (Low Growth, High Market Share)
- 4.3.3. Question Mark (High Growth, Low Market Share)
- 4.3.4. Dogs (Low Growth, Low Market Share)
- 4.4. Ansoff Matrix Analysis
- 4.5. Supply Chain Analysis
- 4.6. Regulatory Landscape
- 4.7. Current Market Potential and Opportunity Assessment (TAM–SAM–SOM Framework)
- 4.8. MDP Analyst Note
- 4.1. Porters Five Forces
- 5. Market Analysis, Insights and Forecast 2021-2033
- 5.1. Market Analysis, Insights and Forecast - by Application
- 5.1.1. Open Surgery
- 5.1.2. Minimal Invasive
- 5.2. Market Analysis, Insights and Forecast - by Types
- 5.2.1. Laparoscopy
- 5.2.2. Orthopedics
- 5.2.3. Others
- 5.3. Market Analysis, Insights and Forecast - by Region
- 5.3.1. North America
- 5.3.2. South America
- 5.3.3. Europe
- 5.3.4. Middle East & Africa
- 5.3.5. Asia Pacific
- 5.1. Market Analysis, Insights and Forecast - by Application
- 6. Global Surgical Robotics Analysis, Insights and Forecast, 2021-2033
- 6.1. Market Analysis, Insights and Forecast - by Application
- 6.1.1. Open Surgery
- 6.1.2. Minimal Invasive
- 6.2. Market Analysis, Insights and Forecast - by Types
- 6.2.1. Laparoscopy
- 6.2.2. Orthopedics
- 6.2.3. Others
- 6.1. Market Analysis, Insights and Forecast - by Application
- 7. North America Surgical Robotics Analysis, Insights and Forecast, 2020-2032
- 7.1. Market Analysis, Insights and Forecast - by Application
- 7.1.1. Open Surgery
- 7.1.2. Minimal Invasive
- 7.2. Market Analysis, Insights and Forecast - by Types
- 7.2.1. Laparoscopy
- 7.2.2. Orthopedics
- 7.2.3. Others
- 7.1. Market Analysis, Insights and Forecast - by Application
- 8. South America Surgical Robotics Analysis, Insights and Forecast, 2020-2032
- 8.1. Market Analysis, Insights and Forecast - by Application
- 8.1.1. Open Surgery
- 8.1.2. Minimal Invasive
- 8.2. Market Analysis, Insights and Forecast - by Types
- 8.2.1. Laparoscopy
- 8.2.2. Orthopedics
- 8.2.3. Others
- 8.1. Market Analysis, Insights and Forecast - by Application
- 9. Europe Surgical Robotics Analysis, Insights and Forecast, 2020-2032
- 9.1. Market Analysis, Insights and Forecast - by Application
- 9.1.1. Open Surgery
- 9.1.2. Minimal Invasive
- 9.2. Market Analysis, Insights and Forecast - by Types
- 9.2.1. Laparoscopy
- 9.2.2. Orthopedics
- 9.2.3. Others
- 9.1. Market Analysis, Insights and Forecast - by Application
- 10. Middle East & Africa Surgical Robotics Analysis, Insights and Forecast, 2020-2032
- 10.1. Market Analysis, Insights and Forecast - by Application
- 10.1.1. Open Surgery
- 10.1.2. Minimal Invasive
- 10.2. Market Analysis, Insights and Forecast - by Types
- 10.2.1. Laparoscopy
- 10.2.2. Orthopedics
- 10.2.3. Others
- 10.1. Market Analysis, Insights and Forecast - by Application
- 11. Asia Pacific Surgical Robotics Analysis, Insights and Forecast, 2020-2032
- 11.1. Market Analysis, Insights and Forecast - by Application
- 11.1.1. Open Surgery
- 11.1.2. Minimal Invasive
- 11.2. Market Analysis, Insights and Forecast - by Types
- 11.2.1. Laparoscopy
- 11.2.2. Orthopedics
- 11.2.3. Others
- 11.1. Market Analysis, Insights and Forecast - by Application
- 12. Competitive Analysis
- 12.1. Company Profiles
- 12.1.1 Intuitive Surgical
- 12.1.1.1. Company Overview
- 12.1.1.2. Products
- 12.1.1.3. Company Financials
- 12.1.1.4. SWOT Analysis
- 12.1.2 Stryker
- 12.1.2.1. Company Overview
- 12.1.2.2. Products
- 12.1.2.3. Company Financials
- 12.1.2.4. SWOT Analysis
- 12.1.3 Mazor Robotics
- 12.1.3.1. Company Overview
- 12.1.3.2. Products
- 12.1.3.3. Company Financials
- 12.1.3.4. SWOT Analysis
- 12.1.4 Medtech S.A
- 12.1.4.1. Company Overview
- 12.1.4.2. Products
- 12.1.4.3. Company Financials
- 12.1.4.4. SWOT Analysis
- 12.1.5 THINK Surgical
- 12.1.5.1. Company Overview
- 12.1.5.2. Products
- 12.1.5.3. Company Financials
- 12.1.5.4. SWOT Analysis
- 12.1.6 Restoration Robotics
- 12.1.6.1. Company Overview
- 12.1.6.2. Products
- 12.1.6.3. Company Financials
- 12.1.6.4. SWOT Analysis
- 12.1.7 Medrobotics
- 12.1.7.1. Company Overview
- 12.1.7.2. Products
- 12.1.7.3. Company Financials
- 12.1.7.4. SWOT Analysis
- 12.1.8 TransEnterix
- 12.1.8.1. Company Overview
- 12.1.8.2. Products
- 12.1.8.3. Company Financials
- 12.1.8.4. SWOT Analysis
- 12.1.1 Intuitive Surgical
- 12.2. Market Entropy
- 12.2.1 Company's Key Areas Served
- 12.2.2 Recent Developments
- 12.3. Company Market Share Analysis 2025
- 12.3.1 Top 5 Companies Market Share Analysis
- 12.3.2 Top 3 Companies Market Share Analysis
- 12.4. List of Potential Customers
- 13. Research Methodology
List of Figures
- Figure 1: Global Surgical Robotics Revenue Breakdown (billion, %) by Region 2025 & 2033
- Figure 2: Global Surgical Robotics Volume Breakdown (K, %) by Region 2025 & 2033
- Figure 3: North America Surgical Robotics Revenue (billion), by Application 2025 & 2033
- Figure 4: North America Surgical Robotics Volume (K), by Application 2025 & 2033
- Figure 5: North America Surgical Robotics Revenue Share (%), by Application 2025 & 2033
- Figure 6: North America Surgical Robotics Volume Share (%), by Application 2025 & 2033
- Figure 7: North America Surgical Robotics Revenue (billion), by Types 2025 & 2033
- Figure 8: North America Surgical Robotics Volume (K), by Types 2025 & 2033
- Figure 9: North America Surgical Robotics Revenue Share (%), by Types 2025 & 2033
- Figure 10: North America Surgical Robotics Volume Share (%), by Types 2025 & 2033
- Figure 11: North America Surgical Robotics Revenue (billion), by Country 2025 & 2033
- Figure 12: North America Surgical Robotics Volume (K), by Country 2025 & 2033
- Figure 13: North America Surgical Robotics Revenue Share (%), by Country 2025 & 2033
- Figure 14: North America Surgical Robotics Volume Share (%), by Country 2025 & 2033
- Figure 15: South America Surgical Robotics Revenue (billion), by Application 2025 & 2033
- Figure 16: South America Surgical Robotics Volume (K), by Application 2025 & 2033
- Figure 17: South America Surgical Robotics Revenue Share (%), by Application 2025 & 2033
- Figure 18: South America Surgical Robotics Volume Share (%), by Application 2025 & 2033
- Figure 19: South America Surgical Robotics Revenue (billion), by Types 2025 & 2033
- Figure 20: South America Surgical Robotics Volume (K), by Types 2025 & 2033
- Figure 21: South America Surgical Robotics Revenue Share (%), by Types 2025 & 2033
- Figure 22: South America Surgical Robotics Volume Share (%), by Types 2025 & 2033
- Figure 23: South America Surgical Robotics Revenue (billion), by Country 2025 & 2033
- Figure 24: South America Surgical Robotics Volume (K), by Country 2025 & 2033
- Figure 25: South America Surgical Robotics Revenue Share (%), by Country 2025 & 2033
- Figure 26: South America Surgical Robotics Volume Share (%), by Country 2025 & 2033
- Figure 27: Europe Surgical Robotics Revenue (billion), by Application 2025 & 2033
- Figure 28: Europe Surgical Robotics Volume (K), by Application 2025 & 2033
- Figure 29: Europe Surgical Robotics Revenue Share (%), by Application 2025 & 2033
- Figure 30: Europe Surgical Robotics Volume Share (%), by Application 2025 & 2033
- Figure 31: Europe Surgical Robotics Revenue (billion), by Types 2025 & 2033
- Figure 32: Europe Surgical Robotics Volume (K), by Types 2025 & 2033
- Figure 33: Europe Surgical Robotics Revenue Share (%), by Types 2025 & 2033
- Figure 34: Europe Surgical Robotics Volume Share (%), by Types 2025 & 2033
- Figure 35: Europe Surgical Robotics Revenue (billion), by Country 2025 & 2033
- Figure 36: Europe Surgical Robotics Volume (K), by Country 2025 & 2033
- Figure 37: Europe Surgical Robotics Revenue Share (%), by Country 2025 & 2033
- Figure 38: Europe Surgical Robotics Volume Share (%), by Country 2025 & 2033
- Figure 39: Middle East & Africa Surgical Robotics Revenue (billion), by Application 2025 & 2033
- Figure 40: Middle East & Africa Surgical Robotics Volume (K), by Application 2025 & 2033
- Figure 41: Middle East & Africa Surgical Robotics Revenue Share (%), by Application 2025 & 2033
- Figure 42: Middle East & Africa Surgical Robotics Volume Share (%), by Application 2025 & 2033
- Figure 43: Middle East & Africa Surgical Robotics Revenue (billion), by Types 2025 & 2033
- Figure 44: Middle East & Africa Surgical Robotics Volume (K), by Types 2025 & 2033
- Figure 45: Middle East & Africa Surgical Robotics Revenue Share (%), by Types 2025 & 2033
- Figure 46: Middle East & Africa Surgical Robotics Volume Share (%), by Types 2025 & 2033
- Figure 47: Middle East & Africa Surgical Robotics Revenue (billion), by Country 2025 & 2033
- Figure 48: Middle East & Africa Surgical Robotics Volume (K), by Country 2025 & 2033
- Figure 49: Middle East & Africa Surgical Robotics Revenue Share (%), by Country 2025 & 2033
- Figure 50: Middle East & Africa Surgical Robotics Volume Share (%), by Country 2025 & 2033
- Figure 51: Asia Pacific Surgical Robotics Revenue (billion), by Application 2025 & 2033
- Figure 52: Asia Pacific Surgical Robotics Volume (K), by Application 2025 & 2033
- Figure 53: Asia Pacific Surgical Robotics Revenue Share (%), by Application 2025 & 2033
- Figure 54: Asia Pacific Surgical Robotics Volume Share (%), by Application 2025 & 2033
- Figure 55: Asia Pacific Surgical Robotics Revenue (billion), by Types 2025 & 2033
- Figure 56: Asia Pacific Surgical Robotics Volume (K), by Types 2025 & 2033
- Figure 57: Asia Pacific Surgical Robotics Revenue Share (%), by Types 2025 & 2033
- Figure 58: Asia Pacific Surgical Robotics Volume Share (%), by Types 2025 & 2033
- Figure 59: Asia Pacific Surgical Robotics Revenue (billion), by Country 2025 & 2033
- Figure 60: Asia Pacific Surgical Robotics Volume (K), by Country 2025 & 2033
- Figure 61: Asia Pacific Surgical Robotics Revenue Share (%), by Country 2025 & 2033
- Figure 62: Asia Pacific Surgical Robotics Volume Share (%), by Country 2025 & 2033
List of Tables
- Table 1: Global Surgical Robotics Revenue billion Forecast, by Application 2020 & 2033
- Table 2: Global Surgical Robotics Volume K Forecast, by Application 2020 & 2033
- Table 3: Global Surgical Robotics Revenue billion Forecast, by Types 2020 & 2033
- Table 4: Global Surgical Robotics Volume K Forecast, by Types 2020 & 2033
- Table 5: Global Surgical Robotics Revenue billion Forecast, by Region 2020 & 2033
- Table 6: Global Surgical Robotics Volume K Forecast, by Region 2020 & 2033
- Table 7: Global Surgical Robotics Revenue billion Forecast, by Application 2020 & 2033
- Table 8: Global Surgical Robotics Volume K Forecast, by Application 2020 & 2033
- Table 9: Global Surgical Robotics Revenue billion Forecast, by Types 2020 & 2033
- Table 10: Global Surgical Robotics Volume K Forecast, by Types 2020 & 2033
- Table 11: Global Surgical Robotics Revenue billion Forecast, by Country 2020 & 2033
- Table 12: Global Surgical Robotics Volume K Forecast, by Country 2020 & 2033
- Table 13: United States Surgical Robotics Revenue (billion) Forecast, by Application 2020 & 2033
- Table 14: United States Surgical Robotics Volume (K) Forecast, by Application 2020 & 2033
- Table 15: Canada Surgical Robotics Revenue (billion) Forecast, by Application 2020 & 2033
- Table 16: Canada Surgical Robotics Volume (K) Forecast, by Application 2020 & 2033
- Table 17: Mexico Surgical Robotics Revenue (billion) Forecast, by Application 2020 & 2033
- Table 18: Mexico Surgical Robotics Volume (K) Forecast, by Application 2020 & 2033
- Table 19: Global Surgical Robotics Revenue billion Forecast, by Application 2020 & 2033
- Table 20: Global Surgical Robotics Volume K Forecast, by Application 2020 & 2033
- Table 21: Global Surgical Robotics Revenue billion Forecast, by Types 2020 & 2033
- Table 22: Global Surgical Robotics Volume K Forecast, by Types 2020 & 2033
- Table 23: Global Surgical Robotics Revenue billion Forecast, by Country 2020 & 2033
- Table 24: Global Surgical Robotics Volume K Forecast, by Country 2020 & 2033
- Table 25: Brazil Surgical Robotics Revenue (billion) Forecast, by Application 2020 & 2033
- Table 26: Brazil Surgical Robotics Volume (K) Forecast, by Application 2020 & 2033
- Table 27: Argentina Surgical Robotics Revenue (billion) Forecast, by Application 2020 & 2033
- Table 28: Argentina Surgical Robotics Volume (K) Forecast, by Application 2020 & 2033
- Table 29: Rest of South America Surgical Robotics Revenue (billion) Forecast, by Application 2020 & 2033
- Table 30: Rest of South America Surgical Robotics Volume (K) Forecast, by Application 2020 & 2033
- Table 31: Global Surgical Robotics Revenue billion Forecast, by Application 2020 & 2033
- Table 32: Global Surgical Robotics Volume K Forecast, by Application 2020 & 2033
- Table 33: Global Surgical Robotics Revenue billion Forecast, by Types 2020 & 2033
- Table 34: Global Surgical Robotics Volume K Forecast, by Types 2020 & 2033
- Table 35: Global Surgical Robotics Revenue billion Forecast, by Country 2020 & 2033
- Table 36: Global Surgical Robotics Volume K Forecast, by Country 2020 & 2033
- Table 37: United Kingdom Surgical Robotics Revenue (billion) Forecast, by Application 2020 & 2033
- Table 38: United Kingdom Surgical Robotics Volume (K) Forecast, by Application 2020 & 2033
- Table 39: Germany Surgical Robotics Revenue (billion) Forecast, by Application 2020 & 2033
- Table 40: Germany Surgical Robotics Volume (K) Forecast, by Application 2020 & 2033
- Table 41: France Surgical Robotics Revenue (billion) Forecast, by Application 2020 & 2033
- Table 42: France Surgical Robotics Volume (K) Forecast, by Application 2020 & 2033
- Table 43: Italy Surgical Robotics Revenue (billion) Forecast, by Application 2020 & 2033
- Table 44: Italy Surgical Robotics Volume (K) Forecast, by Application 2020 & 2033
- Table 45: Spain Surgical Robotics Revenue (billion) Forecast, by Application 2020 & 2033
- Table 46: Spain Surgical Robotics Volume (K) Forecast, by Application 2020 & 2033
- Table 47: Russia Surgical Robotics Revenue (billion) Forecast, by Application 2020 & 2033
- Table 48: Russia Surgical Robotics Volume (K) Forecast, by Application 2020 & 2033
- Table 49: Benelux Surgical Robotics Revenue (billion) Forecast, by Application 2020 & 2033
- Table 50: Benelux Surgical Robotics Volume (K) Forecast, by Application 2020 & 2033
- Table 51: Nordics Surgical Robotics Revenue (billion) Forecast, by Application 2020 & 2033
- Table 52: Nordics Surgical Robotics Volume (K) Forecast, by Application 2020 & 2033
- Table 53: Rest of Europe Surgical Robotics Revenue (billion) Forecast, by Application 2020 & 2033
- Table 54: Rest of Europe Surgical Robotics Volume (K) Forecast, by Application 2020 & 2033
- Table 55: Global Surgical Robotics Revenue billion Forecast, by Application 2020 & 2033
- Table 56: Global Surgical Robotics Volume K Forecast, by Application 2020 & 2033
- Table 57: Global Surgical Robotics Revenue billion Forecast, by Types 2020 & 2033
- Table 58: Global Surgical Robotics Volume K Forecast, by Types 2020 & 2033
- Table 59: Global Surgical Robotics Revenue billion Forecast, by Country 2020 & 2033
- Table 60: Global Surgical Robotics Volume K Forecast, by Country 2020 & 2033
- Table 61: Turkey Surgical Robotics Revenue (billion) Forecast, by Application 2020 & 2033
- Table 62: Turkey Surgical Robotics Volume (K) Forecast, by Application 2020 & 2033
- Table 63: Israel Surgical Robotics Revenue (billion) Forecast, by Application 2020 & 2033
- Table 64: Israel Surgical Robotics Volume (K) Forecast, by Application 2020 & 2033
- Table 65: GCC Surgical Robotics Revenue (billion) Forecast, by Application 2020 & 2033
- Table 66: GCC Surgical Robotics Volume (K) Forecast, by Application 2020 & 2033
- Table 67: North Africa Surgical Robotics Revenue (billion) Forecast, by Application 2020 & 2033
- Table 68: North Africa Surgical Robotics Volume (K) Forecast, by Application 2020 & 2033
- Table 69: South Africa Surgical Robotics Revenue (billion) Forecast, by Application 2020 & 2033
- Table 70: South Africa Surgical Robotics Volume (K) Forecast, by Application 2020 & 2033
- Table 71: Rest of Middle East & Africa Surgical Robotics Revenue (billion) Forecast, by Application 2020 & 2033
- Table 72: Rest of Middle East & Africa Surgical Robotics Volume (K) Forecast, by Application 2020 & 2033
- Table 73: Global Surgical Robotics Revenue billion Forecast, by Application 2020 & 2033
- Table 74: Global Surgical Robotics Volume K Forecast, by Application 2020 & 2033
- Table 75: Global Surgical Robotics Revenue billion Forecast, by Types 2020 & 2033
- Table 76: Global Surgical Robotics Volume K Forecast, by Types 2020 & 2033
- Table 77: Global Surgical Robotics Revenue billion Forecast, by Country 2020 & 2033
- Table 78: Global Surgical Robotics Volume K Forecast, by Country 2020 & 2033
- Table 79: China Surgical Robotics Revenue (billion) Forecast, by Application 2020 & 2033
- Table 80: China Surgical Robotics Volume (K) Forecast, by Application 2020 & 2033
- Table 81: India Surgical Robotics Revenue (billion) Forecast, by Application 2020 & 2033
- Table 82: India Surgical Robotics Volume (K) Forecast, by Application 2020 & 2033
- Table 83: Japan Surgical Robotics Revenue (billion) Forecast, by Application 2020 & 2033
- Table 84: Japan Surgical Robotics Volume (K) Forecast, by Application 2020 & 2033
- Table 85: South Korea Surgical Robotics Revenue (billion) Forecast, by Application 2020 & 2033
- Table 86: South Korea Surgical Robotics Volume (K) Forecast, by Application 2020 & 2033
- Table 87: ASEAN Surgical Robotics Revenue (billion) Forecast, by Application 2020 & 2033
- Table 88: ASEAN Surgical Robotics Volume (K) Forecast, by Application 2020 & 2033
- Table 89: Oceania Surgical Robotics Revenue (billion) Forecast, by Application 2020 & 2033
- Table 90: Oceania Surgical Robotics Volume (K) Forecast, by Application 2020 & 2033
- Table 91: Rest of Asia Pacific Surgical Robotics Revenue (billion) Forecast, by Application 2020 & 2033
- Table 92: Rest of Asia Pacific Surgical Robotics Volume (K) Forecast, by Application 2020 & 2033
Frequently Asked Questions
1. What is the projected Compound Annual Growth Rate (CAGR) of the Surgical Robotics?
The projected CAGR is approximately 14.7%.
2. Which companies are prominent players in the Surgical Robotics?
Key companies in the market include Intuitive Surgical, Stryker, Mazor Robotics, Medtech S.A, THINK Surgical, Restoration Robotics, Medrobotics, TransEnterix.
3. What are the main segments of the Surgical Robotics?
The market segments include Application, Types.
4. Can you provide details about the market size?
The market size is estimated to be USD 13.69 billion as of 2022.
5. What are some drivers contributing to market growth?
N/A
6. What are the notable trends driving market growth?
N/A
7. Are there any restraints impacting market growth?
N/A
8. Can you provide examples of recent developments in the market?
N/A
9. What pricing options are available for accessing the report?
Pricing options include single-user, multi-user, and enterprise licenses priced at USD 3950.00, USD 5925.00, and USD 7900.00 respectively.
10. Is the market size provided in terms of value or volume?
The market size is provided in terms of value, measured in billion and volume, measured in K.
11. Are there any specific market keywords associated with the report?
Yes, the market keyword associated with the report is "Surgical Robotics," which aids in identifying and referencing the specific market segment covered.
12. How do I determine which pricing option suits my needs best?
The pricing options vary based on user requirements and access needs. Individual users may opt for single-user licenses, while businesses requiring broader access may choose multi-user or enterprise licenses for cost-effective access to the report.
13. Are there any additional resources or data provided in the Surgical Robotics report?
While the report offers comprehensive insights, it's advisable to review the specific contents or supplementary materials provided to ascertain if additional resources or data are available.
14. How can I stay updated on further developments or reports in the Surgical Robotics?
To stay informed about further developments, trends, and reports in the Surgical Robotics, consider subscribing to industry newsletters, following relevant companies and organizations, or regularly checking reputable industry news sources and publications.
Methodology
Step 1 - Identification of Relevant Samples Size from Population Database


Step 2 - Approaches for Defining Global Market Size (Value, Volume* & Price*)

Note*: In applicable scenarios
Step 3 - Data Sources
Primary Research
- Web Analytics
- Survey Reports
- Research Institute
- Latest Research Reports
- Opinion Leaders
Secondary Research
- Annual Reports
- White Paper
- Latest Press Release
- Industry Association
- Paid Database
- Investor Presentations

Step 4 - Data Triangulation
Involves using different sources of information in order to increase the validity of a study
These sources are likely to be stakeholders in a program - participants, other researchers, program staff, other community members, and so on.
Then we put all data in single framework & apply various statistical tools to find out the dynamic on the market.
During the analysis stage, feedback from the stakeholder groups would be compared to determine areas of agreement as well as areas of divergence