

Key Insights
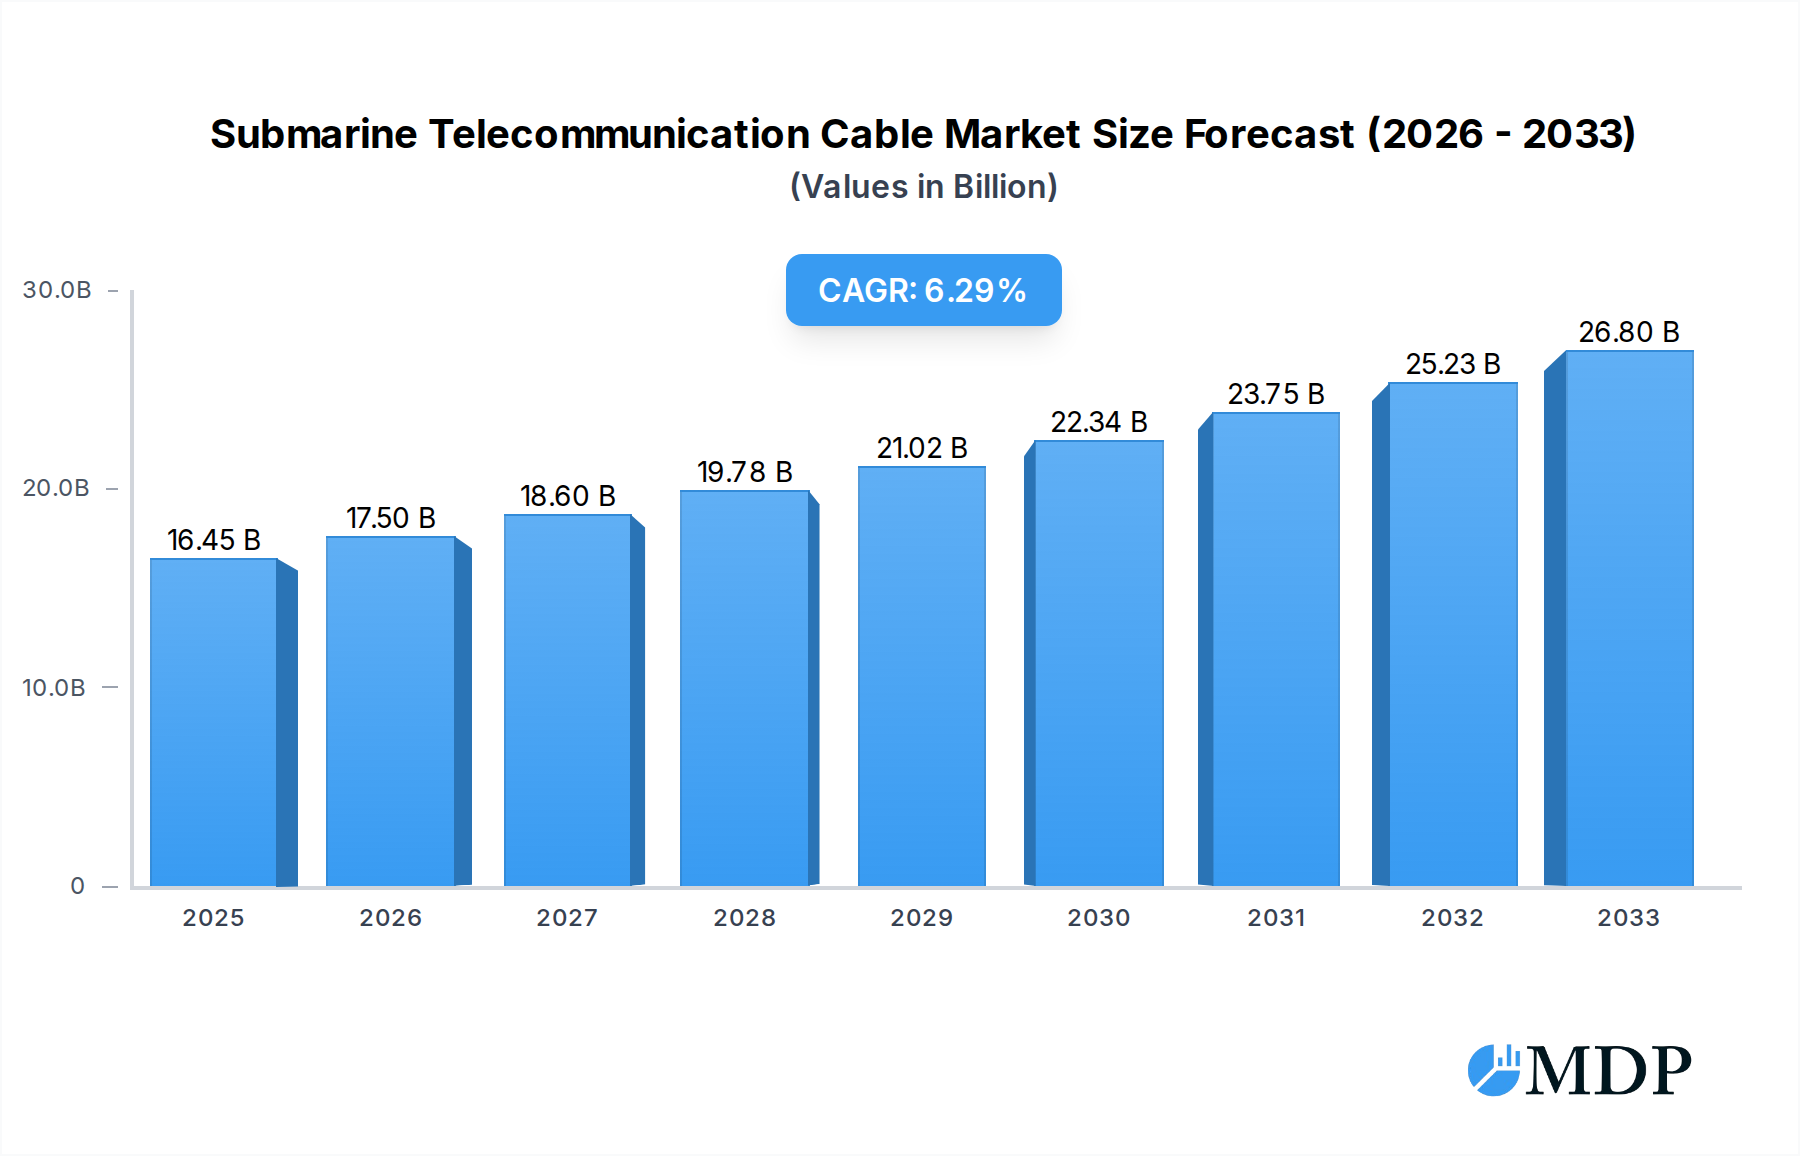
The global Submarine Telecommunication Cable market is poised for significant expansion, with a current market size of $16,450 million and a projected Compound Annual Growth Rate (CAGR) of 6.2% during the forecast period of 2025-2033. This robust growth is primarily fueled by the escalating demand for enhanced global connectivity, driven by the proliferation of cloud computing, the burgeoning Internet of Things (IoT) ecosystem, and the continuous evolution of data-intensive applications like streaming services and online gaming. The increasing investments in undersea network infrastructure by telecommunication companies, hyperscale data centers, and content providers are also critical growth accelerators. Furthermore, the ongoing development of 5G networks necessitates higher bandwidth and lower latency, making submarine cables indispensable for supporting the massive data flows required. Emerging markets, particularly in the Asia Pacific and parts of Africa, are witnessing substantial infrastructure development, further bolstering market expansion.

Submarine Telecommunication Cable Market Size (In Billion)
The market segmentation reveals a dynamic landscape. The Application segment is broadly categorized into Shallow Sea and Deep Sea, with both areas experiencing consistent demand for reliable and high-capacity connectivity. In terms of Types, the market is dominated by Optical Fiber Cables due to their superior bandwidth and data transmission capabilities, though Copper Cables still hold relevance for specific applications. Key players such as Prysmian, Nexans, and Corning are at the forefront of innovation, investing heavily in research and development to create more robust, higher-capacity, and environmentally resilient cable solutions. Trends such as the deployment of higher-performance optical fibers and the development of more efficient installation techniques are shaping the market. While the growth is strong, potential restraints include the high initial capital expenditure for cable laying and maintenance, the complexities associated with subsea installations, and the impact of geopolitical factors on international cable projects. However, the overarching need for global data exchange and the relentless pursuit of improved digital infrastructure are expected to propel the submarine telecommunication cable market to new heights.
Submarine Telecommunication Cable Company Market Share
Submarine Telecommunication Cable Market Dynamics & Concentration
The global submarine telecommunication cable market is characterized by a moderately concentrated landscape, with a handful of major players dominating the manufacturing and deployment sectors. Companies like Prysmian, Nexans, and SubCom hold significant market share, driven by their extensive manufacturing capabilities and established relationships with major telecommunication operators and content providers. Innovation drivers are primarily focused on increasing cable capacity, improving signal transmission efficiency, and enhancing durability for deep-sea environments. Regulatory frameworks, particularly concerning seabed rights, environmental impact assessments, and international data sovereignty, play a crucial role in shaping project approvals and deployment timelines. Product substitutes, such as satellite communication, are largely confined to niche applications and do not pose a significant threat to the high-bandwidth, low-latency demands met by submarine cables. End-user trends are dominated by the insatiable demand for data, fueled by cloud computing, streaming services, and the burgeoning Internet of Things (IoT). Mergers and acquisitions (M&A) activities are sporadic but significant, often aimed at consolidating market position, acquiring specialized technologies, or expanding geographic reach. For instance, a recent M&A deal in 2023 involved a transaction valued at approximately $2,000 million, consolidating supply chains and bolstering integrated service offerings. Market share for the top five manufacturers is estimated to be around 70%, with approximately 15 significant M&A deals recorded between 2019 and 2024, totaling an estimated value of $8,000 million.
Submarine Telecommunication Cable Industry Trends & Analysis
The submarine telecommunication cable industry is experiencing robust growth, fueled by an ever-increasing global demand for high-speed, reliable data connectivity. The market is projected to expand at a Compound Annual Growth Rate (CAGR) of approximately 8.5% from 2025 to 2033. This expansion is primarily driven by the escalating requirements of data centers, the proliferation of 5G networks, and the continuous growth in cross-border internet traffic. Technological disruptions are at the forefront, with advancements in optical fiber technology leading to higher transmission capacities and longer repeaterless spans. The development of advanced modulation schemes and coherent detection techniques is significantly boosting the data carrying capabilities of existing and new cable systems. Consumer preferences are increasingly leaning towards seamless, low-latency internet experiences, which can only be adequately provided by the high bandwidth offered by submarine cables. This is evident in the growing adoption of high-definition video streaming, online gaming, and virtual reality applications. Competitive dynamics within the industry are characterized by intense competition among established manufacturers and a growing number of new entrants, particularly from Asia. Strategic partnerships and joint ventures are becoming increasingly common as companies collaborate to share risks, access new markets, and leverage complementary technologies. The market penetration of submarine fiber optic cables continues to dominate, accounting for over 95% of all new installations. The total market value is projected to reach over $25,000 million by 2033.
Leading Markets & Segments in Submarine Telecommunication Cable
The global submarine telecommunication cable market exhibits distinct regional dominance and segment preferences, driven by economic development, infrastructure investment, and evolving connectivity needs.
Dominant Regions and Countries
- Asia-Pacific: This region stands out as the leading market due to its rapid economic growth, massive population, and significant investments in digital infrastructure. Countries like China, India, and Southeast Asian nations are experiencing unprecedented demand for international connectivity to support their burgeoning economies and digital industries. Government initiatives promoting digital transformation and cross-border trade further bolster this demand. The region's extensive coastline and numerous island nations necessitate substantial investment in submarine cable infrastructure.
- North America: The United States, in particular, remains a critical market, driven by its advanced technological ecosystem, massive data center hubs, and significant cloud service providers. The ongoing deployment of intercontinental cables connecting North America to Europe and Asia fuels consistent demand. Regulatory support for infrastructure development and strong private sector investment are key drivers.
- Europe: Europe's mature telecommunications market, coupled with its strategic location as a bridge between North America and Asia, makes it a vital hub for submarine cables. The increasing adoption of cloud services, the expansion of 5G, and efforts to enhance intra-European connectivity contribute to sustained demand. The presence of major telecommunication operators and financial centers further reinforces its importance.
Dominant Segments
- Application: Deep Sea
- Drivers: The increasing need for high-capacity, long-haul international connectivity to support global data exchange between continents is the primary driver. The growing number of subsea data centers and the expansion of cloud computing services necessitate robust deep-sea cable networks. Environmental resilience and the ability to withstand extreme conditions are paramount for deep-sea deployments.
- Dominance Analysis: Deep-sea cables represent the backbone of global telecommunications, enabling the internet as we know it. Their deployment is complex and capital-intensive, leading to a concentrated market dominated by a few specialized manufacturers and installers. The strategic importance of these cables for national security and economic competitiveness further solidifies their dominance. The value of deep-sea cable projects consistently exceeds that of shallow-sea deployments due to their complexity and length.
- Types: Optical Fiber Cable
- Drivers: The unparalleled bandwidth, speed, and capacity offered by optical fiber technology are the fundamental reasons for its overwhelming dominance. Optical fiber cables can transmit vast amounts of data over long distances with minimal signal loss, making them ideal for the demanding requirements of telecommunications.
- Dominance Analysis: Optical fiber cables have virtually replaced copper cables for long-haul and high-capacity telecommunication needs. Their ability to support multiple wavelengths of light simultaneously (Wavelength Division Multiplexing - WDM) allows for exponential increases in data throughput. The continuous innovation in fiber optic technology, leading to higher bit rates and reduced latency, further cements its position as the undisputed leader in the submarine telecommunication cable market. The market share of optical fiber cables is over 99% for new installations.
- Application: Shallow Sea
- Drivers: Shorter-distance connectivity, inter-island communication, and connections to coastal regions and offshore facilities drive demand for shallow-sea cables. These cables are crucial for regional networks, supporting local internet access, industrial applications, and offshore energy infrastructure.
- Dominance Analysis: While not as high-capacity as deep-sea cables, shallow-sea deployments are essential for completing regional connectivity networks. They often serve as feeders to larger transoceanic systems and are critical for connecting less accessible areas to the broader internet. The deployment is generally less complex and less expensive than deep-sea installations, making them more accessible for regional projects.
- Types: Others (e.g., Copper Cable)
- Drivers: While largely obsolete for high-speed data, copper cables might still find niche applications in specialized industrial communication systems or power delivery components integrated with some telecommunication cables.
- Dominance Analysis: The market share for "other" types of cables, primarily copper, is negligible in the context of modern submarine telecommunication. Their limited bandwidth and susceptibility to electromagnetic interference make them unsuitable for the primary data transmission needs of the industry.
Submarine Telecommunication Cable Product Developments
Recent product developments in the submarine telecommunication cable market are focused on enhancing capacity, improving reliability, and reducing deployment costs. Manufacturers are introducing cables with higher fiber counts, enabling multi-terabit per second transmission capacities. Innovations in optical amplifier technology and repeater design are extending the reach of these cables, reducing the need for frequent amplification points. Furthermore, advancements in cable material science are leading to more robust and environmentally resistant designs, capable of withstanding harsh subsea conditions. These developments are crucial for supporting the exponential growth in global data traffic and the expansion of digital services worldwide, offering significant competitive advantages in terms of performance and long-term operational efficiency.
Key Drivers of Submarine Telecommunication Cable Growth
The submarine telecommunication cable market's growth is propelled by several key factors. The insatiable global demand for data, driven by cloud computing, video streaming, and the Internet of Things (IoT), is a primary catalyst. The ongoing expansion of 5G mobile networks necessitates higher bandwidth backhaul solutions, which submarine cables provide. Significant investments in digital infrastructure by governments and enterprises worldwide, aiming to bridge the digital divide and foster economic growth, are also crucial. Furthermore, the development of new subsea data centers and the increasing need for low-latency intercontinental connectivity for financial transactions and enterprise applications are significant growth accelerators.
Challenges in the Submarine Telecommunication Cable Market
Despite robust growth, the submarine telecommunication cable market faces several challenges. The immense capital expenditure required for cable manufacturing and deployment remains a significant barrier, with projects often costing hundreds of millions to billions of dollars. Navigating complex and lengthy regulatory approval processes, including environmental impact assessments and seabed rights acquisition across multiple jurisdictions, can lead to considerable project delays. Supply chain disruptions, particularly for specialized components and raw materials, can impact manufacturing timelines and costs. Intense competition among a few major players can lead to price pressures, and the risk of accidental damage from fishing activities or ship anchors requires continuous monitoring and repair efforts.
Emerging Opportunities in Submarine Telecommunication Cable
Emerging opportunities in the submarine telecommunication cable market are ripe for innovation and strategic expansion. The development of high-capacity, low-latency interconnections between major cloud hubs and emerging markets presents a significant growth avenue. Advancements in subsea power transmission cables and the integration of these with telecommunication infrastructure offer synergistic opportunities. The exploration of new cable routes, particularly in under-served regions and emerging economies, holds substantial potential. Furthermore, the increasing adoption of AI and machine learning for cable network monitoring and predictive maintenance can lead to operational efficiencies and new service offerings. Strategic partnerships for research and development in next-generation optical technologies and novel cable designs will also drive future market expansion.
Leading Players in the Submarine Telecommunication Cable Sector
- Alcatel-Lucent
- Prysmian
- TESubCom
- Nexans
- NEC
- Corning
- HTGD
- Fujikura
- CommScope
- ZTT
- General Cable
- Belden
- Aksh Optifiber
- Finolex Cables
Key Milestones in Submarine Telecommunication Cable Industry
- 2019: Launch of a new high-capacity transpacific cable system, significantly increasing intercontinental bandwidth by approximately 20% over previous systems.
- 2020: Prysmian Group announces a significant acquisition, consolidating its market leadership and expanding its manufacturing capacity by an estimated 15%.
- 2021: Development of novel repeater technology enabling longer unrepeatered spans, reducing overall project costs and complexity for certain routes.
- 2022: Significant investment in subsea fiber optic cable manufacturing facilities in Asia, reflecting the growing demand from emerging markets.
- 2023: Introduction of the first commercially viable ultra-deepwater telecommunication cable, designed to withstand extreme pressure and environmental conditions, opening new deployment possibilities.
- 2024: Increased focus on sustainability in cable manufacturing and deployment, with initiatives aimed at reducing carbon footprint and utilizing recycled materials.
Strategic Outlook for Submarine Telecommunication Cable Market
The strategic outlook for the submarine telecommunication cable market remains exceptionally strong, driven by the persistent global demand for data and the critical role these cables play in the digital economy. Growth accelerators include the continued expansion of cloud infrastructure, the widespread adoption of 5G and future wireless technologies, and the increasing interconnectivity requirements of emerging markets. Companies are strategically focusing on technological innovation to increase cable capacity and reduce latency, alongside efforts to optimize deployment processes and enhance the durability of their products. Investment in research and development for next-generation optical technologies and sustainable manufacturing practices will be crucial for maintaining a competitive edge and capitalizing on future market potential.
Submarine Telecommunication Cable Segmentation
-
1. Application
- 1.1. Shallow Sea
- 1.2. Deep Sea
-
2. Types
- 2.1. Optical Fiber Cable
- 2.2. Copper Cable
- 2.3. Others
Submarine Telecommunication Cable Segmentation By Geography
-
1. North America
- 1.1. United States
- 1.2. Canada
- 1.3. Mexico
-
2. South America
- 2.1. Brazil
- 2.2. Argentina
- 2.3. Rest of South America
-
3. Europe
- 3.1. United Kingdom
- 3.2. Germany
- 3.3. France
- 3.4. Italy
- 3.5. Spain
- 3.6. Russia
- 3.7. Benelux
- 3.8. Nordics
- 3.9. Rest of Europe
-
4. Middle East & Africa
- 4.1. Turkey
- 4.2. Israel
- 4.3. GCC
- 4.4. North Africa
- 4.5. South Africa
- 4.6. Rest of Middle East & Africa
-
5. Asia Pacific
- 5.1. China
- 5.2. India
- 5.3. Japan
- 5.4. South Korea
- 5.5. ASEAN
- 5.6. Oceania
- 5.7. Rest of Asia Pacific
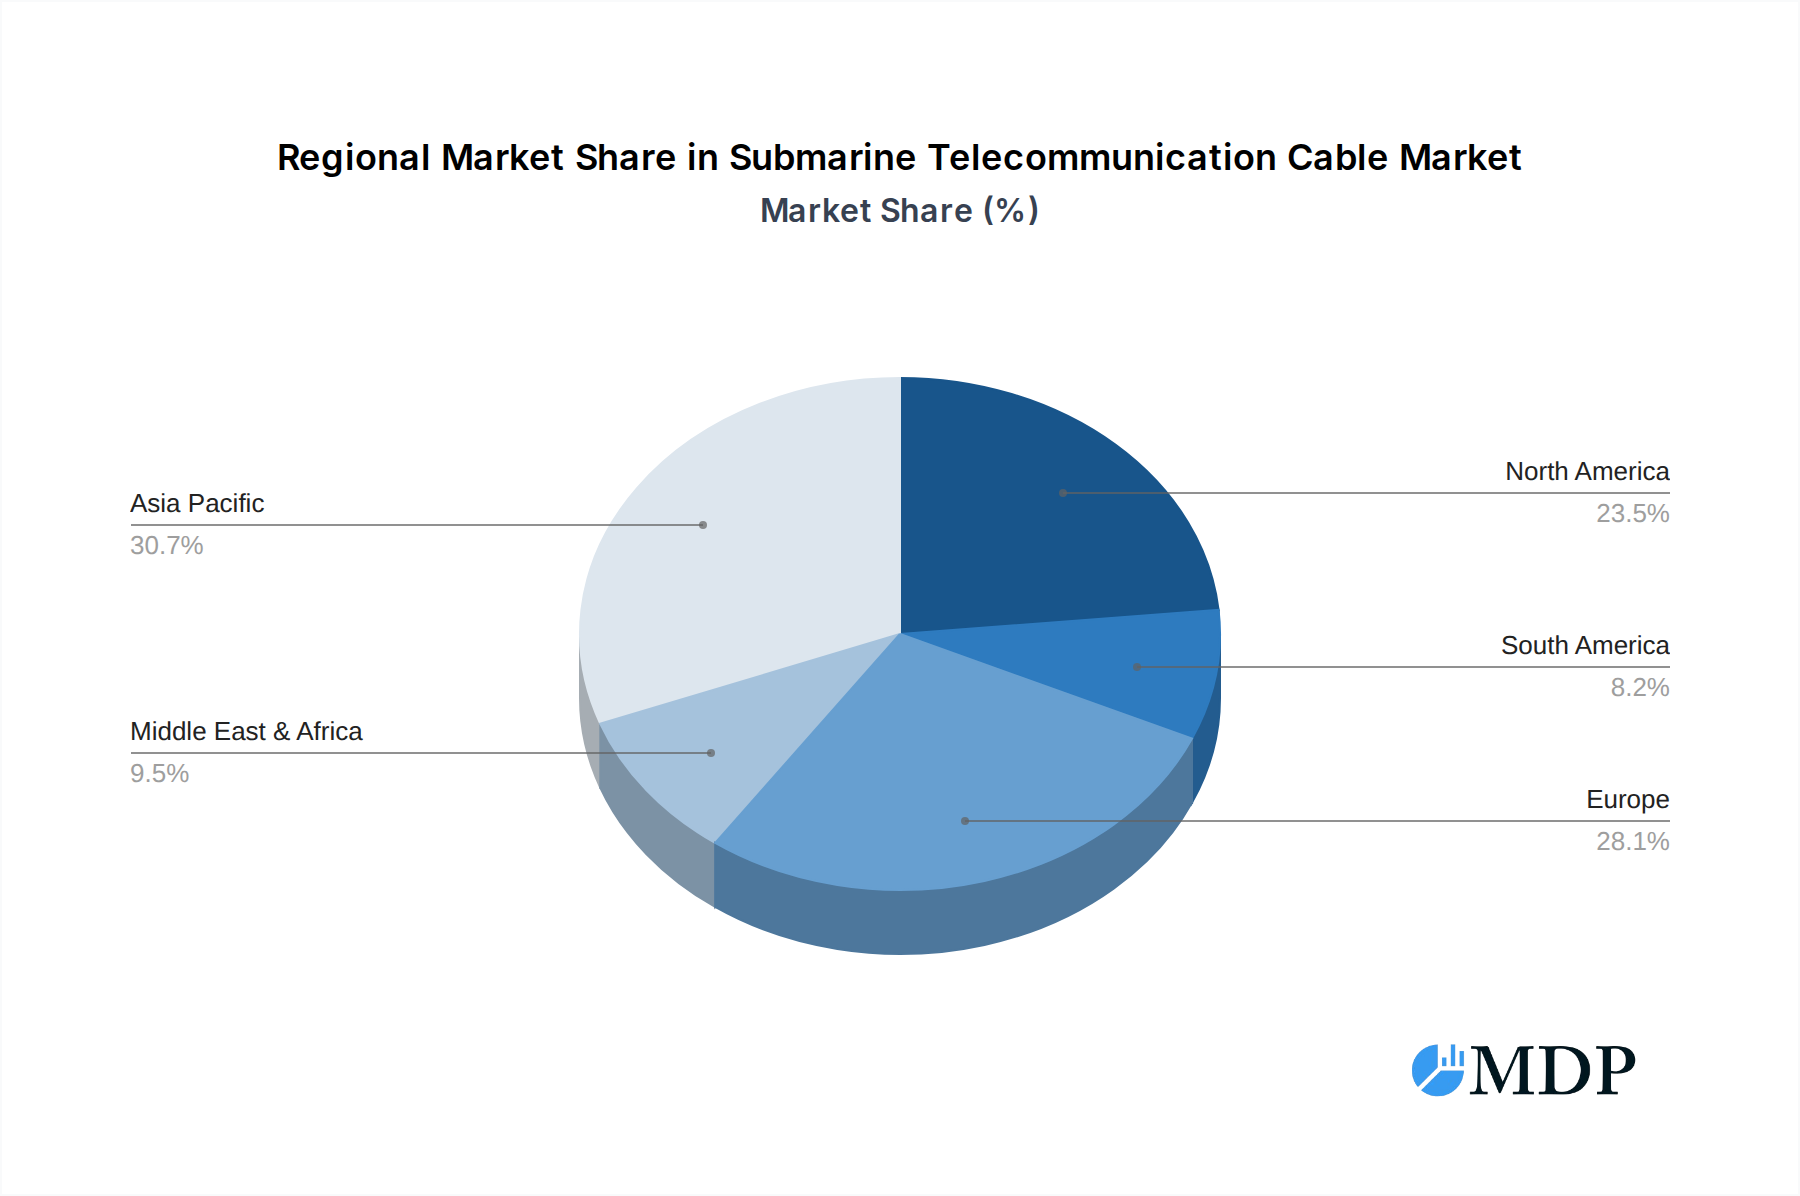
Submarine Telecommunication Cable Regional Market Share
Geographic Coverage of Submarine Telecommunication Cable
Submarine Telecommunication Cable REPORT HIGHLIGHTS
| Aspects | Details |
|---|---|
| Study Period | 2020-2034 |
| Base Year | 2025 |
| Estimated Year | 2026 |
| Forecast Period | 2026-2034 |
| Historical Period | 2020-2025 |
| Growth Rate | CAGR of 6.2% from 2020-2034 |
| Segmentation |
|
Table of Contents
- 1. Introduction
- 1.1. Research Scope
- 1.2. Market Segmentation
- 1.3. Research Methodology
- 1.4. Definitions and Assumptions
- 2. Executive Summary
- 2.1. Introduction
- 3. Market Dynamics
- 3.1. Introduction
- 3.2. Market Drivers
- 3.3. Market Restrains
- 3.4. Market Trends
- 4. Market Factor Analysis
- 4.1. Porters Five Forces
- 4.2. Supply/Value Chain
- 4.3. PESTEL analysis
- 4.4. Market Entropy
- 4.5. Patent/Trademark Analysis
- 5. Global Submarine Telecommunication Cable Analysis, Insights and Forecast, 2020-2032
- 5.1. Market Analysis, Insights and Forecast - by Application
- 5.1.1. Shallow Sea
- 5.1.2. Deep Sea
- 5.2. Market Analysis, Insights and Forecast - by Types
- 5.2.1. Optical Fiber Cable
- 5.2.2. Copper Cable
- 5.2.3. Others
- 5.3. Market Analysis, Insights and Forecast - by Region
- 5.3.1. North America
- 5.3.2. South America
- 5.3.3. Europe
- 5.3.4. Middle East & Africa
- 5.3.5. Asia Pacific
- 5.1. Market Analysis, Insights and Forecast - by Application
- 6. North America Submarine Telecommunication Cable Analysis, Insights and Forecast, 2020-2032
- 6.1. Market Analysis, Insights and Forecast - by Application
- 6.1.1. Shallow Sea
- 6.1.2. Deep Sea
- 6.2. Market Analysis, Insights and Forecast - by Types
- 6.2.1. Optical Fiber Cable
- 6.2.2. Copper Cable
- 6.2.3. Others
- 6.1. Market Analysis, Insights and Forecast - by Application
- 7. South America Submarine Telecommunication Cable Analysis, Insights and Forecast, 2020-2032
- 7.1. Market Analysis, Insights and Forecast - by Application
- 7.1.1. Shallow Sea
- 7.1.2. Deep Sea
- 7.2. Market Analysis, Insights and Forecast - by Types
- 7.2.1. Optical Fiber Cable
- 7.2.2. Copper Cable
- 7.2.3. Others
- 7.1. Market Analysis, Insights and Forecast - by Application
- 8. Europe Submarine Telecommunication Cable Analysis, Insights and Forecast, 2020-2032
- 8.1. Market Analysis, Insights and Forecast - by Application
- 8.1.1. Shallow Sea
- 8.1.2. Deep Sea
- 8.2. Market Analysis, Insights and Forecast - by Types
- 8.2.1. Optical Fiber Cable
- 8.2.2. Copper Cable
- 8.2.3. Others
- 8.1. Market Analysis, Insights and Forecast - by Application
- 9. Middle East & Africa Submarine Telecommunication Cable Analysis, Insights and Forecast, 2020-2032
- 9.1. Market Analysis, Insights and Forecast - by Application
- 9.1.1. Shallow Sea
- 9.1.2. Deep Sea
- 9.2. Market Analysis, Insights and Forecast - by Types
- 9.2.1. Optical Fiber Cable
- 9.2.2. Copper Cable
- 9.2.3. Others
- 9.1. Market Analysis, Insights and Forecast - by Application
- 10. Asia Pacific Submarine Telecommunication Cable Analysis, Insights and Forecast, 2020-2032
- 10.1. Market Analysis, Insights and Forecast - by Application
- 10.1.1. Shallow Sea
- 10.1.2. Deep Sea
- 10.2. Market Analysis, Insights and Forecast - by Types
- 10.2.1. Optical Fiber Cable
- 10.2.2. Copper Cable
- 10.2.3. Others
- 10.1. Market Analysis, Insights and Forecast - by Application
- 11. Competitive Analysis
- 11.1. Global Market Share Analysis 2025
- 11.2. Company Profiles
- 11.2.1 Alcatel-Lucent
- 11.2.1.1. Overview
- 11.2.1.2. Products
- 11.2.1.3. SWOT Analysis
- 11.2.1.4. Recent Developments
- 11.2.1.5. Financials (Based on Availability)
- 11.2.2 Prysmian
- 11.2.2.1. Overview
- 11.2.2.2. Products
- 11.2.2.3. SWOT Analysis
- 11.2.2.4. Recent Developments
- 11.2.2.5. Financials (Based on Availability)
- 11.2.3 TESubCom
- 11.2.3.1. Overview
- 11.2.3.2. Products
- 11.2.3.3. SWOT Analysis
- 11.2.3.4. Recent Developments
- 11.2.3.5. Financials (Based on Availability)
- 11.2.4 Nexans
- 11.2.4.1. Overview
- 11.2.4.2. Products
- 11.2.4.3. SWOT Analysis
- 11.2.4.4. Recent Developments
- 11.2.4.5. Financials (Based on Availability)
- 11.2.5 NEC
- 11.2.5.1. Overview
- 11.2.5.2. Products
- 11.2.5.3. SWOT Analysis
- 11.2.5.4. Recent Developments
- 11.2.5.5. Financials (Based on Availability)
- 11.2.6 Corning
- 11.2.6.1. Overview
- 11.2.6.2. Products
- 11.2.6.3. SWOT Analysis
- 11.2.6.4. Recent Developments
- 11.2.6.5. Financials (Based on Availability)
- 11.2.7 HTGD
- 11.2.7.1. Overview
- 11.2.7.2. Products
- 11.2.7.3. SWOT Analysis
- 11.2.7.4. Recent Developments
- 11.2.7.5. Financials (Based on Availability)
- 11.2.8 Fujikura
- 11.2.8.1. Overview
- 11.2.8.2. Products
- 11.2.8.3. SWOT Analysis
- 11.2.8.4. Recent Developments
- 11.2.8.5. Financials (Based on Availability)
- 11.2.9 CommScope
- 11.2.9.1. Overview
- 11.2.9.2. Products
- 11.2.9.3. SWOT Analysis
- 11.2.9.4. Recent Developments
- 11.2.9.5. Financials (Based on Availability)
- 11.2.10 ZTT
- 11.2.10.1. Overview
- 11.2.10.2. Products
- 11.2.10.3. SWOT Analysis
- 11.2.10.4. Recent Developments
- 11.2.10.5. Financials (Based on Availability)
- 11.2.11 General Cable
- 11.2.11.1. Overview
- 11.2.11.2. Products
- 11.2.11.3. SWOT Analysis
- 11.2.11.4. Recent Developments
- 11.2.11.5. Financials (Based on Availability)
- 11.2.12 Belden
- 11.2.12.1. Overview
- 11.2.12.2. Products
- 11.2.12.3. SWOT Analysis
- 11.2.12.4. Recent Developments
- 11.2.12.5. Financials (Based on Availability)
- 11.2.13 Aksh Optifiber
- 11.2.13.1. Overview
- 11.2.13.2. Products
- 11.2.13.3. SWOT Analysis
- 11.2.13.4. Recent Developments
- 11.2.13.5. Financials (Based on Availability)
- 11.2.14 Finolex Cables
- 11.2.14.1. Overview
- 11.2.14.2. Products
- 11.2.14.3. SWOT Analysis
- 11.2.14.4. Recent Developments
- 11.2.14.5. Financials (Based on Availability)
- 11.2.1 Alcatel-Lucent
List of Figures
- Figure 1: Global Submarine Telecommunication Cable Revenue Breakdown (million, %) by Region 2025 & 2033
- Figure 2: Global Submarine Telecommunication Cable Volume Breakdown (K, %) by Region 2025 & 2033
- Figure 3: North America Submarine Telecommunication Cable Revenue (million), by Application 2025 & 2033
- Figure 4: North America Submarine Telecommunication Cable Volume (K), by Application 2025 & 2033
- Figure 5: North America Submarine Telecommunication Cable Revenue Share (%), by Application 2025 & 2033
- Figure 6: North America Submarine Telecommunication Cable Volume Share (%), by Application 2025 & 2033
- Figure 7: North America Submarine Telecommunication Cable Revenue (million), by Types 2025 & 2033
- Figure 8: North America Submarine Telecommunication Cable Volume (K), by Types 2025 & 2033
- Figure 9: North America Submarine Telecommunication Cable Revenue Share (%), by Types 2025 & 2033
- Figure 10: North America Submarine Telecommunication Cable Volume Share (%), by Types 2025 & 2033
- Figure 11: North America Submarine Telecommunication Cable Revenue (million), by Country 2025 & 2033
- Figure 12: North America Submarine Telecommunication Cable Volume (K), by Country 2025 & 2033
- Figure 13: North America Submarine Telecommunication Cable Revenue Share (%), by Country 2025 & 2033
- Figure 14: North America Submarine Telecommunication Cable Volume Share (%), by Country 2025 & 2033
- Figure 15: South America Submarine Telecommunication Cable Revenue (million), by Application 2025 & 2033
- Figure 16: South America Submarine Telecommunication Cable Volume (K), by Application 2025 & 2033
- Figure 17: South America Submarine Telecommunication Cable Revenue Share (%), by Application 2025 & 2033
- Figure 18: South America Submarine Telecommunication Cable Volume Share (%), by Application 2025 & 2033
- Figure 19: South America Submarine Telecommunication Cable Revenue (million), by Types 2025 & 2033
- Figure 20: South America Submarine Telecommunication Cable Volume (K), by Types 2025 & 2033
- Figure 21: South America Submarine Telecommunication Cable Revenue Share (%), by Types 2025 & 2033
- Figure 22: South America Submarine Telecommunication Cable Volume Share (%), by Types 2025 & 2033
- Figure 23: South America Submarine Telecommunication Cable Revenue (million), by Country 2025 & 2033
- Figure 24: South America Submarine Telecommunication Cable Volume (K), by Country 2025 & 2033
- Figure 25: South America Submarine Telecommunication Cable Revenue Share (%), by Country 2025 & 2033
- Figure 26: South America Submarine Telecommunication Cable Volume Share (%), by Country 2025 & 2033
- Figure 27: Europe Submarine Telecommunication Cable Revenue (million), by Application 2025 & 2033
- Figure 28: Europe Submarine Telecommunication Cable Volume (K), by Application 2025 & 2033
- Figure 29: Europe Submarine Telecommunication Cable Revenue Share (%), by Application 2025 & 2033
- Figure 30: Europe Submarine Telecommunication Cable Volume Share (%), by Application 2025 & 2033
- Figure 31: Europe Submarine Telecommunication Cable Revenue (million), by Types 2025 & 2033
- Figure 32: Europe Submarine Telecommunication Cable Volume (K), by Types 2025 & 2033
- Figure 33: Europe Submarine Telecommunication Cable Revenue Share (%), by Types 2025 & 2033
- Figure 34: Europe Submarine Telecommunication Cable Volume Share (%), by Types 2025 & 2033
- Figure 35: Europe Submarine Telecommunication Cable Revenue (million), by Country 2025 & 2033
- Figure 36: Europe Submarine Telecommunication Cable Volume (K), by Country 2025 & 2033
- Figure 37: Europe Submarine Telecommunication Cable Revenue Share (%), by Country 2025 & 2033
- Figure 38: Europe Submarine Telecommunication Cable Volume Share (%), by Country 2025 & 2033
- Figure 39: Middle East & Africa Submarine Telecommunication Cable Revenue (million), by Application 2025 & 2033
- Figure 40: Middle East & Africa Submarine Telecommunication Cable Volume (K), by Application 2025 & 2033
- Figure 41: Middle East & Africa Submarine Telecommunication Cable Revenue Share (%), by Application 2025 & 2033
- Figure 42: Middle East & Africa Submarine Telecommunication Cable Volume Share (%), by Application 2025 & 2033
- Figure 43: Middle East & Africa Submarine Telecommunication Cable Revenue (million), by Types 2025 & 2033
- Figure 44: Middle East & Africa Submarine Telecommunication Cable Volume (K), by Types 2025 & 2033
- Figure 45: Middle East & Africa Submarine Telecommunication Cable Revenue Share (%), by Types 2025 & 2033
- Figure 46: Middle East & Africa Submarine Telecommunication Cable Volume Share (%), by Types 2025 & 2033
- Figure 47: Middle East & Africa Submarine Telecommunication Cable Revenue (million), by Country 2025 & 2033
- Figure 48: Middle East & Africa Submarine Telecommunication Cable Volume (K), by Country 2025 & 2033
- Figure 49: Middle East & Africa Submarine Telecommunication Cable Revenue Share (%), by Country 2025 & 2033
- Figure 50: Middle East & Africa Submarine Telecommunication Cable Volume Share (%), by Country 2025 & 2033
- Figure 51: Asia Pacific Submarine Telecommunication Cable Revenue (million), by Application 2025 & 2033
- Figure 52: Asia Pacific Submarine Telecommunication Cable Volume (K), by Application 2025 & 2033
- Figure 53: Asia Pacific Submarine Telecommunication Cable Revenue Share (%), by Application 2025 & 2033
- Figure 54: Asia Pacific Submarine Telecommunication Cable Volume Share (%), by Application 2025 & 2033
- Figure 55: Asia Pacific Submarine Telecommunication Cable Revenue (million), by Types 2025 & 2033
- Figure 56: Asia Pacific Submarine Telecommunication Cable Volume (K), by Types 2025 & 2033
- Figure 57: Asia Pacific Submarine Telecommunication Cable Revenue Share (%), by Types 2025 & 2033
- Figure 58: Asia Pacific Submarine Telecommunication Cable Volume Share (%), by Types 2025 & 2033
- Figure 59: Asia Pacific Submarine Telecommunication Cable Revenue (million), by Country 2025 & 2033
- Figure 60: Asia Pacific Submarine Telecommunication Cable Volume (K), by Country 2025 & 2033
- Figure 61: Asia Pacific Submarine Telecommunication Cable Revenue Share (%), by Country 2025 & 2033
- Figure 62: Asia Pacific Submarine Telecommunication Cable Volume Share (%), by Country 2025 & 2033
List of Tables
- Table 1: Global Submarine Telecommunication Cable Revenue million Forecast, by Application 2020 & 2033
- Table 2: Global Submarine Telecommunication Cable Volume K Forecast, by Application 2020 & 2033
- Table 3: Global Submarine Telecommunication Cable Revenue million Forecast, by Types 2020 & 2033
- Table 4: Global Submarine Telecommunication Cable Volume K Forecast, by Types 2020 & 2033
- Table 5: Global Submarine Telecommunication Cable Revenue million Forecast, by Region 2020 & 2033
- Table 6: Global Submarine Telecommunication Cable Volume K Forecast, by Region 2020 & 2033
- Table 7: Global Submarine Telecommunication Cable Revenue million Forecast, by Application 2020 & 2033
- Table 8: Global Submarine Telecommunication Cable Volume K Forecast, by Application 2020 & 2033
- Table 9: Global Submarine Telecommunication Cable Revenue million Forecast, by Types 2020 & 2033
- Table 10: Global Submarine Telecommunication Cable Volume K Forecast, by Types 2020 & 2033
- Table 11: Global Submarine Telecommunication Cable Revenue million Forecast, by Country 2020 & 2033
- Table 12: Global Submarine Telecommunication Cable Volume K Forecast, by Country 2020 & 2033
- Table 13: United States Submarine Telecommunication Cable Revenue (million) Forecast, by Application 2020 & 2033
- Table 14: United States Submarine Telecommunication Cable Volume (K) Forecast, by Application 2020 & 2033
- Table 15: Canada Submarine Telecommunication Cable Revenue (million) Forecast, by Application 2020 & 2033
- Table 16: Canada Submarine Telecommunication Cable Volume (K) Forecast, by Application 2020 & 2033
- Table 17: Mexico Submarine Telecommunication Cable Revenue (million) Forecast, by Application 2020 & 2033
- Table 18: Mexico Submarine Telecommunication Cable Volume (K) Forecast, by Application 2020 & 2033
- Table 19: Global Submarine Telecommunication Cable Revenue million Forecast, by Application 2020 & 2033
- Table 20: Global Submarine Telecommunication Cable Volume K Forecast, by Application 2020 & 2033
- Table 21: Global Submarine Telecommunication Cable Revenue million Forecast, by Types 2020 & 2033
- Table 22: Global Submarine Telecommunication Cable Volume K Forecast, by Types 2020 & 2033
- Table 23: Global Submarine Telecommunication Cable Revenue million Forecast, by Country 2020 & 2033
- Table 24: Global Submarine Telecommunication Cable Volume K Forecast, by Country 2020 & 2033
- Table 25: Brazil Submarine Telecommunication Cable Revenue (million) Forecast, by Application 2020 & 2033
- Table 26: Brazil Submarine Telecommunication Cable Volume (K) Forecast, by Application 2020 & 2033
- Table 27: Argentina Submarine Telecommunication Cable Revenue (million) Forecast, by Application 2020 & 2033
- Table 28: Argentina Submarine Telecommunication Cable Volume (K) Forecast, by Application 2020 & 2033
- Table 29: Rest of South America Submarine Telecommunication Cable Revenue (million) Forecast, by Application 2020 & 2033
- Table 30: Rest of South America Submarine Telecommunication Cable Volume (K) Forecast, by Application 2020 & 2033
- Table 31: Global Submarine Telecommunication Cable Revenue million Forecast, by Application 2020 & 2033
- Table 32: Global Submarine Telecommunication Cable Volume K Forecast, by Application 2020 & 2033
- Table 33: Global Submarine Telecommunication Cable Revenue million Forecast, by Types 2020 & 2033
- Table 34: Global Submarine Telecommunication Cable Volume K Forecast, by Types 2020 & 2033
- Table 35: Global Submarine Telecommunication Cable Revenue million Forecast, by Country 2020 & 2033
- Table 36: Global Submarine Telecommunication Cable Volume K Forecast, by Country 2020 & 2033
- Table 37: United Kingdom Submarine Telecommunication Cable Revenue (million) Forecast, by Application 2020 & 2033
- Table 38: United Kingdom Submarine Telecommunication Cable Volume (K) Forecast, by Application 2020 & 2033
- Table 39: Germany Submarine Telecommunication Cable Revenue (million) Forecast, by Application 2020 & 2033
- Table 40: Germany Submarine Telecommunication Cable Volume (K) Forecast, by Application 2020 & 2033
- Table 41: France Submarine Telecommunication Cable Revenue (million) Forecast, by Application 2020 & 2033
- Table 42: France Submarine Telecommunication Cable Volume (K) Forecast, by Application 2020 & 2033
- Table 43: Italy Submarine Telecommunication Cable Revenue (million) Forecast, by Application 2020 & 2033
- Table 44: Italy Submarine Telecommunication Cable Volume (K) Forecast, by Application 2020 & 2033
- Table 45: Spain Submarine Telecommunication Cable Revenue (million) Forecast, by Application 2020 & 2033
- Table 46: Spain Submarine Telecommunication Cable Volume (K) Forecast, by Application 2020 & 2033
- Table 47: Russia Submarine Telecommunication Cable Revenue (million) Forecast, by Application 2020 & 2033
- Table 48: Russia Submarine Telecommunication Cable Volume (K) Forecast, by Application 2020 & 2033
- Table 49: Benelux Submarine Telecommunication Cable Revenue (million) Forecast, by Application 2020 & 2033
- Table 50: Benelux Submarine Telecommunication Cable Volume (K) Forecast, by Application 2020 & 2033
- Table 51: Nordics Submarine Telecommunication Cable Revenue (million) Forecast, by Application 2020 & 2033
- Table 52: Nordics Submarine Telecommunication Cable Volume (K) Forecast, by Application 2020 & 2033
- Table 53: Rest of Europe Submarine Telecommunication Cable Revenue (million) Forecast, by Application 2020 & 2033
- Table 54: Rest of Europe Submarine Telecommunication Cable Volume (K) Forecast, by Application 2020 & 2033
- Table 55: Global Submarine Telecommunication Cable Revenue million Forecast, by Application 2020 & 2033
- Table 56: Global Submarine Telecommunication Cable Volume K Forecast, by Application 2020 & 2033
- Table 57: Global Submarine Telecommunication Cable Revenue million Forecast, by Types 2020 & 2033
- Table 58: Global Submarine Telecommunication Cable Volume K Forecast, by Types 2020 & 2033
- Table 59: Global Submarine Telecommunication Cable Revenue million Forecast, by Country 2020 & 2033
- Table 60: Global Submarine Telecommunication Cable Volume K Forecast, by Country 2020 & 2033
- Table 61: Turkey Submarine Telecommunication Cable Revenue (million) Forecast, by Application 2020 & 2033
- Table 62: Turkey Submarine Telecommunication Cable Volume (K) Forecast, by Application 2020 & 2033
- Table 63: Israel Submarine Telecommunication Cable Revenue (million) Forecast, by Application 2020 & 2033
- Table 64: Israel Submarine Telecommunication Cable Volume (K) Forecast, by Application 2020 & 2033
- Table 65: GCC Submarine Telecommunication Cable Revenue (million) Forecast, by Application 2020 & 2033
- Table 66: GCC Submarine Telecommunication Cable Volume (K) Forecast, by Application 2020 & 2033
- Table 67: North Africa Submarine Telecommunication Cable Revenue (million) Forecast, by Application 2020 & 2033
- Table 68: North Africa Submarine Telecommunication Cable Volume (K) Forecast, by Application 2020 & 2033
- Table 69: South Africa Submarine Telecommunication Cable Revenue (million) Forecast, by Application 2020 & 2033
- Table 70: South Africa Submarine Telecommunication Cable Volume (K) Forecast, by Application 2020 & 2033
- Table 71: Rest of Middle East & Africa Submarine Telecommunication Cable Revenue (million) Forecast, by Application 2020 & 2033
- Table 72: Rest of Middle East & Africa Submarine Telecommunication Cable Volume (K) Forecast, by Application 2020 & 2033
- Table 73: Global Submarine Telecommunication Cable Revenue million Forecast, by Application 2020 & 2033
- Table 74: Global Submarine Telecommunication Cable Volume K Forecast, by Application 2020 & 2033
- Table 75: Global Submarine Telecommunication Cable Revenue million Forecast, by Types 2020 & 2033
- Table 76: Global Submarine Telecommunication Cable Volume K Forecast, by Types 2020 & 2033
- Table 77: Global Submarine Telecommunication Cable Revenue million Forecast, by Country 2020 & 2033
- Table 78: Global Submarine Telecommunication Cable Volume K Forecast, by Country 2020 & 2033
- Table 79: China Submarine Telecommunication Cable Revenue (million) Forecast, by Application 2020 & 2033
- Table 80: China Submarine Telecommunication Cable Volume (K) Forecast, by Application 2020 & 2033
- Table 81: India Submarine Telecommunication Cable Revenue (million) Forecast, by Application 2020 & 2033
- Table 82: India Submarine Telecommunication Cable Volume (K) Forecast, by Application 2020 & 2033
- Table 83: Japan Submarine Telecommunication Cable Revenue (million) Forecast, by Application 2020 & 2033
- Table 84: Japan Submarine Telecommunication Cable Volume (K) Forecast, by Application 2020 & 2033
- Table 85: South Korea Submarine Telecommunication Cable Revenue (million) Forecast, by Application 2020 & 2033
- Table 86: South Korea Submarine Telecommunication Cable Volume (K) Forecast, by Application 2020 & 2033
- Table 87: ASEAN Submarine Telecommunication Cable Revenue (million) Forecast, by Application 2020 & 2033
- Table 88: ASEAN Submarine Telecommunication Cable Volume (K) Forecast, by Application 2020 & 2033
- Table 89: Oceania Submarine Telecommunication Cable Revenue (million) Forecast, by Application 2020 & 2033
- Table 90: Oceania Submarine Telecommunication Cable Volume (K) Forecast, by Application 2020 & 2033
- Table 91: Rest of Asia Pacific Submarine Telecommunication Cable Revenue (million) Forecast, by Application 2020 & 2033
- Table 92: Rest of Asia Pacific Submarine Telecommunication Cable Volume (K) Forecast, by Application 2020 & 2033
Frequently Asked Questions
1. What is the projected Compound Annual Growth Rate (CAGR) of the Submarine Telecommunication Cable?
The projected CAGR is approximately 6.2%.
2. Which companies are prominent players in the Submarine Telecommunication Cable?
Key companies in the market include Alcatel-Lucent, Prysmian, TESubCom, Nexans, NEC, Corning, HTGD, Fujikura, CommScope, ZTT, General Cable, Belden, Aksh Optifiber, Finolex Cables.
3. What are the main segments of the Submarine Telecommunication Cable?
The market segments include Application, Types.
4. Can you provide details about the market size?
The market size is estimated to be USD 16450 million as of 2022.
5. What are some drivers contributing to market growth?
N/A
6. What are the notable trends driving market growth?
N/A
7. Are there any restraints impacting market growth?
N/A
8. Can you provide examples of recent developments in the market?
N/A
9. What pricing options are available for accessing the report?
Pricing options include single-user, multi-user, and enterprise licenses priced at USD 3350.00, USD 5025.00, and USD 6700.00 respectively.
10. Is the market size provided in terms of value or volume?
The market size is provided in terms of value, measured in million and volume, measured in K.
11. Are there any specific market keywords associated with the report?
Yes, the market keyword associated with the report is "Submarine Telecommunication Cable," which aids in identifying and referencing the specific market segment covered.
12. How do I determine which pricing option suits my needs best?
The pricing options vary based on user requirements and access needs. Individual users may opt for single-user licenses, while businesses requiring broader access may choose multi-user or enterprise licenses for cost-effective access to the report.
13. Are there any additional resources or data provided in the Submarine Telecommunication Cable report?
While the report offers comprehensive insights, it's advisable to review the specific contents or supplementary materials provided to ascertain if additional resources or data are available.
14. How can I stay updated on further developments or reports in the Submarine Telecommunication Cable?
To stay informed about further developments, trends, and reports in the Submarine Telecommunication Cable, consider subscribing to industry newsletters, following relevant companies and organizations, or regularly checking reputable industry news sources and publications.
Methodology
Step 1 - Identification of Relevant Samples Size from Population Database


Step 2 - Approaches for Defining Global Market Size (Value, Volume* & Price*)

Note*: In applicable scenarios
Step 3 - Data Sources
Primary Research
- Web Analytics
- Survey Reports
- Research Institute
- Latest Research Reports
- Opinion Leaders
Secondary Research
- Annual Reports
- White Paper
- Latest Press Release
- Industry Association
- Paid Database
- Investor Presentations

Step 4 - Data Triangulation
Involves using different sources of information in order to increase the validity of a study
These sources are likely to be stakeholders in a program - participants, other researchers, program staff, other community members, and so on.
Then we put all data in single framework & apply various statistical tools to find out the dynamic on the market.
During the analysis stage, feedback from the stakeholder groups would be compared to determine areas of agreement as well as areas of divergence