

Key Insights
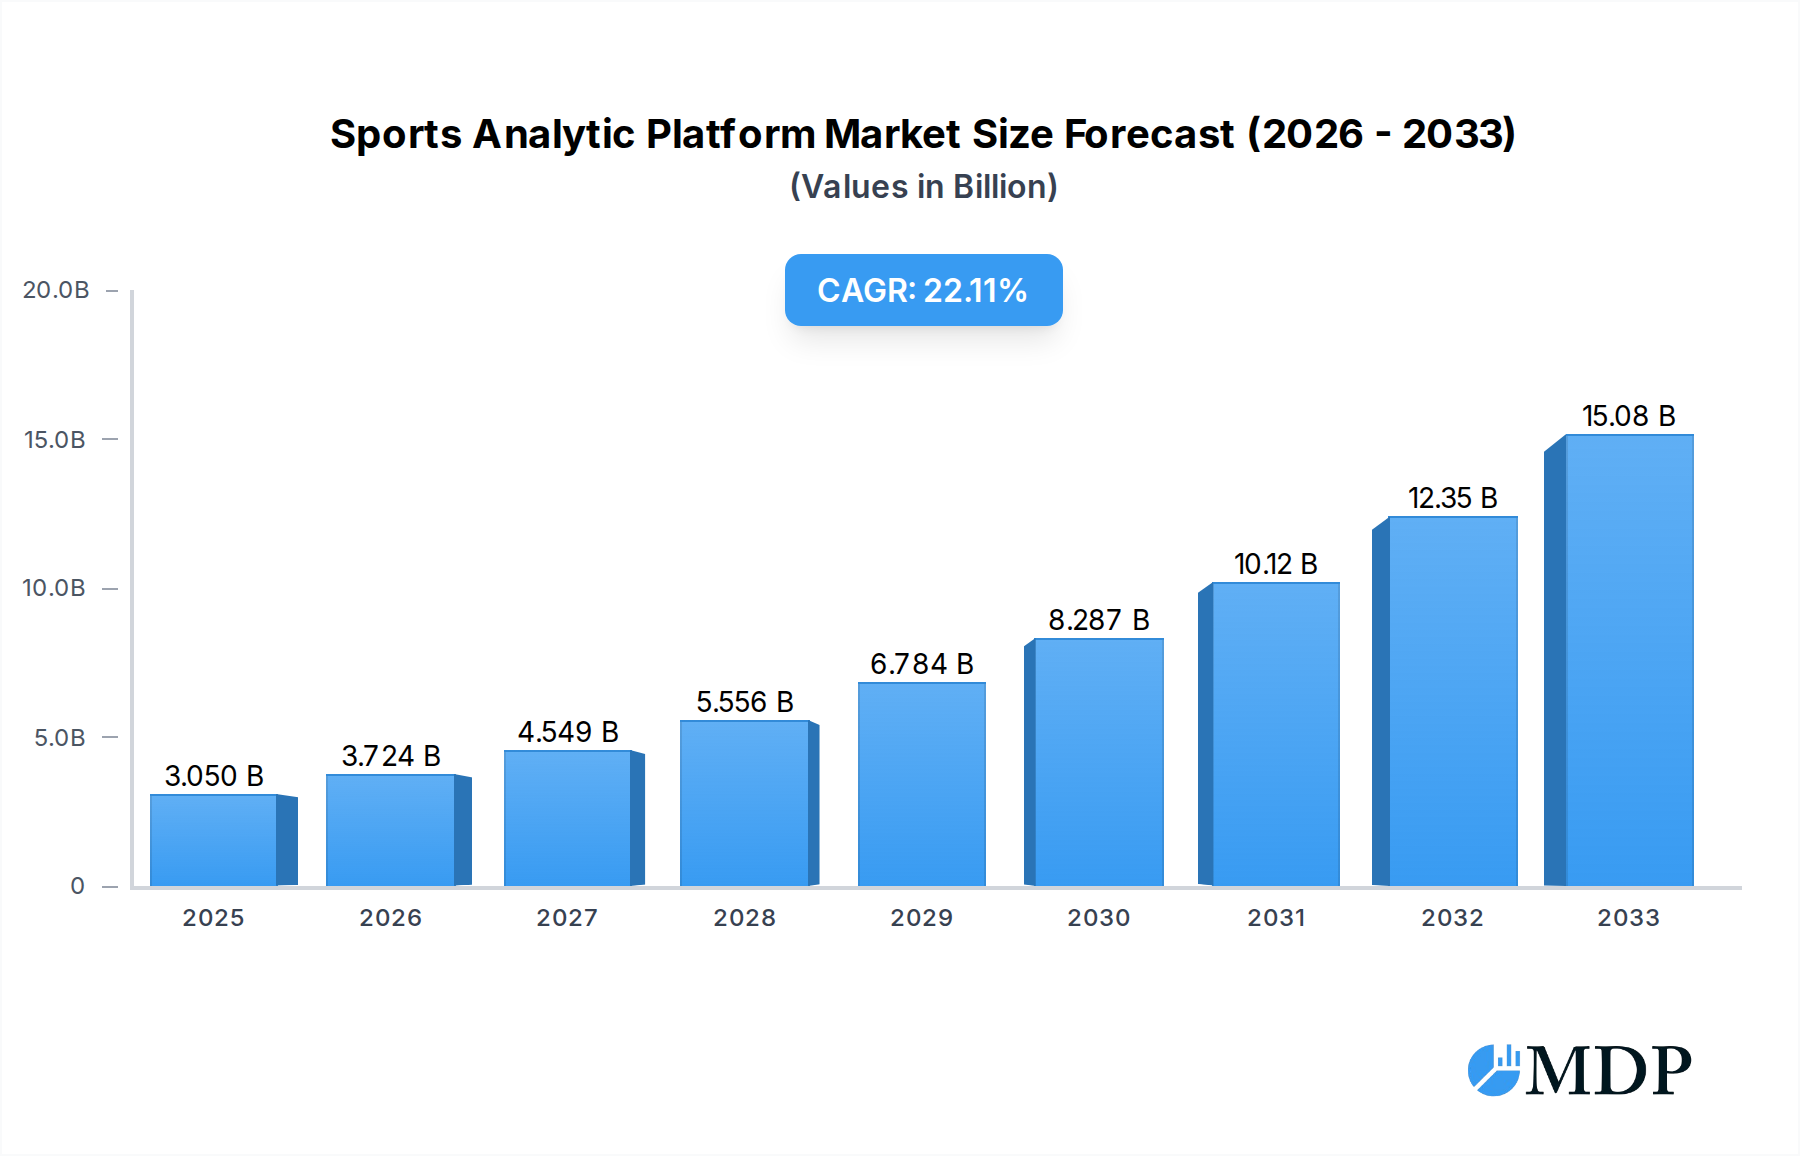
The global Sports Analytics Platform market is experiencing explosive growth, projected to reach USD 3.05 billion in 2025. This surge is fueled by an impressive Compound Annual Growth Rate (CAGR) of 24.1% throughout the forecast period of 2025-2033. This rapid expansion is largely driven by the increasing adoption of data-driven decision-making across all levels of sports, from professional leagues to amateur clubs. The demand for advanced analytics to enhance player performance, optimize game strategies, improve fan engagement, and generate new revenue streams is at an all-time high. Cloud-based solutions are gaining significant traction due to their scalability, accessibility, and cost-effectiveness, making sophisticated analytics accessible to a wider range of organizations. The integration of Artificial Intelligence (AI) and Machine Learning (ML) is further revolutionizing the field, enabling predictive analytics and real-time insights that were previously unattainable.

Sports Analytic Platform Market Size (In Billion)
Key applications like basketball, football, and tennis are leading the charge in adopting these platforms, leveraging them for detailed performance tracking, injury prevention, and sophisticated scouting. However, the market is not without its challenges. Concerns around data privacy, the cost of implementation for smaller organizations, and the need for skilled personnel to interpret and utilize complex data can act as restraints. Nevertheless, the overarching trend points towards a future where sports analytics is indispensable. Major players such as IBM, SAP SE, Oracle, and Stats Perform are at the forefront of innovation, continuously developing cutting-edge solutions to meet the evolving needs of the sports industry. The Asia Pacific region, particularly China and India, is emerging as a significant growth area, driven by a burgeoning sports economy and increasing investment in sports technology.
Sports Analytic Platform Company Market Share
Unlocking Performance: The Comprehensive Sports Analytic Platform Market Report 2024-2033
This in-depth report provides an unparalleled analysis of the global Sports Analytic Platform market, projecting significant growth and transformative shifts from 2024 to 2033. Covering a historical period from 2019 to 2024, with a base and estimated year of 2025, this study is an indispensable resource for industry stakeholders seeking to understand market dynamics, emerging trends, and future opportunities. With an estimated market size expected to reach billions by 2033, driven by advancements in artificial intelligence, machine learning, and data analytics, this report offers actionable insights into maximizing performance, optimizing strategies, and securing a competitive edge in the rapidly evolving sports technology landscape.
Sports Analytic Platform Market Dynamics & Concentration
The Sports Analytic Platform market exhibits a dynamic and moderately concentrated landscape, characterized by continuous innovation and strategic consolidation. Key drivers include the escalating demand for data-driven decision-making across all levels of sports, from professional leagues to amateur clubs, and the growing sophistication of analytical tools. Regulatory frameworks are gradually evolving to address data privacy and ethical considerations, influencing platform development and deployment. Product substitutes, such as manual analysis and simpler data visualization tools, are increasingly being overshadowed by the advanced capabilities offered by dedicated platforms. End-user trends are heavily influenced by the pursuit of marginal gains in athletic performance, fan engagement, and commercial revenue optimization. Mergers and acquisitions (M&A) activity is a significant feature, with several billion-dollar deals anticipated to shape market concentration and technological integration. For instance, an estimated of 15 M&A deals are projected to occur within the forecast period, significantly impacting market share distribution. The market share of leading players is expected to consolidate, with top contenders vying for dominance through technological superiority and comprehensive service offerings.
Sports Analytic Platform Industry Trends & Analysis
The Sports Analytic Platform industry is poised for robust expansion, with a projected Compound Annual Growth Rate (CAGR) of approximately 18.5% during the forecast period of 2025–2033. This significant growth is underpinned by several critical trends. Firstly, the escalating demand for performance optimization among athletes and teams remains a primary growth driver. Coaches and sports scientists are increasingly relying on sophisticated analytics to identify strengths, weaknesses, and training regimens, leading to enhanced athletic outcomes. Secondly, technological disruptions, particularly the integration of Artificial Intelligence (AI) and Machine Learning (ML), are revolutionizing how sports data is processed and interpreted. These technologies enable predictive analytics for injury prevention, opponent scouting, and tactical adjustments, offering unprecedented insights. Furthermore, the burgeoning popularity of sports betting and fantasy sports platforms has created a parallel demand for real-time data and predictive modeling, further fueling market penetration. Consumer preferences are shifting towards more intuitive, user-friendly platforms that can provide actionable insights without requiring deep technical expertise. This has led to a greater emphasis on user experience (UX) and the development of customizable dashboards and reporting tools. The competitive dynamics are intense, with established technology giants and specialized sports analytics firms fiercely competing for market share. Companies are investing heavily in R&D to develop proprietary algorithms and data collection methods, creating significant barriers to entry for new players. The increasing accessibility of cloud-based solutions is also democratizing access to advanced analytics, allowing smaller organizations to leverage powerful tools that were once exclusive to elite teams. The penetration of sports analytics solutions into emerging markets and less traditional sports segments is expected to further accelerate growth. The global market size is projected to reach an astounding xx billion by the end of 2033. The market penetration for cloud-based solutions is anticipated to reach over 85% by 2033, indicating a clear shift away from traditional on-premises deployments.
Leading Markets & Segments in Sports Analytic Platform
The Sports Analytic Platform market showcases distinct regional dominance and segment preferences, driven by a confluence of economic policies, infrastructure development, and fan engagement. North America is expected to remain the leading market, propelled by a mature sports ecosystem, substantial investment in sports technology, and a strong culture of data utilization across major professional leagues like the NFL, NBA, MLB, and NHL. Within North America, the United States, with its multi-billion dollar sports industry and a high concentration of sports analytics companies, will continue to be the dominant country. Asia-Pacific is emerging as a significant growth region, fueled by the rising popularity of sports like football and badminton, increasing disposable incomes, and government initiatives to promote sports development. Economic policies in these regions are increasingly focused on fostering technological innovation and sports science, creating a fertile ground for the adoption of advanced analytical solutions.
Key segments driving this dominance include:
Application:
- Football (Soccer): This application segment is a major revenue generator due to its global appeal, large fan base, and significant investment in performance analysis by clubs and federations. Advanced player tracking, tactical analysis, and opponent scouting are critical for success.
- Basketball: The NBA's embrace of analytics has set a global precedent. Detailed player statistics, shot charts, and predictive models for game outcomes are highly sought after.
- Baseball: With its rich statistical history, baseball is a natural fit for advanced analytics, focusing on pitcher performance, batter efficiency, and strategic game management.
- Others (Tennis, Badminton, Volleyball): These segments, while smaller individually, collectively represent a substantial and growing market as technological adoption increases across a wider range of sports.
Types:
- Cloud Based: This deployment type dominates the market due to its scalability, cost-effectiveness, and ease of access. The ability to access data and analytics from anywhere, coupled with reduced IT infrastructure burdens, makes it the preferred choice for most organizations. The trend towards cloud adoption is expected to continue, driven by data security advancements and improved connectivity, with an estimated market share of over 85% by 2033.
- On Premises: While still relevant for organizations with specific data security requirements or existing robust IT infrastructure, this segment is projected to see a decline in market share compared to cloud-based solutions.
Economic policies supporting technological adoption and R&D, coupled with robust digital infrastructure, are critical factors enabling the dominance of these segments and regions. The continued investment in sports science and performance analytics by professional leagues and governing bodies will ensure sustained growth across key applications and the preference for flexible, cloud-based solutions.
Sports Analytic Platform Product Developments
Recent product developments in the Sports Analytic Platform market are characterized by the integration of advanced AI and ML algorithms for predictive and prescriptive analytics. Platforms are increasingly offering real-time performance monitoring, injury risk assessment, and personalized training program generation. Innovations are focused on enhancing user experience through intuitive dashboards, natural language processing for data querying, and augmented reality applications for visual data representation. Competitive advantages are being carved out through proprietary data collection methods, specialized algorithms for specific sports, and seamless integration with existing sports technology ecosystems. This focus on sophisticated, yet accessible, analytical tools is crucial for market fit and future growth.
Key Drivers of Sports Analytic Platform Growth
The growth of the Sports Analytic Platform market is propelled by a confluence of powerful drivers. Technologically, the rapid advancements in AI, ML, and big data analytics are enabling more sophisticated insights and predictive capabilities. Economically, the increasing commercialization of sports and the pursuit of marginal performance gains by professional teams and athletes are creating substantial demand for data-driven solutions. Regulatory frameworks, while evolving, are also indirectly fostering growth by encouraging data standardization and ethical data usage, which in turn builds trust in these platforms. The sheer volume of sports data being generated globally, from player biometrics to fan engagement metrics, provides the raw material for these platforms to derive value.
Challenges in the Sports Analytic Platform Market
Despite the robust growth, the Sports Analytic Platform market faces several challenges. Regulatory hurdles related to data privacy and ownership can slow down adoption and require careful navigation. High implementation costs and the need for specialized technical expertise can be a barrier for smaller organizations. Supply chain issues related to hardware for data collection and integration complexities with legacy systems also pose challenges. Furthermore, the competitive pressures from established tech giants and agile startups necessitate continuous innovation and strategic differentiation to maintain market relevance. The cost of advanced analytics solutions can be significant, potentially limiting market penetration in certain segments.
Emerging Opportunities in Sports Analytic Platform
Emerging opportunities in the Sports Analytic Platform market are vast and transformative. Technological breakthroughs in areas like wearable sensor technology, real-time video analysis powered by computer vision, and blockchain for secure data management are opening new frontiers. Strategic partnerships between sports organizations, technology providers, and research institutions are crucial for co-developing innovative solutions. Market expansion into emerging sports and less data-intensive regions presents significant untapped potential. The increasing focus on fan engagement through personalized content delivery and interactive experiences also offers substantial growth avenues for platforms that can leverage data effectively.
Leading Players in the Sports Analytic Platform Sector
- IBM
- SAP SE
- SAS Institute
- Oracle
- Tableau Software
- Stats Perform
- Kitman Labs
- Opta Sports
- Deltatre
- Trumedia Networks
- Agile Sports Analytics
- Chetu
- Catapult
- Synergy Sports
- Sportradar
- Exasol
- SportsSource Analytics
- DataArt
- Orreco
- Quant4sport
- Genius Sports Group
- Qualitas Global
- iSportsAnalysis
- ICEBERG Sports Analytics
- Nacsport
- Performa Sports
- Experfy Inc.
Key Milestones in Sports Analytic Platform Industry
- 2019: Increased adoption of AI and ML in sports analytics, leading to more predictive capabilities.
- 2020: Surge in remote performance monitoring solutions due to global sporting event disruptions.
- 2021: Significant M&A activity as larger tech companies acquire specialized sports analytics firms.
- 2022: Expansion of cloud-based platforms, making advanced analytics more accessible to smaller organizations.
- 2023: Focus on ethical AI and data privacy frameworks gains traction within the industry.
- 2024: Introduction of more sophisticated real-time data visualization and interactive fan engagement tools.
- 2025 (Estimated): Further integration of IoT devices for granular player and environmental data collection.
- 2026-2033 (Forecast): Continued advancements in predictive analytics for injury prevention and personalized athlete development; expansion into new sports and emerging markets.
Strategic Outlook for Sports Analytic Platform Market
The strategic outlook for the Sports Analytic Platform market is exceptionally bright, driven by ongoing technological advancements and the insatiable appetite for performance optimization and enhanced fan engagement. Growth accelerators include the further integration of AI for hyper-personalized training and tactical insights, and the development of more immersive data visualization technologies. Strategic opportunities lie in expanding into emerging sports, developing tailored solutions for lower-tier leagues and amateur sports, and forging deeper collaborations with betting platforms and media companies. The market is poised for continued innovation, with a strong emphasis on actionable intelligence and the democratization of sophisticated analytical tools, ensuring sustained growth and significant future market potential.
Sports Analytic Platform Segmentation
-
1. Application
- 1.1. Basketball
- 1.2. Football
- 1.3. Tennis
- 1.4. Badminton
- 1.5. Volleyball
- 1.6. Baseball
- 1.7. Others
-
2. Types
- 2.1. Cloud Based
- 2.2. On Premises
Sports Analytic Platform Segmentation By Geography
-
1. North America
- 1.1. United States
- 1.2. Canada
- 1.3. Mexico
-
2. South America
- 2.1. Brazil
- 2.2. Argentina
- 2.3. Rest of South America
-
3. Europe
- 3.1. United Kingdom
- 3.2. Germany
- 3.3. France
- 3.4. Italy
- 3.5. Spain
- 3.6. Russia
- 3.7. Benelux
- 3.8. Nordics
- 3.9. Rest of Europe
-
4. Middle East & Africa
- 4.1. Turkey
- 4.2. Israel
- 4.3. GCC
- 4.4. North Africa
- 4.5. South Africa
- 4.6. Rest of Middle East & Africa
-
5. Asia Pacific
- 5.1. China
- 5.2. India
- 5.3. Japan
- 5.4. South Korea
- 5.5. ASEAN
- 5.6. Oceania
- 5.7. Rest of Asia Pacific
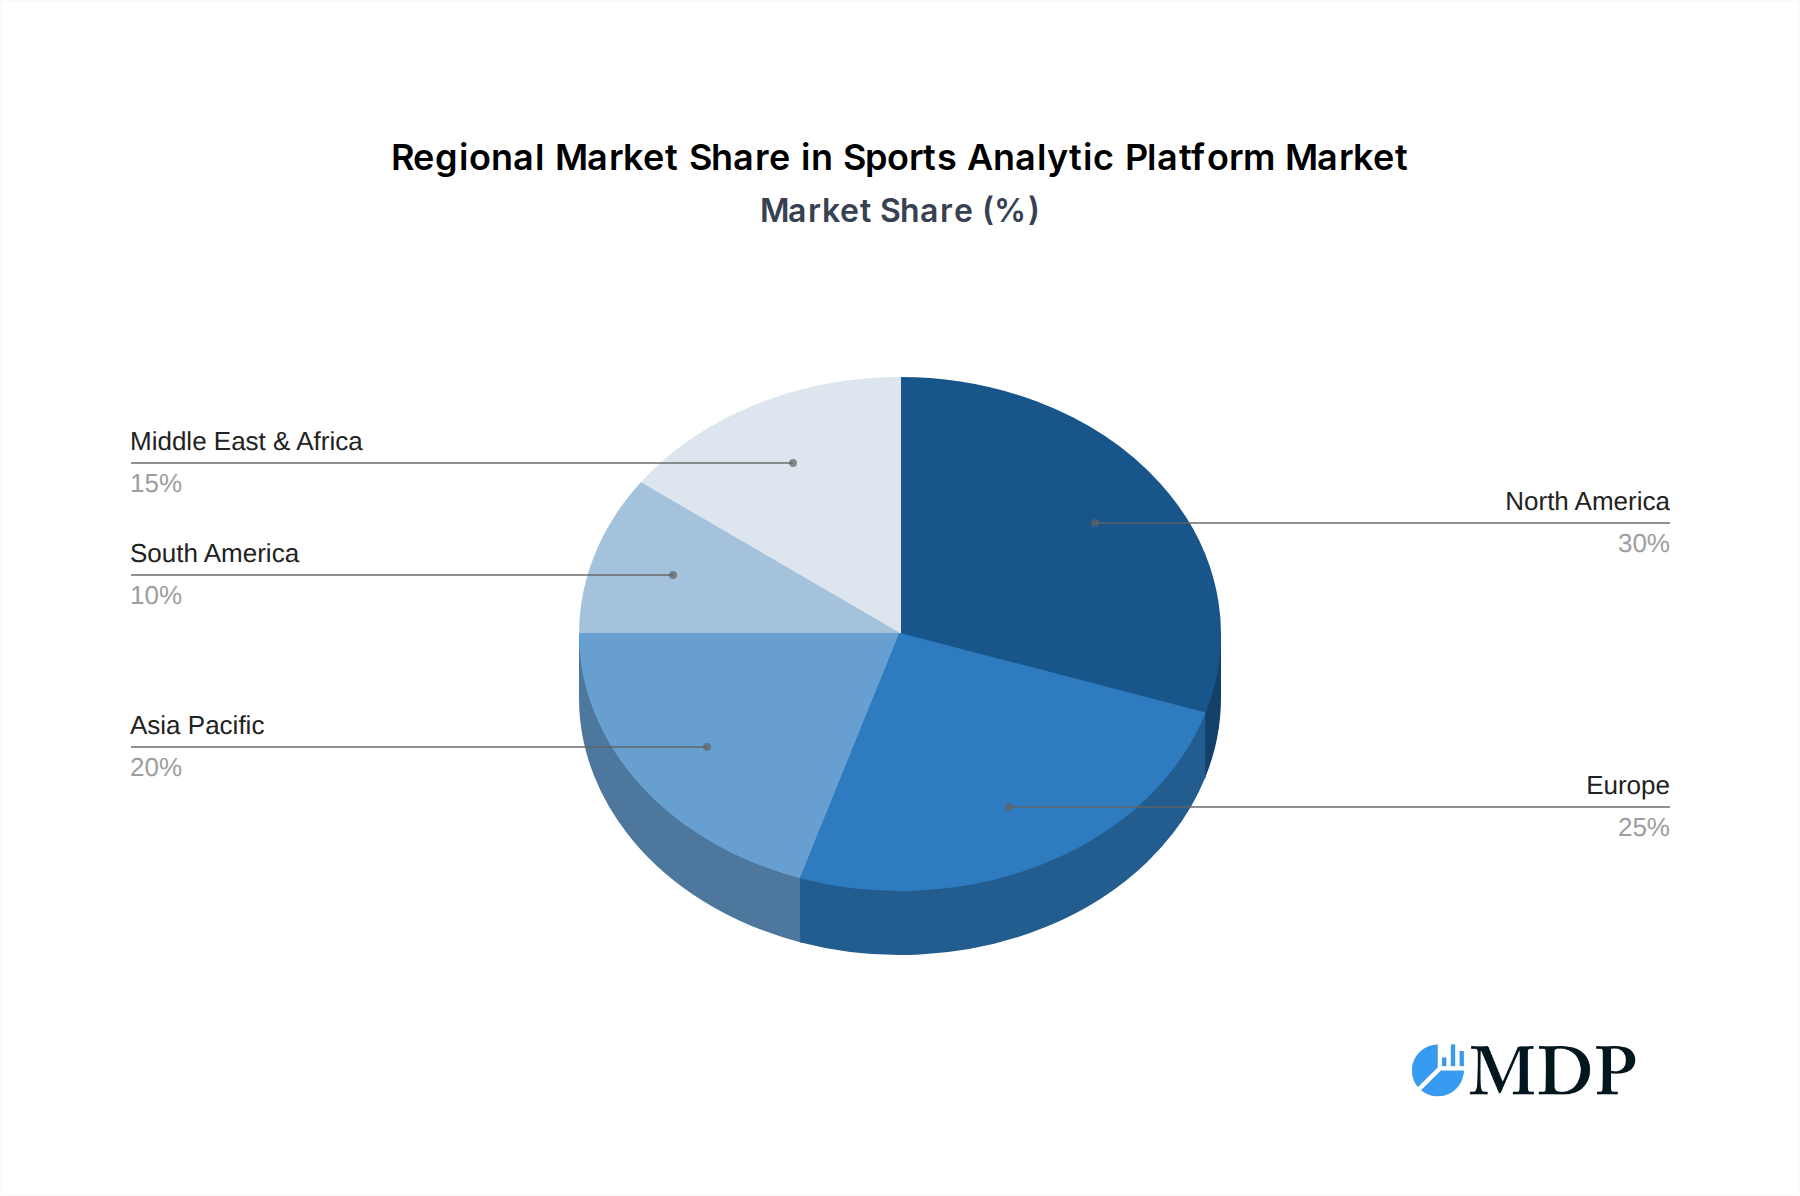
Sports Analytic Platform Regional Market Share
Geographic Coverage of Sports Analytic Platform
Sports Analytic Platform REPORT HIGHLIGHTS
| Aspects | Details |
|---|---|
| Study Period | 2020-2034 |
| Base Year | 2025 |
| Estimated Year | 2026 |
| Forecast Period | 2026-2034 |
| Historical Period | 2020-2025 |
| Growth Rate | CAGR of 24.1% from 2020-2034 |
| Segmentation |
|
Table of Contents
- 1. Introduction
- 1.1. Research Scope
- 1.2. Market Segmentation
- 1.3. Research Methodology
- 1.4. Definitions and Assumptions
- 2. Executive Summary
- 2.1. Introduction
- 3. Market Dynamics
- 3.1. Introduction
- 3.2. Market Drivers
- 3.3. Market Restrains
- 3.4. Market Trends
- 4. Market Factor Analysis
- 4.1. Porters Five Forces
- 4.2. Supply/Value Chain
- 4.3. PESTEL analysis
- 4.4. Market Entropy
- 4.5. Patent/Trademark Analysis
- 5. Global Sports Analytic Platform Analysis, Insights and Forecast, 2020-2032
- 5.1. Market Analysis, Insights and Forecast - by Application
- 5.1.1. Basketball
- 5.1.2. Football
- 5.1.3. Tennis
- 5.1.4. Badminton
- 5.1.5. Volleyball
- 5.1.6. Baseball
- 5.1.7. Others
- 5.2. Market Analysis, Insights and Forecast - by Types
- 5.2.1. Cloud Based
- 5.2.2. On Premises
- 5.3. Market Analysis, Insights and Forecast - by Region
- 5.3.1. North America
- 5.3.2. South America
- 5.3.3. Europe
- 5.3.4. Middle East & Africa
- 5.3.5. Asia Pacific
- 5.1. Market Analysis, Insights and Forecast - by Application
- 6. North America Sports Analytic Platform Analysis, Insights and Forecast, 2020-2032
- 6.1. Market Analysis, Insights and Forecast - by Application
- 6.1.1. Basketball
- 6.1.2. Football
- 6.1.3. Tennis
- 6.1.4. Badminton
- 6.1.5. Volleyball
- 6.1.6. Baseball
- 6.1.7. Others
- 6.2. Market Analysis, Insights and Forecast - by Types
- 6.2.1. Cloud Based
- 6.2.2. On Premises
- 6.1. Market Analysis, Insights and Forecast - by Application
- 7. South America Sports Analytic Platform Analysis, Insights and Forecast, 2020-2032
- 7.1. Market Analysis, Insights and Forecast - by Application
- 7.1.1. Basketball
- 7.1.2. Football
- 7.1.3. Tennis
- 7.1.4. Badminton
- 7.1.5. Volleyball
- 7.1.6. Baseball
- 7.1.7. Others
- 7.2. Market Analysis, Insights and Forecast - by Types
- 7.2.1. Cloud Based
- 7.2.2. On Premises
- 7.1. Market Analysis, Insights and Forecast - by Application
- 8. Europe Sports Analytic Platform Analysis, Insights and Forecast, 2020-2032
- 8.1. Market Analysis, Insights and Forecast - by Application
- 8.1.1. Basketball
- 8.1.2. Football
- 8.1.3. Tennis
- 8.1.4. Badminton
- 8.1.5. Volleyball
- 8.1.6. Baseball
- 8.1.7. Others
- 8.2. Market Analysis, Insights and Forecast - by Types
- 8.2.1. Cloud Based
- 8.2.2. On Premises
- 8.1. Market Analysis, Insights and Forecast - by Application
- 9. Middle East & Africa Sports Analytic Platform Analysis, Insights and Forecast, 2020-2032
- 9.1. Market Analysis, Insights and Forecast - by Application
- 9.1.1. Basketball
- 9.1.2. Football
- 9.1.3. Tennis
- 9.1.4. Badminton
- 9.1.5. Volleyball
- 9.1.6. Baseball
- 9.1.7. Others
- 9.2. Market Analysis, Insights and Forecast - by Types
- 9.2.1. Cloud Based
- 9.2.2. On Premises
- 9.1. Market Analysis, Insights and Forecast - by Application
- 10. Asia Pacific Sports Analytic Platform Analysis, Insights and Forecast, 2020-2032
- 10.1. Market Analysis, Insights and Forecast - by Application
- 10.1.1. Basketball
- 10.1.2. Football
- 10.1.3. Tennis
- 10.1.4. Badminton
- 10.1.5. Volleyball
- 10.1.6. Baseball
- 10.1.7. Others
- 10.2. Market Analysis, Insights and Forecast - by Types
- 10.2.1. Cloud Based
- 10.2.2. On Premises
- 10.1. Market Analysis, Insights and Forecast - by Application
- 11. Competitive Analysis
- 11.1. Global Market Share Analysis 2025
- 11.2. Company Profiles
- 11.2.1 IBM
- 11.2.1.1. Overview
- 11.2.1.2. Products
- 11.2.1.3. SWOT Analysis
- 11.2.1.4. Recent Developments
- 11.2.1.5. Financials (Based on Availability)
- 11.2.2 SAP SE
- 11.2.2.1. Overview
- 11.2.2.2. Products
- 11.2.2.3. SWOT Analysis
- 11.2.2.4. Recent Developments
- 11.2.2.5. Financials (Based on Availability)
- 11.2.3 SAS Institute
- 11.2.3.1. Overview
- 11.2.3.2. Products
- 11.2.3.3. SWOT Analysis
- 11.2.3.4. Recent Developments
- 11.2.3.5. Financials (Based on Availability)
- 11.2.4 Oracle
- 11.2.4.1. Overview
- 11.2.4.2. Products
- 11.2.4.3. SWOT Analysis
- 11.2.4.4. Recent Developments
- 11.2.4.5. Financials (Based on Availability)
- 11.2.5 Tableau Software
- 11.2.5.1. Overview
- 11.2.5.2. Products
- 11.2.5.3. SWOT Analysis
- 11.2.5.4. Recent Developments
- 11.2.5.5. Financials (Based on Availability)
- 11.2.6 Stats Perform
- 11.2.6.1. Overview
- 11.2.6.2. Products
- 11.2.6.3. SWOT Analysis
- 11.2.6.4. Recent Developments
- 11.2.6.5. Financials (Based on Availability)
- 11.2.7 Kitman Labs
- 11.2.7.1. Overview
- 11.2.7.2. Products
- 11.2.7.3. SWOT Analysis
- 11.2.7.4. Recent Developments
- 11.2.7.5. Financials (Based on Availability)
- 11.2.8 Opta Sports
- 11.2.8.1. Overview
- 11.2.8.2. Products
- 11.2.8.3. SWOT Analysis
- 11.2.8.4. Recent Developments
- 11.2.8.5. Financials (Based on Availability)
- 11.2.9 Deltatre
- 11.2.9.1. Overview
- 11.2.9.2. Products
- 11.2.9.3. SWOT Analysis
- 11.2.9.4. Recent Developments
- 11.2.9.5. Financials (Based on Availability)
- 11.2.10 Trumedia Networks
- 11.2.10.1. Overview
- 11.2.10.2. Products
- 11.2.10.3. SWOT Analysis
- 11.2.10.4. Recent Developments
- 11.2.10.5. Financials (Based on Availability)
- 11.2.11 Agile Sports Analytics
- 11.2.11.1. Overview
- 11.2.11.2. Products
- 11.2.11.3. SWOT Analysis
- 11.2.11.4. Recent Developments
- 11.2.11.5. Financials (Based on Availability)
- 11.2.12 Chetu
- 11.2.12.1. Overview
- 11.2.12.2. Products
- 11.2.12.3. SWOT Analysis
- 11.2.12.4. Recent Developments
- 11.2.12.5. Financials (Based on Availability)
- 11.2.13 Catapult
- 11.2.13.1. Overview
- 11.2.13.2. Products
- 11.2.13.3. SWOT Analysis
- 11.2.13.4. Recent Developments
- 11.2.13.5. Financials (Based on Availability)
- 11.2.14 Synergy Sports (Sportradar
- 11.2.14.1. Overview
- 11.2.14.2. Products
- 11.2.14.3. SWOT Analysis
- 11.2.14.4. Recent Developments
- 11.2.14.5. Financials (Based on Availability)
- 11.2.15 Exasol
- 11.2.15.1. Overview
- 11.2.15.2. Products
- 11.2.15.3. SWOT Analysis
- 11.2.15.4. Recent Developments
- 11.2.15.5. Financials (Based on Availability)
- 11.2.16 SportsSource Analytics
- 11.2.16.1. Overview
- 11.2.16.2. Products
- 11.2.16.3. SWOT Analysis
- 11.2.16.4. Recent Developments
- 11.2.16.5. Financials (Based on Availability)
- 11.2.17 DataArt
- 11.2.17.1. Overview
- 11.2.17.2. Products
- 11.2.17.3. SWOT Analysis
- 11.2.17.4. Recent Developments
- 11.2.17.5. Financials (Based on Availability)
- 11.2.18 Orreco
- 11.2.18.1. Overview
- 11.2.18.2. Products
- 11.2.18.3. SWOT Analysis
- 11.2.18.4. Recent Developments
- 11.2.18.5. Financials (Based on Availability)
- 11.2.19 Quant4sport
- 11.2.19.1. Overview
- 11.2.19.2. Products
- 11.2.19.3. SWOT Analysis
- 11.2.19.4. Recent Developments
- 11.2.19.5. Financials (Based on Availability)
- 11.2.20 Genius Sports Group
- 11.2.20.1. Overview
- 11.2.20.2. Products
- 11.2.20.3. SWOT Analysis
- 11.2.20.4. Recent Developments
- 11.2.20.5. Financials (Based on Availability)
- 11.2.21 Qualitas Global
- 11.2.21.1. Overview
- 11.2.21.2. Products
- 11.2.21.3. SWOT Analysis
- 11.2.21.4. Recent Developments
- 11.2.21.5. Financials (Based on Availability)
- 11.2.22 iSportsAnalysis
- 11.2.22.1. Overview
- 11.2.22.2. Products
- 11.2.22.3. SWOT Analysis
- 11.2.22.4. Recent Developments
- 11.2.22.5. Financials (Based on Availability)
- 11.2.23 ICEBERG Sports Analytics
- 11.2.23.1. Overview
- 11.2.23.2. Products
- 11.2.23.3. SWOT Analysis
- 11.2.23.4. Recent Developments
- 11.2.23.5. Financials (Based on Availability)
- 11.2.24 Nacsport
- 11.2.24.1. Overview
- 11.2.24.2. Products
- 11.2.24.3. SWOT Analysis
- 11.2.24.4. Recent Developments
- 11.2.24.5. Financials (Based on Availability)
- 11.2.25 Performa Sports
- 11.2.25.1. Overview
- 11.2.25.2. Products
- 11.2.25.3. SWOT Analysis
- 11.2.25.4. Recent Developments
- 11.2.25.5. Financials (Based on Availability)
- 11.2.26 Experfy Inc.
- 11.2.26.1. Overview
- 11.2.26.2. Products
- 11.2.26.3. SWOT Analysis
- 11.2.26.4. Recent Developments
- 11.2.26.5. Financials (Based on Availability)
- 11.2.1 IBM
List of Figures
- Figure 1: Global Sports Analytic Platform Revenue Breakdown (billion, %) by Region 2025 & 2033
- Figure 2: North America Sports Analytic Platform Revenue (billion), by Application 2025 & 2033
- Figure 3: North America Sports Analytic Platform Revenue Share (%), by Application 2025 & 2033
- Figure 4: North America Sports Analytic Platform Revenue (billion), by Types 2025 & 2033
- Figure 5: North America Sports Analytic Platform Revenue Share (%), by Types 2025 & 2033
- Figure 6: North America Sports Analytic Platform Revenue (billion), by Country 2025 & 2033
- Figure 7: North America Sports Analytic Platform Revenue Share (%), by Country 2025 & 2033
- Figure 8: South America Sports Analytic Platform Revenue (billion), by Application 2025 & 2033
- Figure 9: South America Sports Analytic Platform Revenue Share (%), by Application 2025 & 2033
- Figure 10: South America Sports Analytic Platform Revenue (billion), by Types 2025 & 2033
- Figure 11: South America Sports Analytic Platform Revenue Share (%), by Types 2025 & 2033
- Figure 12: South America Sports Analytic Platform Revenue (billion), by Country 2025 & 2033
- Figure 13: South America Sports Analytic Platform Revenue Share (%), by Country 2025 & 2033
- Figure 14: Europe Sports Analytic Platform Revenue (billion), by Application 2025 & 2033
- Figure 15: Europe Sports Analytic Platform Revenue Share (%), by Application 2025 & 2033
- Figure 16: Europe Sports Analytic Platform Revenue (billion), by Types 2025 & 2033
- Figure 17: Europe Sports Analytic Platform Revenue Share (%), by Types 2025 & 2033
- Figure 18: Europe Sports Analytic Platform Revenue (billion), by Country 2025 & 2033
- Figure 19: Europe Sports Analytic Platform Revenue Share (%), by Country 2025 & 2033
- Figure 20: Middle East & Africa Sports Analytic Platform Revenue (billion), by Application 2025 & 2033
- Figure 21: Middle East & Africa Sports Analytic Platform Revenue Share (%), by Application 2025 & 2033
- Figure 22: Middle East & Africa Sports Analytic Platform Revenue (billion), by Types 2025 & 2033
- Figure 23: Middle East & Africa Sports Analytic Platform Revenue Share (%), by Types 2025 & 2033
- Figure 24: Middle East & Africa Sports Analytic Platform Revenue (billion), by Country 2025 & 2033
- Figure 25: Middle East & Africa Sports Analytic Platform Revenue Share (%), by Country 2025 & 2033
- Figure 26: Asia Pacific Sports Analytic Platform Revenue (billion), by Application 2025 & 2033
- Figure 27: Asia Pacific Sports Analytic Platform Revenue Share (%), by Application 2025 & 2033
- Figure 28: Asia Pacific Sports Analytic Platform Revenue (billion), by Types 2025 & 2033
- Figure 29: Asia Pacific Sports Analytic Platform Revenue Share (%), by Types 2025 & 2033
- Figure 30: Asia Pacific Sports Analytic Platform Revenue (billion), by Country 2025 & 2033
- Figure 31: Asia Pacific Sports Analytic Platform Revenue Share (%), by Country 2025 & 2033
List of Tables
- Table 1: Global Sports Analytic Platform Revenue billion Forecast, by Application 2020 & 2033
- Table 2: Global Sports Analytic Platform Revenue billion Forecast, by Types 2020 & 2033
- Table 3: Global Sports Analytic Platform Revenue billion Forecast, by Region 2020 & 2033
- Table 4: Global Sports Analytic Platform Revenue billion Forecast, by Application 2020 & 2033
- Table 5: Global Sports Analytic Platform Revenue billion Forecast, by Types 2020 & 2033
- Table 6: Global Sports Analytic Platform Revenue billion Forecast, by Country 2020 & 2033
- Table 7: United States Sports Analytic Platform Revenue (billion) Forecast, by Application 2020 & 2033
- Table 8: Canada Sports Analytic Platform Revenue (billion) Forecast, by Application 2020 & 2033
- Table 9: Mexico Sports Analytic Platform Revenue (billion) Forecast, by Application 2020 & 2033
- Table 10: Global Sports Analytic Platform Revenue billion Forecast, by Application 2020 & 2033
- Table 11: Global Sports Analytic Platform Revenue billion Forecast, by Types 2020 & 2033
- Table 12: Global Sports Analytic Platform Revenue billion Forecast, by Country 2020 & 2033
- Table 13: Brazil Sports Analytic Platform Revenue (billion) Forecast, by Application 2020 & 2033
- Table 14: Argentina Sports Analytic Platform Revenue (billion) Forecast, by Application 2020 & 2033
- Table 15: Rest of South America Sports Analytic Platform Revenue (billion) Forecast, by Application 2020 & 2033
- Table 16: Global Sports Analytic Platform Revenue billion Forecast, by Application 2020 & 2033
- Table 17: Global Sports Analytic Platform Revenue billion Forecast, by Types 2020 & 2033
- Table 18: Global Sports Analytic Platform Revenue billion Forecast, by Country 2020 & 2033
- Table 19: United Kingdom Sports Analytic Platform Revenue (billion) Forecast, by Application 2020 & 2033
- Table 20: Germany Sports Analytic Platform Revenue (billion) Forecast, by Application 2020 & 2033
- Table 21: France Sports Analytic Platform Revenue (billion) Forecast, by Application 2020 & 2033
- Table 22: Italy Sports Analytic Platform Revenue (billion) Forecast, by Application 2020 & 2033
- Table 23: Spain Sports Analytic Platform Revenue (billion) Forecast, by Application 2020 & 2033
- Table 24: Russia Sports Analytic Platform Revenue (billion) Forecast, by Application 2020 & 2033
- Table 25: Benelux Sports Analytic Platform Revenue (billion) Forecast, by Application 2020 & 2033
- Table 26: Nordics Sports Analytic Platform Revenue (billion) Forecast, by Application 2020 & 2033
- Table 27: Rest of Europe Sports Analytic Platform Revenue (billion) Forecast, by Application 2020 & 2033
- Table 28: Global Sports Analytic Platform Revenue billion Forecast, by Application 2020 & 2033
- Table 29: Global Sports Analytic Platform Revenue billion Forecast, by Types 2020 & 2033
- Table 30: Global Sports Analytic Platform Revenue billion Forecast, by Country 2020 & 2033
- Table 31: Turkey Sports Analytic Platform Revenue (billion) Forecast, by Application 2020 & 2033
- Table 32: Israel Sports Analytic Platform Revenue (billion) Forecast, by Application 2020 & 2033
- Table 33: GCC Sports Analytic Platform Revenue (billion) Forecast, by Application 2020 & 2033
- Table 34: North Africa Sports Analytic Platform Revenue (billion) Forecast, by Application 2020 & 2033
- Table 35: South Africa Sports Analytic Platform Revenue (billion) Forecast, by Application 2020 & 2033
- Table 36: Rest of Middle East & Africa Sports Analytic Platform Revenue (billion) Forecast, by Application 2020 & 2033
- Table 37: Global Sports Analytic Platform Revenue billion Forecast, by Application 2020 & 2033
- Table 38: Global Sports Analytic Platform Revenue billion Forecast, by Types 2020 & 2033
- Table 39: Global Sports Analytic Platform Revenue billion Forecast, by Country 2020 & 2033
- Table 40: China Sports Analytic Platform Revenue (billion) Forecast, by Application 2020 & 2033
- Table 41: India Sports Analytic Platform Revenue (billion) Forecast, by Application 2020 & 2033
- Table 42: Japan Sports Analytic Platform Revenue (billion) Forecast, by Application 2020 & 2033
- Table 43: South Korea Sports Analytic Platform Revenue (billion) Forecast, by Application 2020 & 2033
- Table 44: ASEAN Sports Analytic Platform Revenue (billion) Forecast, by Application 2020 & 2033
- Table 45: Oceania Sports Analytic Platform Revenue (billion) Forecast, by Application 2020 & 2033
- Table 46: Rest of Asia Pacific Sports Analytic Platform Revenue (billion) Forecast, by Application 2020 & 2033
Frequently Asked Questions
1. What is the projected Compound Annual Growth Rate (CAGR) of the Sports Analytic Platform?
The projected CAGR is approximately 24.1%.
2. Which companies are prominent players in the Sports Analytic Platform?
Key companies in the market include IBM, SAP SE, SAS Institute, Oracle, Tableau Software, Stats Perform, Kitman Labs, Opta Sports, Deltatre, Trumedia Networks, Agile Sports Analytics, Chetu, Catapult, Synergy Sports (Sportradar, Exasol, SportsSource Analytics, DataArt, Orreco, Quant4sport, Genius Sports Group, Qualitas Global, iSportsAnalysis, ICEBERG Sports Analytics, Nacsport, Performa Sports, Experfy Inc..
3. What are the main segments of the Sports Analytic Platform?
The market segments include Application, Types.
4. Can you provide details about the market size?
The market size is estimated to be USD 3.05 billion as of 2022.
5. What are some drivers contributing to market growth?
N/A
6. What are the notable trends driving market growth?
N/A
7. Are there any restraints impacting market growth?
N/A
8. Can you provide examples of recent developments in the market?
N/A
9. What pricing options are available for accessing the report?
Pricing options include single-user, multi-user, and enterprise licenses priced at USD 3350.00, USD 5025.00, and USD 6700.00 respectively.
10. Is the market size provided in terms of value or volume?
The market size is provided in terms of value, measured in billion.
11. Are there any specific market keywords associated with the report?
Yes, the market keyword associated with the report is "Sports Analytic Platform," which aids in identifying and referencing the specific market segment covered.
12. How do I determine which pricing option suits my needs best?
The pricing options vary based on user requirements and access needs. Individual users may opt for single-user licenses, while businesses requiring broader access may choose multi-user or enterprise licenses for cost-effective access to the report.
13. Are there any additional resources or data provided in the Sports Analytic Platform report?
While the report offers comprehensive insights, it's advisable to review the specific contents or supplementary materials provided to ascertain if additional resources or data are available.
14. How can I stay updated on further developments or reports in the Sports Analytic Platform?
To stay informed about further developments, trends, and reports in the Sports Analytic Platform, consider subscribing to industry newsletters, following relevant companies and organizations, or regularly checking reputable industry news sources and publications.
Methodology
Step 1 - Identification of Relevant Samples Size from Population Database


Step 2 - Approaches for Defining Global Market Size (Value, Volume* & Price*)

Note*: In applicable scenarios
Step 3 - Data Sources
Primary Research
- Web Analytics
- Survey Reports
- Research Institute
- Latest Research Reports
- Opinion Leaders
Secondary Research
- Annual Reports
- White Paper
- Latest Press Release
- Industry Association
- Paid Database
- Investor Presentations

Step 4 - Data Triangulation
Involves using different sources of information in order to increase the validity of a study
These sources are likely to be stakeholders in a program - participants, other researchers, program staff, other community members, and so on.
Then we put all data in single framework & apply various statistical tools to find out the dynamic on the market.
During the analysis stage, feedback from the stakeholder groups would be compared to determine areas of agreement as well as areas of divergence