

Key Insights
The global Spinal Cord Stimulation (SCS) devices market is poised for substantial expansion, projected to reach $8054.4 million by 2025, with a compelling CAGR of 11.98%. This robust growth trajectory is propelled by the increasing incidence of chronic pain conditions, including back, neck, and neuropathic pain, driving demand for advanced pain management interventions. Technological innovations, such as less invasive implantation techniques, refined lead designs, and sophisticated adaptive stimulation algorithms, are enhancing treatment efficacy and patient outcomes. Growing awareness among clinicians and patients, supported by favorable reimbursement policies, further fuels market penetration. Intense competition among key industry players stimulates ongoing innovation and cost optimization, thereby improving SCS accessibility.
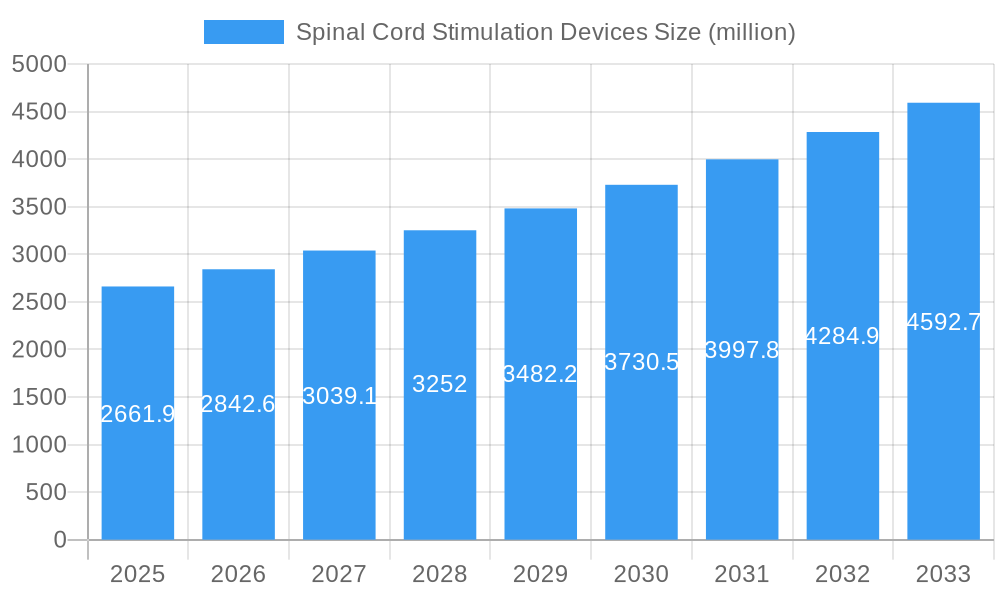
Spinal Cord Stimulation Devices Market Size (In Billion)
Conversely, market expansion is moderated by factors such as the high cost of SCS devices and procedures, posing accessibility challenges, particularly in emerging economies. Potential, albeit rare, side effects may also influence patient adoption. The market is segmented by device type (conventional SCS, dorsal root ganglion stimulation), application (back pain, leg pain), and end-user (hospitals, ambulatory surgical centers). The forecast period, from 2025 to 2033, anticipates sustained growth driven by continued technological advancements, the widespread adoption of minimally invasive procedures, and penetration into new geographical regions. Future growth will be significantly shaped by the success of novel stimulation paradigms and the expansion of SCS applications.
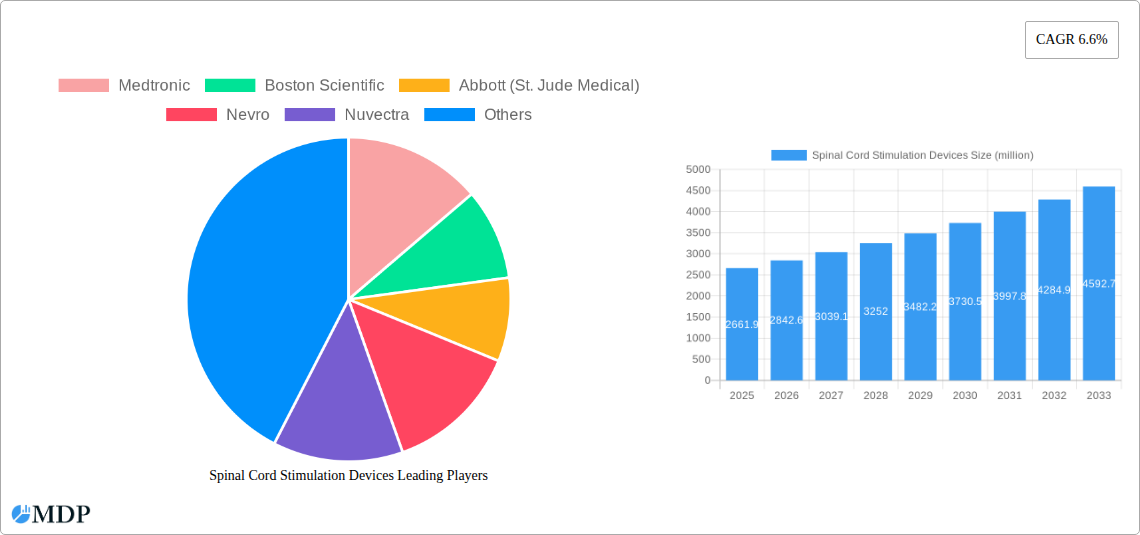
Spinal Cord Stimulation Devices Company Market Share
Spinal Cord Stimulation Devices Market Report: 2019-2033
This comprehensive report provides an in-depth analysis of the global Spinal Cord Stimulation (SCS) Devices market, projecting robust growth from $XX million in 2025 to $XX million by 2033, exhibiting a CAGR of XX%. The study covers the period 2019-2033, with 2025 as the base and estimated year. This report is crucial for industry stakeholders, investors, and researchers seeking actionable insights into this dynamic market.
Spinal Cord Stimulation Devices Market Dynamics & Concentration
The global spinal cord stimulation devices market is characterized by a moderately concentrated landscape, dominated by key players like Medtronic, Boston Scientific, Abbott (St. Jude Medical), Nevro, and Nuvectra. These companies collectively hold approximately XX% of the market share in 2025, reflecting their strong brand recognition, extensive product portfolios, and robust distribution networks. Market concentration is influenced by factors including stringent regulatory approvals (FDA, EMA), high capital expenditure requirements for R&D, and the specialized nature of the technology.
- Market Share (2025): Medtronic (XX%), Boston Scientific (XX%), Abbott (St. Jude Medical) (XX%), Nevro (XX%), Nuvectra (XX%), Others (XX%).
- Innovation Drivers: Miniaturization of devices, advancements in leadless technology, and development of closed-loop systems are key innovation drivers.
- Regulatory Frameworks: Stringent regulatory pathways, including clinical trials and post-market surveillance, significantly influence market entry and growth.
- M&A Activity: The past five years have witnessed XX mergers and acquisitions in the SCS devices sector, primarily focused on expanding product portfolios and geographical reach. This activity is expected to continue, driven by the desire for market consolidation and technological advancements.
- Product Substitutes: Pharmaceutical pain management therapies and surgical interventions represent key substitutes, although SCS offers advantages in chronic pain management.
- End-User Trends: The aging population, increasing prevalence of chronic pain conditions, and rising awareness about SCS therapy are driving market growth.
Spinal Cord Stimulation Devices Industry Trends & Analysis
The SCS devices market is experiencing substantial growth, propelled by several key factors. The rising prevalence of chronic pain conditions, such as back pain and peripheral neuropathy, fuels demand for effective and minimally invasive treatment options. Technological advancements, like the introduction of rechargeable and less invasive implantable pulse generators (IPGs), are improving patient outcomes and expanding market accessibility.
The market is also witnessing a shift towards personalized medicine, with tailored treatment strategies emerging based on patient-specific needs. Furthermore, the growing adoption of advanced imaging techniques for precise lead placement and improved surgical precision enhances treatment efficacy. Competitive dynamics are marked by continuous product innovation, strategic partnerships, and expansion into emerging markets. The market is expected to witness a significant increase in the adoption of advanced SCS systems with closed-loop technology, which automatically adjusts stimulation parameters based on patient's physiological responses. This trend significantly contributes to improved patient outcomes and market growth.
Leading Markets & Segments in Spinal Cord Stimulation Devices
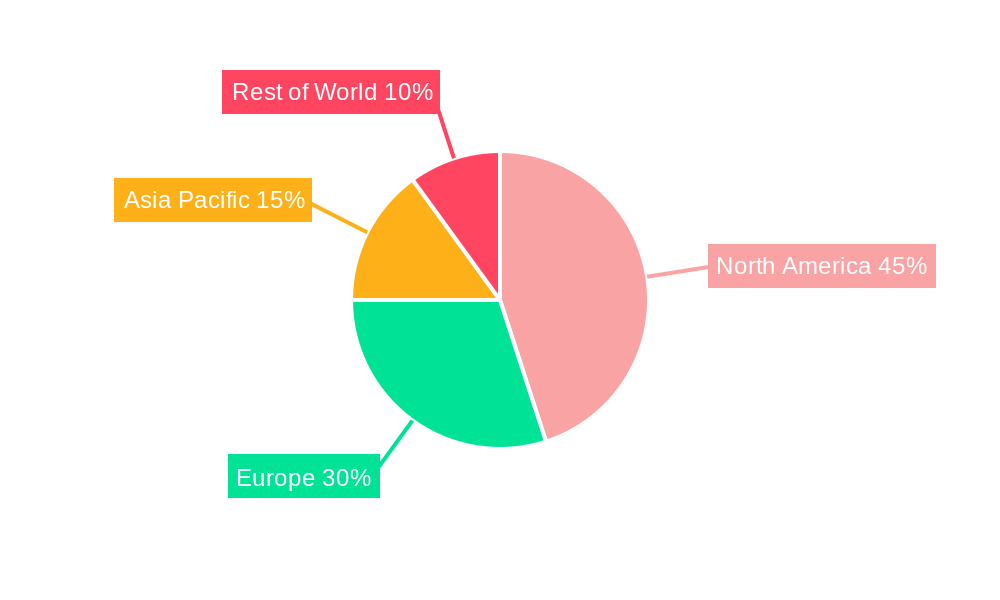
The North American market currently dominates the global SCS devices market, accounting for approximately XX% of the global revenue in 2025. This dominance is attributable to several factors:
- Key Drivers in North America:
- High prevalence of chronic pain conditions.
- Advanced healthcare infrastructure.
- High healthcare expenditure.
- Favorable reimbursement policies.
- Strong presence of major market players.
Europe represents the second-largest market, with a significant market share of XX% in 2025, followed by the Asia-Pacific region at XX%. Growth in these regions is driven by rising healthcare spending, expanding healthcare infrastructure, and increasing awareness of SCS therapy. The segment focused on treating chronic back pain holds the largest market share, attributed to the high prevalence of this condition globally.
Spinal Cord Stimulation Devices Product Developments
Recent years have witnessed significant advancements in SCS technology, including the development of smaller, more comfortable implantable pulse generators (IPGs), leadless SCS systems offering minimal invasiveness, and advanced algorithms for personalized stimulation patterns. These improvements enhance patient comfort, reduce complications, and improve treatment efficacy, driving market growth and broadening the addressable patient population. Closed-loop systems, which automatically adjust stimulation based on real-time patient feedback, are gaining traction, showcasing the ongoing technological innovation.
Key Drivers of Spinal Cord Stimulation Devices Growth
The market's growth is fueled by a confluence of factors:
- Technological Advancements: Miniaturization of devices, improved lead designs, and closed-loop systems enhance efficacy and patient comfort.
- Economic Factors: Increased healthcare spending and insurance coverage for SCS therapy in several countries.
- Regulatory Approvals: Continued regulatory approvals of innovative devices expand market accessibility.
Challenges in the Spinal Cord Stimulation Devices Market
Despite significant growth potential, the SCS devices market faces certain challenges:
- High Cost of Treatment: The high cost of devices and procedures limits accessibility in some regions.
- Device Complications: Potential side effects and complications, such as lead migration or infection, can impact market adoption.
- Competitive Intensity: Intense competition among established players and emerging companies necessitates continuous innovation and strategic maneuvering.
Emerging Opportunities in Spinal Cord Stimulation Devices
The future holds several opportunities for growth, including:
- Expansion into Emerging Markets: Untapped potential exists in developing countries with rising healthcare infrastructure and increasing prevalence of chronic pain.
- Technological Innovation: The development of novel stimulation techniques, such as dorsal root ganglion (DRG) stimulation, offers new treatment avenues.
- Strategic Partnerships: Collaboration among device manufacturers, clinicians, and research institutions can accelerate innovation and market penetration.
Leading Players in the Spinal Cord Stimulation Devices Sector
Key Milestones in Spinal Cord Stimulation Devices Industry
- 2020: FDA approval of a new leadless SCS system.
- 2021: Launch of a closed-loop SCS system by a major player.
- 2022: Acquisition of a smaller SCS device company by a larger competitor.
- 2023: Publication of key clinical trial data demonstrating the efficacy of a new SCS technology.
- 2024: Expansion of insurance coverage for SCS therapy in a major market.
Strategic Outlook for Spinal Cord Stimulation Devices Market
The spinal cord stimulation devices market is poised for sustained growth, driven by technological advancements, expanding treatment indications, and increasing market penetration in developing regions. Strategic opportunities lie in focusing on personalized medicine approaches, enhancing device capabilities through AI and machine learning integration, and forging strategic collaborations to access broader markets. The focus on improving patient outcomes through innovative technology and accessible treatment options will be critical for sustained market leadership and growth in the coming years.
Spinal Cord Stimulation Devices Segmentation
-
1. Application
- 1.1. Hospitals
- 1.2. Ambulatory Surgery Centers
-
2. Types
- 2.1. Rechargeable SCS
- 2.2. Non-Rechargeable SCS
Spinal Cord Stimulation Devices Segmentation By Geography
-
1. North America
- 1.1. United States
- 1.2. Canada
- 1.3. Mexico
-
2. South America
- 2.1. Brazil
- 2.2. Argentina
- 2.3. Rest of South America
-
3. Europe
- 3.1. United Kingdom
- 3.2. Germany
- 3.3. France
- 3.4. Italy
- 3.5. Spain
- 3.6. Russia
- 3.7. Benelux
- 3.8. Nordics
- 3.9. Rest of Europe
-
4. Middle East & Africa
- 4.1. Turkey
- 4.2. Israel
- 4.3. GCC
- 4.4. North Africa
- 4.5. South Africa
- 4.6. Rest of Middle East & Africa
-
5. Asia Pacific
- 5.1. China
- 5.2. India
- 5.3. Japan
- 5.4. South Korea
- 5.5. ASEAN
- 5.6. Oceania
- 5.7. Rest of Asia Pacific
Spinal Cord Stimulation Devices Regional Market Share
Geographic Coverage of Spinal Cord Stimulation Devices
Spinal Cord Stimulation Devices REPORT HIGHLIGHTS
| Aspects | Details |
|---|---|
| Study Period | 2020-2034 |
| Base Year | 2025 |
| Estimated Year | 2026 |
| Forecast Period | 2026-2034 |
| Historical Period | 2020-2025 |
| Growth Rate | CAGR of 11.98% from 2020-2034 |
| Segmentation |
|
Table of Contents
- 1. Introduction
- 1.1. Research Scope
- 1.2. Market Segmentation
- 1.3. Research Objective
- 1.4. Definitions and Assumptions
- 2. Executive Summary
- 2.1. Market Snapshot
- 3. Market Dynamics
- 3.1. Market Drivers
- 3.2. Market Restrains
- 3.3. Market Trends
- 3.4. Market Opportunities
- 4. Market Factor Analysis
- 4.1. Porters Five Forces
- 4.1.1. Bargaining Power of Suppliers
- 4.1.2. Bargaining Power of Buyers
- 4.1.3. Threat of New Entrants
- 4.1.4. Threat of Substitutes
- 4.1.5. Competitive Rivalry
- 4.2. PESTEL analysis
- 4.3. BCG Analysis
- 4.3.1. Stars (High Growth, High Market Share)
- 4.3.2. Cash Cows (Low Growth, High Market Share)
- 4.3.3. Question Mark (High Growth, Low Market Share)
- 4.3.4. Dogs (Low Growth, Low Market Share)
- 4.4. Ansoff Matrix Analysis
- 4.5. Supply Chain Analysis
- 4.6. Regulatory Landscape
- 4.7. Current Market Potential and Opportunity Assessment (TAM–SAM–SOM Framework)
- 4.8. MDP Analyst Note
- 4.1. Porters Five Forces
- 5. Market Analysis, Insights and Forecast 2021-2033
- 5.1. Market Analysis, Insights and Forecast - by Application
- 5.1.1. Hospitals
- 5.1.2. Ambulatory Surgery Centers
- 5.2. Market Analysis, Insights and Forecast - by Types
- 5.2.1. Rechargeable SCS
- 5.2.2. Non-Rechargeable SCS
- 5.3. Market Analysis, Insights and Forecast - by Region
- 5.3.1. North America
- 5.3.2. South America
- 5.3.3. Europe
- 5.3.4. Middle East & Africa
- 5.3.5. Asia Pacific
- 5.1. Market Analysis, Insights and Forecast - by Application
- 6. Global Spinal Cord Stimulation Devices Analysis, Insights and Forecast, 2021-2033
- 6.1. Market Analysis, Insights and Forecast - by Application
- 6.1.1. Hospitals
- 6.1.2. Ambulatory Surgery Centers
- 6.2. Market Analysis, Insights and Forecast - by Types
- 6.2.1. Rechargeable SCS
- 6.2.2. Non-Rechargeable SCS
- 6.1. Market Analysis, Insights and Forecast - by Application
- 7. North America Spinal Cord Stimulation Devices Analysis, Insights and Forecast, 2020-2032
- 7.1. Market Analysis, Insights and Forecast - by Application
- 7.1.1. Hospitals
- 7.1.2. Ambulatory Surgery Centers
- 7.2. Market Analysis, Insights and Forecast - by Types
- 7.2.1. Rechargeable SCS
- 7.2.2. Non-Rechargeable SCS
- 7.1. Market Analysis, Insights and Forecast - by Application
- 8. South America Spinal Cord Stimulation Devices Analysis, Insights and Forecast, 2020-2032
- 8.1. Market Analysis, Insights and Forecast - by Application
- 8.1.1. Hospitals
- 8.1.2. Ambulatory Surgery Centers
- 8.2. Market Analysis, Insights and Forecast - by Types
- 8.2.1. Rechargeable SCS
- 8.2.2. Non-Rechargeable SCS
- 8.1. Market Analysis, Insights and Forecast - by Application
- 9. Europe Spinal Cord Stimulation Devices Analysis, Insights and Forecast, 2020-2032
- 9.1. Market Analysis, Insights and Forecast - by Application
- 9.1.1. Hospitals
- 9.1.2. Ambulatory Surgery Centers
- 9.2. Market Analysis, Insights and Forecast - by Types
- 9.2.1. Rechargeable SCS
- 9.2.2. Non-Rechargeable SCS
- 9.1. Market Analysis, Insights and Forecast - by Application
- 10. Middle East & Africa Spinal Cord Stimulation Devices Analysis, Insights and Forecast, 2020-2032
- 10.1. Market Analysis, Insights and Forecast - by Application
- 10.1.1. Hospitals
- 10.1.2. Ambulatory Surgery Centers
- 10.2. Market Analysis, Insights and Forecast - by Types
- 10.2.1. Rechargeable SCS
- 10.2.2. Non-Rechargeable SCS
- 10.1. Market Analysis, Insights and Forecast - by Application
- 11. Asia Pacific Spinal Cord Stimulation Devices Analysis, Insights and Forecast, 2020-2032
- 11.1. Market Analysis, Insights and Forecast - by Application
- 11.1.1. Hospitals
- 11.1.2. Ambulatory Surgery Centers
- 11.2. Market Analysis, Insights and Forecast - by Types
- 11.2.1. Rechargeable SCS
- 11.2.2. Non-Rechargeable SCS
- 11.1. Market Analysis, Insights and Forecast - by Application
- 12. Competitive Analysis
- 12.1. Company Profiles
- 12.1.1 Medtronic
- 12.1.1.1. Company Overview
- 12.1.1.2. Products
- 12.1.1.3. Company Financials
- 12.1.1.4. SWOT Analysis
- 12.1.2 Boston Scientific
- 12.1.2.1. Company Overview
- 12.1.2.2. Products
- 12.1.2.3. Company Financials
- 12.1.2.4. SWOT Analysis
- 12.1.3 Abbott (St. Jude Medical)
- 12.1.3.1. Company Overview
- 12.1.3.2. Products
- 12.1.3.3. Company Financials
- 12.1.3.4. SWOT Analysis
- 12.1.4 Nevro
- 12.1.4.1. Company Overview
- 12.1.4.2. Products
- 12.1.4.3. Company Financials
- 12.1.4.4. SWOT Analysis
- 12.1.5 Nuvectra
- 12.1.5.1. Company Overview
- 12.1.5.2. Products
- 12.1.5.3. Company Financials
- 12.1.5.4. SWOT Analysis
- 12.1.1 Medtronic
- 12.2. Market Entropy
- 12.2.1 Company's Key Areas Served
- 12.2.2 Recent Developments
- 12.3. Company Market Share Analysis 2025
- 12.3.1 Top 5 Companies Market Share Analysis
- 12.3.2 Top 3 Companies Market Share Analysis
- 12.4. List of Potential Customers
- 13. Research Methodology
List of Figures
- Figure 1: Global Spinal Cord Stimulation Devices Revenue Breakdown (million, %) by Region 2025 & 2033
- Figure 2: Global Spinal Cord Stimulation Devices Volume Breakdown (K, %) by Region 2025 & 2033
- Figure 3: North America Spinal Cord Stimulation Devices Revenue (million), by Application 2025 & 2033
- Figure 4: North America Spinal Cord Stimulation Devices Volume (K), by Application 2025 & 2033
- Figure 5: North America Spinal Cord Stimulation Devices Revenue Share (%), by Application 2025 & 2033
- Figure 6: North America Spinal Cord Stimulation Devices Volume Share (%), by Application 2025 & 2033
- Figure 7: North America Spinal Cord Stimulation Devices Revenue (million), by Types 2025 & 2033
- Figure 8: North America Spinal Cord Stimulation Devices Volume (K), by Types 2025 & 2033
- Figure 9: North America Spinal Cord Stimulation Devices Revenue Share (%), by Types 2025 & 2033
- Figure 10: North America Spinal Cord Stimulation Devices Volume Share (%), by Types 2025 & 2033
- Figure 11: North America Spinal Cord Stimulation Devices Revenue (million), by Country 2025 & 2033
- Figure 12: North America Spinal Cord Stimulation Devices Volume (K), by Country 2025 & 2033
- Figure 13: North America Spinal Cord Stimulation Devices Revenue Share (%), by Country 2025 & 2033
- Figure 14: North America Spinal Cord Stimulation Devices Volume Share (%), by Country 2025 & 2033
- Figure 15: South America Spinal Cord Stimulation Devices Revenue (million), by Application 2025 & 2033
- Figure 16: South America Spinal Cord Stimulation Devices Volume (K), by Application 2025 & 2033
- Figure 17: South America Spinal Cord Stimulation Devices Revenue Share (%), by Application 2025 & 2033
- Figure 18: South America Spinal Cord Stimulation Devices Volume Share (%), by Application 2025 & 2033
- Figure 19: South America Spinal Cord Stimulation Devices Revenue (million), by Types 2025 & 2033
- Figure 20: South America Spinal Cord Stimulation Devices Volume (K), by Types 2025 & 2033
- Figure 21: South America Spinal Cord Stimulation Devices Revenue Share (%), by Types 2025 & 2033
- Figure 22: South America Spinal Cord Stimulation Devices Volume Share (%), by Types 2025 & 2033
- Figure 23: South America Spinal Cord Stimulation Devices Revenue (million), by Country 2025 & 2033
- Figure 24: South America Spinal Cord Stimulation Devices Volume (K), by Country 2025 & 2033
- Figure 25: South America Spinal Cord Stimulation Devices Revenue Share (%), by Country 2025 & 2033
- Figure 26: South America Spinal Cord Stimulation Devices Volume Share (%), by Country 2025 & 2033
- Figure 27: Europe Spinal Cord Stimulation Devices Revenue (million), by Application 2025 & 2033
- Figure 28: Europe Spinal Cord Stimulation Devices Volume (K), by Application 2025 & 2033
- Figure 29: Europe Spinal Cord Stimulation Devices Revenue Share (%), by Application 2025 & 2033
- Figure 30: Europe Spinal Cord Stimulation Devices Volume Share (%), by Application 2025 & 2033
- Figure 31: Europe Spinal Cord Stimulation Devices Revenue (million), by Types 2025 & 2033
- Figure 32: Europe Spinal Cord Stimulation Devices Volume (K), by Types 2025 & 2033
- Figure 33: Europe Spinal Cord Stimulation Devices Revenue Share (%), by Types 2025 & 2033
- Figure 34: Europe Spinal Cord Stimulation Devices Volume Share (%), by Types 2025 & 2033
- Figure 35: Europe Spinal Cord Stimulation Devices Revenue (million), by Country 2025 & 2033
- Figure 36: Europe Spinal Cord Stimulation Devices Volume (K), by Country 2025 & 2033
- Figure 37: Europe Spinal Cord Stimulation Devices Revenue Share (%), by Country 2025 & 2033
- Figure 38: Europe Spinal Cord Stimulation Devices Volume Share (%), by Country 2025 & 2033
- Figure 39: Middle East & Africa Spinal Cord Stimulation Devices Revenue (million), by Application 2025 & 2033
- Figure 40: Middle East & Africa Spinal Cord Stimulation Devices Volume (K), by Application 2025 & 2033
- Figure 41: Middle East & Africa Spinal Cord Stimulation Devices Revenue Share (%), by Application 2025 & 2033
- Figure 42: Middle East & Africa Spinal Cord Stimulation Devices Volume Share (%), by Application 2025 & 2033
- Figure 43: Middle East & Africa Spinal Cord Stimulation Devices Revenue (million), by Types 2025 & 2033
- Figure 44: Middle East & Africa Spinal Cord Stimulation Devices Volume (K), by Types 2025 & 2033
- Figure 45: Middle East & Africa Spinal Cord Stimulation Devices Revenue Share (%), by Types 2025 & 2033
- Figure 46: Middle East & Africa Spinal Cord Stimulation Devices Volume Share (%), by Types 2025 & 2033
- Figure 47: Middle East & Africa Spinal Cord Stimulation Devices Revenue (million), by Country 2025 & 2033
- Figure 48: Middle East & Africa Spinal Cord Stimulation Devices Volume (K), by Country 2025 & 2033
- Figure 49: Middle East & Africa Spinal Cord Stimulation Devices Revenue Share (%), by Country 2025 & 2033
- Figure 50: Middle East & Africa Spinal Cord Stimulation Devices Volume Share (%), by Country 2025 & 2033
- Figure 51: Asia Pacific Spinal Cord Stimulation Devices Revenue (million), by Application 2025 & 2033
- Figure 52: Asia Pacific Spinal Cord Stimulation Devices Volume (K), by Application 2025 & 2033
- Figure 53: Asia Pacific Spinal Cord Stimulation Devices Revenue Share (%), by Application 2025 & 2033
- Figure 54: Asia Pacific Spinal Cord Stimulation Devices Volume Share (%), by Application 2025 & 2033
- Figure 55: Asia Pacific Spinal Cord Stimulation Devices Revenue (million), by Types 2025 & 2033
- Figure 56: Asia Pacific Spinal Cord Stimulation Devices Volume (K), by Types 2025 & 2033
- Figure 57: Asia Pacific Spinal Cord Stimulation Devices Revenue Share (%), by Types 2025 & 2033
- Figure 58: Asia Pacific Spinal Cord Stimulation Devices Volume Share (%), by Types 2025 & 2033
- Figure 59: Asia Pacific Spinal Cord Stimulation Devices Revenue (million), by Country 2025 & 2033
- Figure 60: Asia Pacific Spinal Cord Stimulation Devices Volume (K), by Country 2025 & 2033
- Figure 61: Asia Pacific Spinal Cord Stimulation Devices Revenue Share (%), by Country 2025 & 2033
- Figure 62: Asia Pacific Spinal Cord Stimulation Devices Volume Share (%), by Country 2025 & 2033
List of Tables
- Table 1: Global Spinal Cord Stimulation Devices Revenue million Forecast, by Application 2020 & 2033
- Table 2: Global Spinal Cord Stimulation Devices Volume K Forecast, by Application 2020 & 2033
- Table 3: Global Spinal Cord Stimulation Devices Revenue million Forecast, by Types 2020 & 2033
- Table 4: Global Spinal Cord Stimulation Devices Volume K Forecast, by Types 2020 & 2033
- Table 5: Global Spinal Cord Stimulation Devices Revenue million Forecast, by Region 2020 & 2033
- Table 6: Global Spinal Cord Stimulation Devices Volume K Forecast, by Region 2020 & 2033
- Table 7: Global Spinal Cord Stimulation Devices Revenue million Forecast, by Application 2020 & 2033
- Table 8: Global Spinal Cord Stimulation Devices Volume K Forecast, by Application 2020 & 2033
- Table 9: Global Spinal Cord Stimulation Devices Revenue million Forecast, by Types 2020 & 2033
- Table 10: Global Spinal Cord Stimulation Devices Volume K Forecast, by Types 2020 & 2033
- Table 11: Global Spinal Cord Stimulation Devices Revenue million Forecast, by Country 2020 & 2033
- Table 12: Global Spinal Cord Stimulation Devices Volume K Forecast, by Country 2020 & 2033
- Table 13: United States Spinal Cord Stimulation Devices Revenue (million) Forecast, by Application 2020 & 2033
- Table 14: United States Spinal Cord Stimulation Devices Volume (K) Forecast, by Application 2020 & 2033
- Table 15: Canada Spinal Cord Stimulation Devices Revenue (million) Forecast, by Application 2020 & 2033
- Table 16: Canada Spinal Cord Stimulation Devices Volume (K) Forecast, by Application 2020 & 2033
- Table 17: Mexico Spinal Cord Stimulation Devices Revenue (million) Forecast, by Application 2020 & 2033
- Table 18: Mexico Spinal Cord Stimulation Devices Volume (K) Forecast, by Application 2020 & 2033
- Table 19: Global Spinal Cord Stimulation Devices Revenue million Forecast, by Application 2020 & 2033
- Table 20: Global Spinal Cord Stimulation Devices Volume K Forecast, by Application 2020 & 2033
- Table 21: Global Spinal Cord Stimulation Devices Revenue million Forecast, by Types 2020 & 2033
- Table 22: Global Spinal Cord Stimulation Devices Volume K Forecast, by Types 2020 & 2033
- Table 23: Global Spinal Cord Stimulation Devices Revenue million Forecast, by Country 2020 & 2033
- Table 24: Global Spinal Cord Stimulation Devices Volume K Forecast, by Country 2020 & 2033
- Table 25: Brazil Spinal Cord Stimulation Devices Revenue (million) Forecast, by Application 2020 & 2033
- Table 26: Brazil Spinal Cord Stimulation Devices Volume (K) Forecast, by Application 2020 & 2033
- Table 27: Argentina Spinal Cord Stimulation Devices Revenue (million) Forecast, by Application 2020 & 2033
- Table 28: Argentina Spinal Cord Stimulation Devices Volume (K) Forecast, by Application 2020 & 2033
- Table 29: Rest of South America Spinal Cord Stimulation Devices Revenue (million) Forecast, by Application 2020 & 2033
- Table 30: Rest of South America Spinal Cord Stimulation Devices Volume (K) Forecast, by Application 2020 & 2033
- Table 31: Global Spinal Cord Stimulation Devices Revenue million Forecast, by Application 2020 & 2033
- Table 32: Global Spinal Cord Stimulation Devices Volume K Forecast, by Application 2020 & 2033
- Table 33: Global Spinal Cord Stimulation Devices Revenue million Forecast, by Types 2020 & 2033
- Table 34: Global Spinal Cord Stimulation Devices Volume K Forecast, by Types 2020 & 2033
- Table 35: Global Spinal Cord Stimulation Devices Revenue million Forecast, by Country 2020 & 2033
- Table 36: Global Spinal Cord Stimulation Devices Volume K Forecast, by Country 2020 & 2033
- Table 37: United Kingdom Spinal Cord Stimulation Devices Revenue (million) Forecast, by Application 2020 & 2033
- Table 38: United Kingdom Spinal Cord Stimulation Devices Volume (K) Forecast, by Application 2020 & 2033
- Table 39: Germany Spinal Cord Stimulation Devices Revenue (million) Forecast, by Application 2020 & 2033
- Table 40: Germany Spinal Cord Stimulation Devices Volume (K) Forecast, by Application 2020 & 2033
- Table 41: France Spinal Cord Stimulation Devices Revenue (million) Forecast, by Application 2020 & 2033
- Table 42: France Spinal Cord Stimulation Devices Volume (K) Forecast, by Application 2020 & 2033
- Table 43: Italy Spinal Cord Stimulation Devices Revenue (million) Forecast, by Application 2020 & 2033
- Table 44: Italy Spinal Cord Stimulation Devices Volume (K) Forecast, by Application 2020 & 2033
- Table 45: Spain Spinal Cord Stimulation Devices Revenue (million) Forecast, by Application 2020 & 2033
- Table 46: Spain Spinal Cord Stimulation Devices Volume (K) Forecast, by Application 2020 & 2033
- Table 47: Russia Spinal Cord Stimulation Devices Revenue (million) Forecast, by Application 2020 & 2033
- Table 48: Russia Spinal Cord Stimulation Devices Volume (K) Forecast, by Application 2020 & 2033
- Table 49: Benelux Spinal Cord Stimulation Devices Revenue (million) Forecast, by Application 2020 & 2033
- Table 50: Benelux Spinal Cord Stimulation Devices Volume (K) Forecast, by Application 2020 & 2033
- Table 51: Nordics Spinal Cord Stimulation Devices Revenue (million) Forecast, by Application 2020 & 2033
- Table 52: Nordics Spinal Cord Stimulation Devices Volume (K) Forecast, by Application 2020 & 2033
- Table 53: Rest of Europe Spinal Cord Stimulation Devices Revenue (million) Forecast, by Application 2020 & 2033
- Table 54: Rest of Europe Spinal Cord Stimulation Devices Volume (K) Forecast, by Application 2020 & 2033
- Table 55: Global Spinal Cord Stimulation Devices Revenue million Forecast, by Application 2020 & 2033
- Table 56: Global Spinal Cord Stimulation Devices Volume K Forecast, by Application 2020 & 2033
- Table 57: Global Spinal Cord Stimulation Devices Revenue million Forecast, by Types 2020 & 2033
- Table 58: Global Spinal Cord Stimulation Devices Volume K Forecast, by Types 2020 & 2033
- Table 59: Global Spinal Cord Stimulation Devices Revenue million Forecast, by Country 2020 & 2033
- Table 60: Global Spinal Cord Stimulation Devices Volume K Forecast, by Country 2020 & 2033
- Table 61: Turkey Spinal Cord Stimulation Devices Revenue (million) Forecast, by Application 2020 & 2033
- Table 62: Turkey Spinal Cord Stimulation Devices Volume (K) Forecast, by Application 2020 & 2033
- Table 63: Israel Spinal Cord Stimulation Devices Revenue (million) Forecast, by Application 2020 & 2033
- Table 64: Israel Spinal Cord Stimulation Devices Volume (K) Forecast, by Application 2020 & 2033
- Table 65: GCC Spinal Cord Stimulation Devices Revenue (million) Forecast, by Application 2020 & 2033
- Table 66: GCC Spinal Cord Stimulation Devices Volume (K) Forecast, by Application 2020 & 2033
- Table 67: North Africa Spinal Cord Stimulation Devices Revenue (million) Forecast, by Application 2020 & 2033
- Table 68: North Africa Spinal Cord Stimulation Devices Volume (K) Forecast, by Application 2020 & 2033
- Table 69: South Africa Spinal Cord Stimulation Devices Revenue (million) Forecast, by Application 2020 & 2033
- Table 70: South Africa Spinal Cord Stimulation Devices Volume (K) Forecast, by Application 2020 & 2033
- Table 71: Rest of Middle East & Africa Spinal Cord Stimulation Devices Revenue (million) Forecast, by Application 2020 & 2033
- Table 72: Rest of Middle East & Africa Spinal Cord Stimulation Devices Volume (K) Forecast, by Application 2020 & 2033
- Table 73: Global Spinal Cord Stimulation Devices Revenue million Forecast, by Application 2020 & 2033
- Table 74: Global Spinal Cord Stimulation Devices Volume K Forecast, by Application 2020 & 2033
- Table 75: Global Spinal Cord Stimulation Devices Revenue million Forecast, by Types 2020 & 2033
- Table 76: Global Spinal Cord Stimulation Devices Volume K Forecast, by Types 2020 & 2033
- Table 77: Global Spinal Cord Stimulation Devices Revenue million Forecast, by Country 2020 & 2033
- Table 78: Global Spinal Cord Stimulation Devices Volume K Forecast, by Country 2020 & 2033
- Table 79: China Spinal Cord Stimulation Devices Revenue (million) Forecast, by Application 2020 & 2033
- Table 80: China Spinal Cord Stimulation Devices Volume (K) Forecast, by Application 2020 & 2033
- Table 81: India Spinal Cord Stimulation Devices Revenue (million) Forecast, by Application 2020 & 2033
- Table 82: India Spinal Cord Stimulation Devices Volume (K) Forecast, by Application 2020 & 2033
- Table 83: Japan Spinal Cord Stimulation Devices Revenue (million) Forecast, by Application 2020 & 2033
- Table 84: Japan Spinal Cord Stimulation Devices Volume (K) Forecast, by Application 2020 & 2033
- Table 85: South Korea Spinal Cord Stimulation Devices Revenue (million) Forecast, by Application 2020 & 2033
- Table 86: South Korea Spinal Cord Stimulation Devices Volume (K) Forecast, by Application 2020 & 2033
- Table 87: ASEAN Spinal Cord Stimulation Devices Revenue (million) Forecast, by Application 2020 & 2033
- Table 88: ASEAN Spinal Cord Stimulation Devices Volume (K) Forecast, by Application 2020 & 2033
- Table 89: Oceania Spinal Cord Stimulation Devices Revenue (million) Forecast, by Application 2020 & 2033
- Table 90: Oceania Spinal Cord Stimulation Devices Volume (K) Forecast, by Application 2020 & 2033
- Table 91: Rest of Asia Pacific Spinal Cord Stimulation Devices Revenue (million) Forecast, by Application 2020 & 2033
- Table 92: Rest of Asia Pacific Spinal Cord Stimulation Devices Volume (K) Forecast, by Application 2020 & 2033
Frequently Asked Questions
1. What is the projected Compound Annual Growth Rate (CAGR) of the Spinal Cord Stimulation Devices?
The projected CAGR is approximately 11.98%.
2. Which companies are prominent players in the Spinal Cord Stimulation Devices?
Key companies in the market include Medtronic, Boston Scientific, Abbott (St. Jude Medical), Nevro, Nuvectra.
3. What are the main segments of the Spinal Cord Stimulation Devices?
The market segments include Application, Types.
4. Can you provide details about the market size?
The market size is estimated to be USD 8054.4 million as of 2022.
5. What are some drivers contributing to market growth?
N/A
6. What are the notable trends driving market growth?
N/A
7. Are there any restraints impacting market growth?
N/A
8. Can you provide examples of recent developments in the market?
N/A
9. What pricing options are available for accessing the report?
Pricing options include single-user, multi-user, and enterprise licenses priced at USD 3950.00, USD 5925.00, and USD 7900.00 respectively.
10. Is the market size provided in terms of value or volume?
The market size is provided in terms of value, measured in million and volume, measured in K.
11. Are there any specific market keywords associated with the report?
Yes, the market keyword associated with the report is "Spinal Cord Stimulation Devices," which aids in identifying and referencing the specific market segment covered.
12. How do I determine which pricing option suits my needs best?
The pricing options vary based on user requirements and access needs. Individual users may opt for single-user licenses, while businesses requiring broader access may choose multi-user or enterprise licenses for cost-effective access to the report.
13. Are there any additional resources or data provided in the Spinal Cord Stimulation Devices report?
While the report offers comprehensive insights, it's advisable to review the specific contents or supplementary materials provided to ascertain if additional resources or data are available.
14. How can I stay updated on further developments or reports in the Spinal Cord Stimulation Devices?
To stay informed about further developments, trends, and reports in the Spinal Cord Stimulation Devices, consider subscribing to industry newsletters, following relevant companies and organizations, or regularly checking reputable industry news sources and publications.
Methodology
Step 1 - Identification of Relevant Samples Size from Population Database


Step 2 - Approaches for Defining Global Market Size (Value, Volume* & Price*)

Note*: In applicable scenarios
Step 3 - Data Sources
Primary Research
- Web Analytics
- Survey Reports
- Research Institute
- Latest Research Reports
- Opinion Leaders
Secondary Research
- Annual Reports
- White Paper
- Latest Press Release
- Industry Association
- Paid Database
- Investor Presentations

Step 4 - Data Triangulation
Involves using different sources of information in order to increase the validity of a study
These sources are likely to be stakeholders in a program - participants, other researchers, program staff, other community members, and so on.
Then we put all data in single framework & apply various statistical tools to find out the dynamic on the market.
During the analysis stage, feedback from the stakeholder groups would be compared to determine areas of agreement as well as areas of divergence