

Key Insights
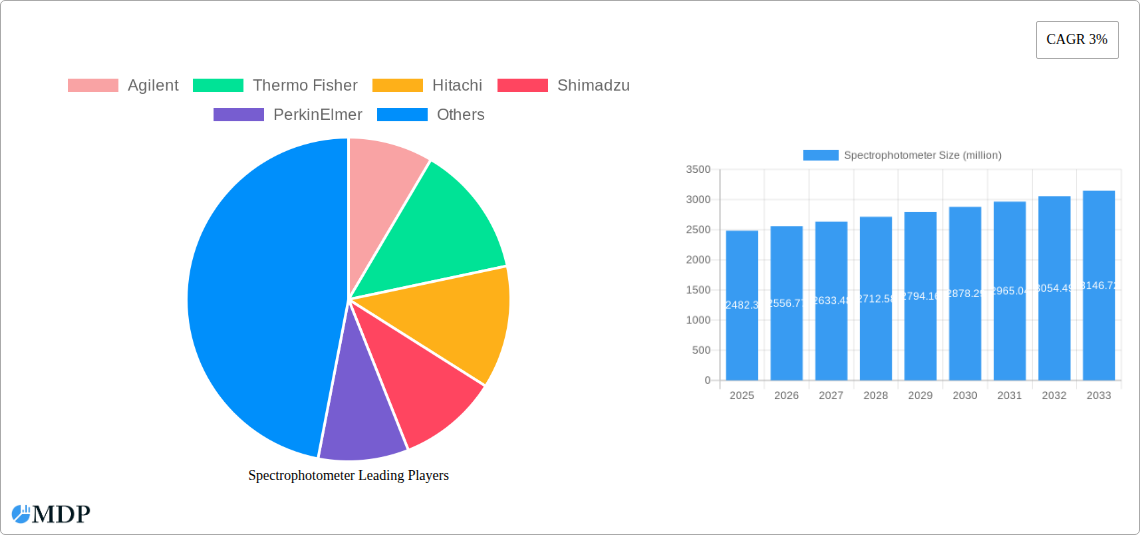
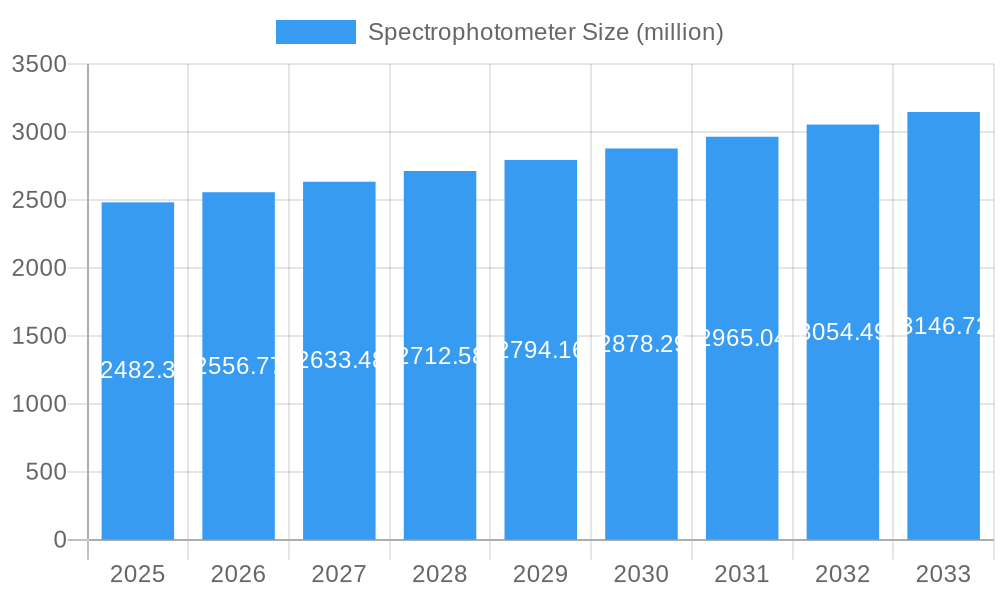
The global Spectrophotometer market is poised for steady growth, projected to reach $2,482.3 million by 2025, with a Compound Annual Growth Rate (CAGR) of 3% between 2025 and 2033. This expansion is largely driven by the increasing adoption of spectrophotometric techniques across a broad spectrum of industries, including pharmaceuticals, biotechnology, industrial chemistry, and food and beverage. The pharmaceutical and biotechnology sectors, in particular, are significant contributors, leveraging spectrophotometers for drug discovery, quality control, and biochemical analysis. Furthermore, advancements in spectrophotometer technology, such as enhanced sensitivity, miniaturization, and integration with automation systems, are fueling market demand. The growing emphasis on stringent quality control measures and regulatory compliance across various industries also necessitates the use of reliable analytical instruments like spectrophotometers.
Spectrophotometer Market Size (In Billion)
Key trends shaping the spectrophotometer market include the development of portable and handheld devices, which are expanding applications into field testing and point-of-care diagnostics. The increasing demand for rapid and efficient analytical solutions is also spurring innovation in software and data analysis capabilities for spectrophotometers. While the market benefits from these drivers, certain restraints may influence its trajectory. High initial investment costs for sophisticated spectrophotometer systems and the availability of alternative analytical techniques in niche applications could pose challenges. However, the consistent innovation and the essential role of spectrophotometry in scientific research and industrial processes are expected to sustain a positive growth outlook for the market throughout the forecast period.
Spectrophotometer Company Market Share
Spectrophotometer Market Analysis: Growth, Trends, and Opportunities (2019-2033)
Unlock comprehensive insights into the global spectrophotometer market with this in-depth report. Covering the period from 2019 to 2033, with a base and estimated year of 2025, this analysis delves into market dynamics, key trends, leading segments, product innovations, growth drivers, challenges, and emerging opportunities. We provide actionable intelligence for industry stakeholders, including pharmaceutical, biotechnology, industrial chemistry, food and beverage, and environmental sectors, across UV-Visible and IR spectrophotometer types.
Spectrophotometer Market Dynamics & Concentration
The global spectrophotometer market exhibits a moderate to high concentration, with key players like Agilent, Thermo Fisher Scientific, and Shimadzu holding substantial market share, estimated at over 60%. Innovation is a primary driver, fueled by relentless R&D to enhance sensitivity, speed, and automation. Regulatory frameworks, particularly stringent quality control in the pharmaceutical and food industries, mandate the use of advanced spectrophotometric techniques. Product substitutes, such as other analytical instrumentation offering similar functional capabilities, pose a mild threat. End-user trends indicate a growing demand for portable and handheld spectrophotometers for on-site analysis, particularly in environmental monitoring and field testing. Mergers and acquisitions (M&A) activity is a significant dynamic, with an estimated 25-35 M&A deals annually over the historical period, aimed at expanding product portfolios and market reach.
- Key Market Concentration Drivers:
- High R&D investment requirements for advanced instrumentation.
- Brand reputation and established customer loyalty.
- Patented technologies and proprietary software solutions.
- M&A Activity Focus:
- Acquisition of innovative startups by larger players.
- Consolidation to achieve economies of scale.
- Expansion into emerging geographic markets.
Spectrophotometer Industry Trends & Analysis
The spectrophotometer industry is poised for robust growth, driven by increasing demand for precise analytical solutions across diverse sectors. The market is projected to witness a Compound Annual Growth Rate (CAGR) of approximately 6.5% during the forecast period of 2025–2033. Technological disruptions are at the forefront, with advancements in areas like miniaturization, AI-powered data analysis, and enhanced spectral resolution enabling more sophisticated applications. Consumer preferences are shifting towards user-friendly interfaces, integrated software solutions for data management and interpretation, and greater automation to reduce human error and increase throughput. Competitive dynamics are characterized by intense product differentiation, strategic partnerships, and a continuous focus on delivering value-added features. Market penetration is expected to deepen as more developing economies adopt advanced analytical techniques in their industrial and research sectors. The estimated total market value in the base year 2025 is projected to be in the range of US $1.8 billion to US $2.0 billion.
- Growth Drivers:
- Increasing research and development activities in life sciences and material science.
- Rising stringency of quality control and regulatory compliance in industries.
- Growing adoption of spectrophotometers in point-of-care diagnostics and personalized medicine.
- Technological Innovations:
- Development of hyperspectral imaging and advanced spectroscopic techniques.
- Integration of machine learning and artificial intelligence for data interpretation.
- Miniaturization of spectrophotometers for portable and in-situ applications.
- Market Penetration:
- Expansion into emerging economies with growing industrial and research infrastructure.
- Increased application in food safety testing and environmental monitoring.
Leading Markets & Segments in Spectrophotometer
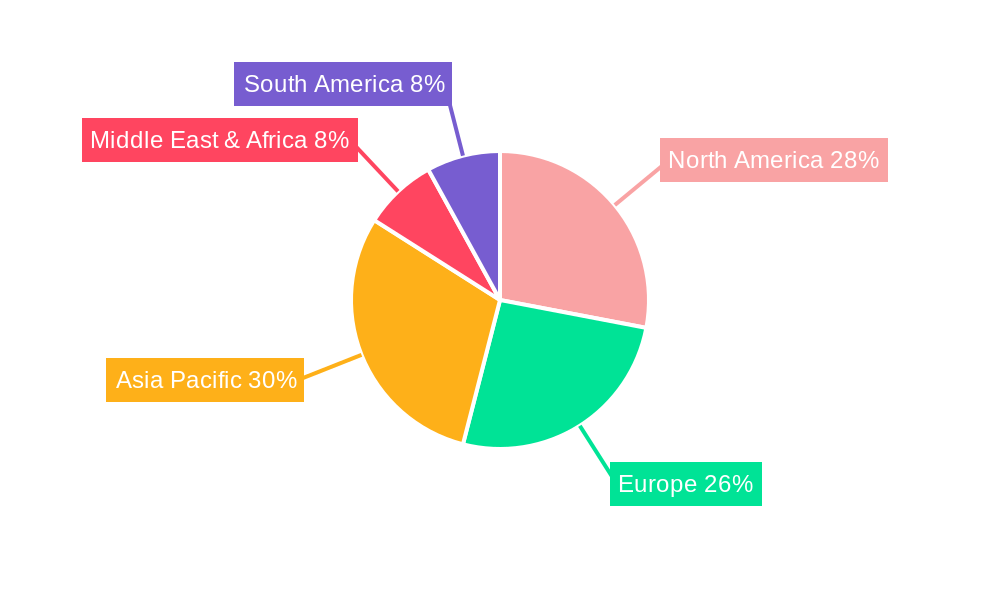
The Pharmaceutical and Biotechnology segments are dominant forces within the spectrophotometer market, collectively accounting for over 55% of the total market revenue. The UV-Visible Spectrophotometer type is the most widely adopted, representing approximately 70% of the market share due to its versatility and cost-effectiveness. Geographically, North America and Europe are leading markets, driven by established research infrastructure, significant R&D investments, and stringent regulatory standards. However, the Asia-Pacific region is emerging as a high-growth market, fueled by rapid industrialization, expanding pharmaceutical and biotechnology sectors, and increasing government initiatives to promote scientific research.
- Dominant Applications:
- Pharmaceutical: Drug discovery, quality control, formulation development, and quantitative analysis.
- Biotechnology: Protein analysis, DNA/RNA quantification, enzyme kinetics, and cell culture monitoring.
- Key Segment Drivers:
- Pharmaceutical: Robust drug development pipelines, increasing prevalence of chronic diseases, and demand for generic and biosimilar drugs.
- Biotechnology: Growth in biopharmaceuticals, advancements in genomics and proteomics, and increased investment in life science research.
- UV-Visible Spectrophotometer: Cost-effectiveness, wide range of applications, and ease of use.
- Leading Regions:
- North America: Advanced research institutions, strong pharmaceutical presence, and stringent FDA regulations.
- Europe: Well-established life science industry, supportive government funding for R&D, and stringent EMA regulations.
- Asia-Pacific: Rapidly growing pharmaceutical and biotechnology sectors, increasing foreign investment, and expanding domestic demand.
Spectrophotometer Product Developments
Recent product developments in the spectrophotometer market emphasize enhanced sensitivity, miniaturization, and integrated software solutions. Innovations focus on improving spectral resolution, expanding wavelength ranges, and enabling faster data acquisition for complex analyses. Companies are introducing portable and handheld devices for on-site testing in environmental and industrial settings, alongside advanced benchtop systems for sophisticated research applications. Competitive advantages are being carved out through features like automated sample handling, cloud-based data management, and AI-driven analytical software, catering to the increasing need for efficiency and data integrity in pharmaceutical, biotechnology, and industrial chemistry applications.
Key Drivers of Spectrophotometer Growth
Several key factors are propelling the growth of the spectrophotometer market. Technological advancements, including the development of more sensitive detectors and sophisticated optical systems, are enabling higher precision and wider application ranges. Economic growth, particularly in emerging markets, is leading to increased investments in research and development and industrial expansion, thereby boosting demand for analytical instrumentation. Furthermore, evolving regulatory frameworks, especially in the pharmaceutical and food safety sectors, necessitate the use of advanced spectrophotometric techniques for rigorous quality control and compliance.
- Technological Innovations: Miniaturization, improved sensitivity, and faster acquisition times.
- Economic Expansion: Increased R&D funding and industrial growth in developing economies.
- Regulatory Mandates: Stringent quality control requirements in regulated industries like pharmaceuticals and food.
Challenges in the Spectrophotometer Market
Despite robust growth, the spectrophotometer market faces certain challenges. High initial investment costs for advanced spectrophotometers can be a barrier for smaller research institutions and companies. Stringent calibration and maintenance requirements, along with the need for skilled personnel to operate and interpret data from sophisticated instruments, can also present hurdles. Furthermore, the competitive landscape is intense, with established players and emerging manufacturers vying for market share, leading to pricing pressures. Supply chain disruptions, as observed in recent global events, can impact the availability of critical components, potentially leading to production delays and increased costs, with estimated impacts on production timelines of up to 15-20%.
- High Capital Expenditure: Cost of advanced spectrophotometric equipment.
- Technical Expertise Requirement: Need for trained personnel for operation and data interpretation.
- Intense Competition: Pricing pressures and market saturation in certain segments.
Emerging Opportunities in Spectrophotometer
Emerging opportunities in the spectrophotometer market lie in the burgeoning fields of personalized medicine, advanced materials science, and sustainable industrial processes. The demand for rapid and portable analytical tools for point-of-care diagnostics and on-site environmental monitoring presents significant growth catalysts. Strategic partnerships between instrument manufacturers and software developers are creating integrated solutions for enhanced data analytics and workflow automation. Market expansion into developing regions, coupled with the increasing adoption of spectrophotometry in emerging applications like agri-food testing and water quality monitoring, are expected to drive long-term market growth.
Leading Players in the Spectrophotometer Sector
- Agilent
- Thermo Fisher Scientific
- Hitachi
- Shimadzu
- PerkinElmer
- Hach
- Beckman Coulter
- Xylem
- VWR
- Biochrom
- Analytik Jena
- JASCO
- BioTek
- Bibby Scientific
- PG Instruments
- B&W Tek
- INESA
- Spectrum
- Shanghai Lab-Spectrum Instruments
Key Milestones in Spectrophotometer Industry
- 2019: Launch of novel portable UV-Vis spectrophotometers with advanced connectivity for field applications.
- 2020: Significant advancements in AI-driven spectral analysis software for enhanced data interpretation and predictive capabilities.
- 2021: Increased M&A activity focused on acquiring companies with expertise in miniaturization and micro-spectrophotometer technology.
- 2022: Introduction of next-generation IR spectrophotometers with improved sensitivity and broader spectral coverage for material science.
- 2023: Growing adoption of cloud-based platforms for spectrophotometer data management and remote collaboration in pharmaceutical R&D.
- 2024: Emergence of hyperspectral imaging spectrophotometers with enhanced spatial and spectral resolution for detailed sample analysis.
Strategic Outlook for Spectrophotometer Market
The strategic outlook for the spectrophotometer market is characterized by continued innovation, market diversification, and a focus on customer-centric solutions. Growth accelerators include the increasing integration of AI and machine learning for data interpretation, the development of more compact and portable devices for on-site analysis, and expansion into emerging applications such as environmental monitoring and food safety. Strategic partnerships and collaborations will be crucial for technology development and market penetration. The market is poised for sustained expansion as the demand for precise and efficient analytical techniques continues to rise across various industries, especially within the pharmaceutical and biotechnology sectors, projected to see an average growth of 7% in instrument adoption.
Spectrophotometer Segmentation
-
1. Application
- 1.1. Pharmaceutical
- 1.2. Biotechnology
- 1.3. Industrial Chemistry
- 1.4. Food and Beverage
- 1.5. Environmental
- 1.6. Others
-
2. Types
- 2.1. UV-Visible Spectrophotometer
- 2.2. IR Spectrophotometer
Spectrophotometer Segmentation By Geography
-
1. North America
- 1.1. United States
- 1.2. Canada
- 1.3. Mexico
-
2. South America
- 2.1. Brazil
- 2.2. Argentina
- 2.3. Rest of South America
-
3. Europe
- 3.1. United Kingdom
- 3.2. Germany
- 3.3. France
- 3.4. Italy
- 3.5. Spain
- 3.6. Russia
- 3.7. Benelux
- 3.8. Nordics
- 3.9. Rest of Europe
-
4. Middle East & Africa
- 4.1. Turkey
- 4.2. Israel
- 4.3. GCC
- 4.4. North Africa
- 4.5. South Africa
- 4.6. Rest of Middle East & Africa
-
5. Asia Pacific
- 5.1. China
- 5.2. India
- 5.3. Japan
- 5.4. South Korea
- 5.5. ASEAN
- 5.6. Oceania
- 5.7. Rest of Asia Pacific
Spectrophotometer Regional Market Share
Geographic Coverage of Spectrophotometer
Spectrophotometer REPORT HIGHLIGHTS
| Aspects | Details |
|---|---|
| Study Period | 2020-2034 |
| Base Year | 2025 |
| Estimated Year | 2026 |
| Forecast Period | 2026-2034 |
| Historical Period | 2020-2025 |
| Growth Rate | CAGR of 3% from 2020-2034 |
| Segmentation |
|
Table of Contents
- 1. Introduction
- 1.1. Research Scope
- 1.2. Market Segmentation
- 1.3. Research Objective
- 1.4. Definitions and Assumptions
- 2. Executive Summary
- 2.1. Market Snapshot
- 3. Market Dynamics
- 3.1. Market Drivers
- 3.2. Market Restrains
- 3.3. Market Trends
- 3.4. Market Opportunities
- 4. Market Factor Analysis
- 4.1. Porters Five Forces
- 4.1.1. Bargaining Power of Suppliers
- 4.1.2. Bargaining Power of Buyers
- 4.1.3. Threat of New Entrants
- 4.1.4. Threat of Substitutes
- 4.1.5. Competitive Rivalry
- 4.2. PESTEL analysis
- 4.3. BCG Analysis
- 4.3.1. Stars (High Growth, High Market Share)
- 4.3.2. Cash Cows (Low Growth, High Market Share)
- 4.3.3. Question Mark (High Growth, Low Market Share)
- 4.3.4. Dogs (Low Growth, Low Market Share)
- 4.4. Ansoff Matrix Analysis
- 4.5. Supply Chain Analysis
- 4.6. Regulatory Landscape
- 4.7. Current Market Potential and Opportunity Assessment (TAM–SAM–SOM Framework)
- 4.8. MDP Analyst Note
- 4.1. Porters Five Forces
- 5. Market Analysis, Insights and Forecast 2021-2033
- 5.1. Market Analysis, Insights and Forecast - by Application
- 5.1.1. Pharmaceutical
- 5.1.2. Biotechnology
- 5.1.3. Industrial Chemistry
- 5.1.4. Food and Beverage
- 5.1.5. Environmental
- 5.1.6. Others
- 5.2. Market Analysis, Insights and Forecast - by Types
- 5.2.1. UV-Visible Spectrophotometer
- 5.2.2. IR Spectrophotometer
- 5.3. Market Analysis, Insights and Forecast - by Region
- 5.3.1. North America
- 5.3.2. South America
- 5.3.3. Europe
- 5.3.4. Middle East & Africa
- 5.3.5. Asia Pacific
- 5.1. Market Analysis, Insights and Forecast - by Application
- 6. Global Spectrophotometer Analysis, Insights and Forecast, 2021-2033
- 6.1. Market Analysis, Insights and Forecast - by Application
- 6.1.1. Pharmaceutical
- 6.1.2. Biotechnology
- 6.1.3. Industrial Chemistry
- 6.1.4. Food and Beverage
- 6.1.5. Environmental
- 6.1.6. Others
- 6.2. Market Analysis, Insights and Forecast - by Types
- 6.2.1. UV-Visible Spectrophotometer
- 6.2.2. IR Spectrophotometer
- 6.1. Market Analysis, Insights and Forecast - by Application
- 7. North America Spectrophotometer Analysis, Insights and Forecast, 2020-2032
- 7.1. Market Analysis, Insights and Forecast - by Application
- 7.1.1. Pharmaceutical
- 7.1.2. Biotechnology
- 7.1.3. Industrial Chemistry
- 7.1.4. Food and Beverage
- 7.1.5. Environmental
- 7.1.6. Others
- 7.2. Market Analysis, Insights and Forecast - by Types
- 7.2.1. UV-Visible Spectrophotometer
- 7.2.2. IR Spectrophotometer
- 7.1. Market Analysis, Insights and Forecast - by Application
- 8. South America Spectrophotometer Analysis, Insights and Forecast, 2020-2032
- 8.1. Market Analysis, Insights and Forecast - by Application
- 8.1.1. Pharmaceutical
- 8.1.2. Biotechnology
- 8.1.3. Industrial Chemistry
- 8.1.4. Food and Beverage
- 8.1.5. Environmental
- 8.1.6. Others
- 8.2. Market Analysis, Insights and Forecast - by Types
- 8.2.1. UV-Visible Spectrophotometer
- 8.2.2. IR Spectrophotometer
- 8.1. Market Analysis, Insights and Forecast - by Application
- 9. Europe Spectrophotometer Analysis, Insights and Forecast, 2020-2032
- 9.1. Market Analysis, Insights and Forecast - by Application
- 9.1.1. Pharmaceutical
- 9.1.2. Biotechnology
- 9.1.3. Industrial Chemistry
- 9.1.4. Food and Beverage
- 9.1.5. Environmental
- 9.1.6. Others
- 9.2. Market Analysis, Insights and Forecast - by Types
- 9.2.1. UV-Visible Spectrophotometer
- 9.2.2. IR Spectrophotometer
- 9.1. Market Analysis, Insights and Forecast - by Application
- 10. Middle East & Africa Spectrophotometer Analysis, Insights and Forecast, 2020-2032
- 10.1. Market Analysis, Insights and Forecast - by Application
- 10.1.1. Pharmaceutical
- 10.1.2. Biotechnology
- 10.1.3. Industrial Chemistry
- 10.1.4. Food and Beverage
- 10.1.5. Environmental
- 10.1.6. Others
- 10.2. Market Analysis, Insights and Forecast - by Types
- 10.2.1. UV-Visible Spectrophotometer
- 10.2.2. IR Spectrophotometer
- 10.1. Market Analysis, Insights and Forecast - by Application
- 11. Asia Pacific Spectrophotometer Analysis, Insights and Forecast, 2020-2032
- 11.1. Market Analysis, Insights and Forecast - by Application
- 11.1.1. Pharmaceutical
- 11.1.2. Biotechnology
- 11.1.3. Industrial Chemistry
- 11.1.4. Food and Beverage
- 11.1.5. Environmental
- 11.1.6. Others
- 11.2. Market Analysis, Insights and Forecast - by Types
- 11.2.1. UV-Visible Spectrophotometer
- 11.2.2. IR Spectrophotometer
- 11.1. Market Analysis, Insights and Forecast - by Application
- 12. Competitive Analysis
- 12.1. Company Profiles
- 12.1.1 Agilent
- 12.1.1.1. Company Overview
- 12.1.1.2. Products
- 12.1.1.3. Company Financials
- 12.1.1.4. SWOT Analysis
- 12.1.2 Thermo Fisher
- 12.1.2.1. Company Overview
- 12.1.2.2. Products
- 12.1.2.3. Company Financials
- 12.1.2.4. SWOT Analysis
- 12.1.3 Hitachi
- 12.1.3.1. Company Overview
- 12.1.3.2. Products
- 12.1.3.3. Company Financials
- 12.1.3.4. SWOT Analysis
- 12.1.4 Shimadzu
- 12.1.4.1. Company Overview
- 12.1.4.2. Products
- 12.1.4.3. Company Financials
- 12.1.4.4. SWOT Analysis
- 12.1.5 PerkinElmer
- 12.1.5.1. Company Overview
- 12.1.5.2. Products
- 12.1.5.3. Company Financials
- 12.1.5.4. SWOT Analysis
- 12.1.6 Hach
- 12.1.6.1. Company Overview
- 12.1.6.2. Products
- 12.1.6.3. Company Financials
- 12.1.6.4. SWOT Analysis
- 12.1.7 Beckman Coulter
- 12.1.7.1. Company Overview
- 12.1.7.2. Products
- 12.1.7.3. Company Financials
- 12.1.7.4. SWOT Analysis
- 12.1.8 Xylem
- 12.1.8.1. Company Overview
- 12.1.8.2. Products
- 12.1.8.3. Company Financials
- 12.1.8.4. SWOT Analysis
- 12.1.9 VWR
- 12.1.9.1. Company Overview
- 12.1.9.2. Products
- 12.1.9.3. Company Financials
- 12.1.9.4. SWOT Analysis
- 12.1.10 Biochrom
- 12.1.10.1. Company Overview
- 12.1.10.2. Products
- 12.1.10.3. Company Financials
- 12.1.10.4. SWOT Analysis
- 12.1.11 Analytik Jena
- 12.1.11.1. Company Overview
- 12.1.11.2. Products
- 12.1.11.3. Company Financials
- 12.1.11.4. SWOT Analysis
- 12.1.12 JASCO
- 12.1.12.1. Company Overview
- 12.1.12.2. Products
- 12.1.12.3. Company Financials
- 12.1.12.4. SWOT Analysis
- 12.1.13 BioTek
- 12.1.13.1. Company Overview
- 12.1.13.2. Products
- 12.1.13.3. Company Financials
- 12.1.13.4. SWOT Analysis
- 12.1.14 Bibby Scientific
- 12.1.14.1. Company Overview
- 12.1.14.2. Products
- 12.1.14.3. Company Financials
- 12.1.14.4. SWOT Analysis
- 12.1.15 PG Instruments
- 12.1.15.1. Company Overview
- 12.1.15.2. Products
- 12.1.15.3. Company Financials
- 12.1.15.4. SWOT Analysis
- 12.1.16 B&W Tek
- 12.1.16.1. Company Overview
- 12.1.16.2. Products
- 12.1.16.3. Company Financials
- 12.1.16.4. SWOT Analysis
- 12.1.17 INESA
- 12.1.17.1. Company Overview
- 12.1.17.2. Products
- 12.1.17.3. Company Financials
- 12.1.17.4. SWOT Analysis
- 12.1.18 Spectrum
- 12.1.18.1. Company Overview
- 12.1.18.2. Products
- 12.1.18.3. Company Financials
- 12.1.18.4. SWOT Analysis
- 12.1.19 Shanghai Lab-Spectrum Instruments
- 12.1.19.1. Company Overview
- 12.1.19.2. Products
- 12.1.19.3. Company Financials
- 12.1.19.4. SWOT Analysis
- 12.1.1 Agilent
- 12.2. Market Entropy
- 12.2.1 Company's Key Areas Served
- 12.2.2 Recent Developments
- 12.3. Company Market Share Analysis 2025
- 12.3.1 Top 5 Companies Market Share Analysis
- 12.3.2 Top 3 Companies Market Share Analysis
- 12.4. List of Potential Customers
- 13. Research Methodology
List of Figures
- Figure 1: Global Spectrophotometer Revenue Breakdown (million, %) by Region 2025 & 2033
- Figure 2: Global Spectrophotometer Volume Breakdown (K, %) by Region 2025 & 2033
- Figure 3: North America Spectrophotometer Revenue (million), by Application 2025 & 2033
- Figure 4: North America Spectrophotometer Volume (K), by Application 2025 & 2033
- Figure 5: North America Spectrophotometer Revenue Share (%), by Application 2025 & 2033
- Figure 6: North America Spectrophotometer Volume Share (%), by Application 2025 & 2033
- Figure 7: North America Spectrophotometer Revenue (million), by Types 2025 & 2033
- Figure 8: North America Spectrophotometer Volume (K), by Types 2025 & 2033
- Figure 9: North America Spectrophotometer Revenue Share (%), by Types 2025 & 2033
- Figure 10: North America Spectrophotometer Volume Share (%), by Types 2025 & 2033
- Figure 11: North America Spectrophotometer Revenue (million), by Country 2025 & 2033
- Figure 12: North America Spectrophotometer Volume (K), by Country 2025 & 2033
- Figure 13: North America Spectrophotometer Revenue Share (%), by Country 2025 & 2033
- Figure 14: North America Spectrophotometer Volume Share (%), by Country 2025 & 2033
- Figure 15: South America Spectrophotometer Revenue (million), by Application 2025 & 2033
- Figure 16: South America Spectrophotometer Volume (K), by Application 2025 & 2033
- Figure 17: South America Spectrophotometer Revenue Share (%), by Application 2025 & 2033
- Figure 18: South America Spectrophotometer Volume Share (%), by Application 2025 & 2033
- Figure 19: South America Spectrophotometer Revenue (million), by Types 2025 & 2033
- Figure 20: South America Spectrophotometer Volume (K), by Types 2025 & 2033
- Figure 21: South America Spectrophotometer Revenue Share (%), by Types 2025 & 2033
- Figure 22: South America Spectrophotometer Volume Share (%), by Types 2025 & 2033
- Figure 23: South America Spectrophotometer Revenue (million), by Country 2025 & 2033
- Figure 24: South America Spectrophotometer Volume (K), by Country 2025 & 2033
- Figure 25: South America Spectrophotometer Revenue Share (%), by Country 2025 & 2033
- Figure 26: South America Spectrophotometer Volume Share (%), by Country 2025 & 2033
- Figure 27: Europe Spectrophotometer Revenue (million), by Application 2025 & 2033
- Figure 28: Europe Spectrophotometer Volume (K), by Application 2025 & 2033
- Figure 29: Europe Spectrophotometer Revenue Share (%), by Application 2025 & 2033
- Figure 30: Europe Spectrophotometer Volume Share (%), by Application 2025 & 2033
- Figure 31: Europe Spectrophotometer Revenue (million), by Types 2025 & 2033
- Figure 32: Europe Spectrophotometer Volume (K), by Types 2025 & 2033
- Figure 33: Europe Spectrophotometer Revenue Share (%), by Types 2025 & 2033
- Figure 34: Europe Spectrophotometer Volume Share (%), by Types 2025 & 2033
- Figure 35: Europe Spectrophotometer Revenue (million), by Country 2025 & 2033
- Figure 36: Europe Spectrophotometer Volume (K), by Country 2025 & 2033
- Figure 37: Europe Spectrophotometer Revenue Share (%), by Country 2025 & 2033
- Figure 38: Europe Spectrophotometer Volume Share (%), by Country 2025 & 2033
- Figure 39: Middle East & Africa Spectrophotometer Revenue (million), by Application 2025 & 2033
- Figure 40: Middle East & Africa Spectrophotometer Volume (K), by Application 2025 & 2033
- Figure 41: Middle East & Africa Spectrophotometer Revenue Share (%), by Application 2025 & 2033
- Figure 42: Middle East & Africa Spectrophotometer Volume Share (%), by Application 2025 & 2033
- Figure 43: Middle East & Africa Spectrophotometer Revenue (million), by Types 2025 & 2033
- Figure 44: Middle East & Africa Spectrophotometer Volume (K), by Types 2025 & 2033
- Figure 45: Middle East & Africa Spectrophotometer Revenue Share (%), by Types 2025 & 2033
- Figure 46: Middle East & Africa Spectrophotometer Volume Share (%), by Types 2025 & 2033
- Figure 47: Middle East & Africa Spectrophotometer Revenue (million), by Country 2025 & 2033
- Figure 48: Middle East & Africa Spectrophotometer Volume (K), by Country 2025 & 2033
- Figure 49: Middle East & Africa Spectrophotometer Revenue Share (%), by Country 2025 & 2033
- Figure 50: Middle East & Africa Spectrophotometer Volume Share (%), by Country 2025 & 2033
- Figure 51: Asia Pacific Spectrophotometer Revenue (million), by Application 2025 & 2033
- Figure 52: Asia Pacific Spectrophotometer Volume (K), by Application 2025 & 2033
- Figure 53: Asia Pacific Spectrophotometer Revenue Share (%), by Application 2025 & 2033
- Figure 54: Asia Pacific Spectrophotometer Volume Share (%), by Application 2025 & 2033
- Figure 55: Asia Pacific Spectrophotometer Revenue (million), by Types 2025 & 2033
- Figure 56: Asia Pacific Spectrophotometer Volume (K), by Types 2025 & 2033
- Figure 57: Asia Pacific Spectrophotometer Revenue Share (%), by Types 2025 & 2033
- Figure 58: Asia Pacific Spectrophotometer Volume Share (%), by Types 2025 & 2033
- Figure 59: Asia Pacific Spectrophotometer Revenue (million), by Country 2025 & 2033
- Figure 60: Asia Pacific Spectrophotometer Volume (K), by Country 2025 & 2033
- Figure 61: Asia Pacific Spectrophotometer Revenue Share (%), by Country 2025 & 2033
- Figure 62: Asia Pacific Spectrophotometer Volume Share (%), by Country 2025 & 2033
List of Tables
- Table 1: Global Spectrophotometer Revenue million Forecast, by Application 2020 & 2033
- Table 2: Global Spectrophotometer Volume K Forecast, by Application 2020 & 2033
- Table 3: Global Spectrophotometer Revenue million Forecast, by Types 2020 & 2033
- Table 4: Global Spectrophotometer Volume K Forecast, by Types 2020 & 2033
- Table 5: Global Spectrophotometer Revenue million Forecast, by Region 2020 & 2033
- Table 6: Global Spectrophotometer Volume K Forecast, by Region 2020 & 2033
- Table 7: Global Spectrophotometer Revenue million Forecast, by Application 2020 & 2033
- Table 8: Global Spectrophotometer Volume K Forecast, by Application 2020 & 2033
- Table 9: Global Spectrophotometer Revenue million Forecast, by Types 2020 & 2033
- Table 10: Global Spectrophotometer Volume K Forecast, by Types 2020 & 2033
- Table 11: Global Spectrophotometer Revenue million Forecast, by Country 2020 & 2033
- Table 12: Global Spectrophotometer Volume K Forecast, by Country 2020 & 2033
- Table 13: United States Spectrophotometer Revenue (million) Forecast, by Application 2020 & 2033
- Table 14: United States Spectrophotometer Volume (K) Forecast, by Application 2020 & 2033
- Table 15: Canada Spectrophotometer Revenue (million) Forecast, by Application 2020 & 2033
- Table 16: Canada Spectrophotometer Volume (K) Forecast, by Application 2020 & 2033
- Table 17: Mexico Spectrophotometer Revenue (million) Forecast, by Application 2020 & 2033
- Table 18: Mexico Spectrophotometer Volume (K) Forecast, by Application 2020 & 2033
- Table 19: Global Spectrophotometer Revenue million Forecast, by Application 2020 & 2033
- Table 20: Global Spectrophotometer Volume K Forecast, by Application 2020 & 2033
- Table 21: Global Spectrophotometer Revenue million Forecast, by Types 2020 & 2033
- Table 22: Global Spectrophotometer Volume K Forecast, by Types 2020 & 2033
- Table 23: Global Spectrophotometer Revenue million Forecast, by Country 2020 & 2033
- Table 24: Global Spectrophotometer Volume K Forecast, by Country 2020 & 2033
- Table 25: Brazil Spectrophotometer Revenue (million) Forecast, by Application 2020 & 2033
- Table 26: Brazil Spectrophotometer Volume (K) Forecast, by Application 2020 & 2033
- Table 27: Argentina Spectrophotometer Revenue (million) Forecast, by Application 2020 & 2033
- Table 28: Argentina Spectrophotometer Volume (K) Forecast, by Application 2020 & 2033
- Table 29: Rest of South America Spectrophotometer Revenue (million) Forecast, by Application 2020 & 2033
- Table 30: Rest of South America Spectrophotometer Volume (K) Forecast, by Application 2020 & 2033
- Table 31: Global Spectrophotometer Revenue million Forecast, by Application 2020 & 2033
- Table 32: Global Spectrophotometer Volume K Forecast, by Application 2020 & 2033
- Table 33: Global Spectrophotometer Revenue million Forecast, by Types 2020 & 2033
- Table 34: Global Spectrophotometer Volume K Forecast, by Types 2020 & 2033
- Table 35: Global Spectrophotometer Revenue million Forecast, by Country 2020 & 2033
- Table 36: Global Spectrophotometer Volume K Forecast, by Country 2020 & 2033
- Table 37: United Kingdom Spectrophotometer Revenue (million) Forecast, by Application 2020 & 2033
- Table 38: United Kingdom Spectrophotometer Volume (K) Forecast, by Application 2020 & 2033
- Table 39: Germany Spectrophotometer Revenue (million) Forecast, by Application 2020 & 2033
- Table 40: Germany Spectrophotometer Volume (K) Forecast, by Application 2020 & 2033
- Table 41: France Spectrophotometer Revenue (million) Forecast, by Application 2020 & 2033
- Table 42: France Spectrophotometer Volume (K) Forecast, by Application 2020 & 2033
- Table 43: Italy Spectrophotometer Revenue (million) Forecast, by Application 2020 & 2033
- Table 44: Italy Spectrophotometer Volume (K) Forecast, by Application 2020 & 2033
- Table 45: Spain Spectrophotometer Revenue (million) Forecast, by Application 2020 & 2033
- Table 46: Spain Spectrophotometer Volume (K) Forecast, by Application 2020 & 2033
- Table 47: Russia Spectrophotometer Revenue (million) Forecast, by Application 2020 & 2033
- Table 48: Russia Spectrophotometer Volume (K) Forecast, by Application 2020 & 2033
- Table 49: Benelux Spectrophotometer Revenue (million) Forecast, by Application 2020 & 2033
- Table 50: Benelux Spectrophotometer Volume (K) Forecast, by Application 2020 & 2033
- Table 51: Nordics Spectrophotometer Revenue (million) Forecast, by Application 2020 & 2033
- Table 52: Nordics Spectrophotometer Volume (K) Forecast, by Application 2020 & 2033
- Table 53: Rest of Europe Spectrophotometer Revenue (million) Forecast, by Application 2020 & 2033
- Table 54: Rest of Europe Spectrophotometer Volume (K) Forecast, by Application 2020 & 2033
- Table 55: Global Spectrophotometer Revenue million Forecast, by Application 2020 & 2033
- Table 56: Global Spectrophotometer Volume K Forecast, by Application 2020 & 2033
- Table 57: Global Spectrophotometer Revenue million Forecast, by Types 2020 & 2033
- Table 58: Global Spectrophotometer Volume K Forecast, by Types 2020 & 2033
- Table 59: Global Spectrophotometer Revenue million Forecast, by Country 2020 & 2033
- Table 60: Global Spectrophotometer Volume K Forecast, by Country 2020 & 2033
- Table 61: Turkey Spectrophotometer Revenue (million) Forecast, by Application 2020 & 2033
- Table 62: Turkey Spectrophotometer Volume (K) Forecast, by Application 2020 & 2033
- Table 63: Israel Spectrophotometer Revenue (million) Forecast, by Application 2020 & 2033
- Table 64: Israel Spectrophotometer Volume (K) Forecast, by Application 2020 & 2033
- Table 65: GCC Spectrophotometer Revenue (million) Forecast, by Application 2020 & 2033
- Table 66: GCC Spectrophotometer Volume (K) Forecast, by Application 2020 & 2033
- Table 67: North Africa Spectrophotometer Revenue (million) Forecast, by Application 2020 & 2033
- Table 68: North Africa Spectrophotometer Volume (K) Forecast, by Application 2020 & 2033
- Table 69: South Africa Spectrophotometer Revenue (million) Forecast, by Application 2020 & 2033
- Table 70: South Africa Spectrophotometer Volume (K) Forecast, by Application 2020 & 2033
- Table 71: Rest of Middle East & Africa Spectrophotometer Revenue (million) Forecast, by Application 2020 & 2033
- Table 72: Rest of Middle East & Africa Spectrophotometer Volume (K) Forecast, by Application 2020 & 2033
- Table 73: Global Spectrophotometer Revenue million Forecast, by Application 2020 & 2033
- Table 74: Global Spectrophotometer Volume K Forecast, by Application 2020 & 2033
- Table 75: Global Spectrophotometer Revenue million Forecast, by Types 2020 & 2033
- Table 76: Global Spectrophotometer Volume K Forecast, by Types 2020 & 2033
- Table 77: Global Spectrophotometer Revenue million Forecast, by Country 2020 & 2033
- Table 78: Global Spectrophotometer Volume K Forecast, by Country 2020 & 2033
- Table 79: China Spectrophotometer Revenue (million) Forecast, by Application 2020 & 2033
- Table 80: China Spectrophotometer Volume (K) Forecast, by Application 2020 & 2033
- Table 81: India Spectrophotometer Revenue (million) Forecast, by Application 2020 & 2033
- Table 82: India Spectrophotometer Volume (K) Forecast, by Application 2020 & 2033
- Table 83: Japan Spectrophotometer Revenue (million) Forecast, by Application 2020 & 2033
- Table 84: Japan Spectrophotometer Volume (K) Forecast, by Application 2020 & 2033
- Table 85: South Korea Spectrophotometer Revenue (million) Forecast, by Application 2020 & 2033
- Table 86: South Korea Spectrophotometer Volume (K) Forecast, by Application 2020 & 2033
- Table 87: ASEAN Spectrophotometer Revenue (million) Forecast, by Application 2020 & 2033
- Table 88: ASEAN Spectrophotometer Volume (K) Forecast, by Application 2020 & 2033
- Table 89: Oceania Spectrophotometer Revenue (million) Forecast, by Application 2020 & 2033
- Table 90: Oceania Spectrophotometer Volume (K) Forecast, by Application 2020 & 2033
- Table 91: Rest of Asia Pacific Spectrophotometer Revenue (million) Forecast, by Application 2020 & 2033
- Table 92: Rest of Asia Pacific Spectrophotometer Volume (K) Forecast, by Application 2020 & 2033
Frequently Asked Questions
1. What is the projected Compound Annual Growth Rate (CAGR) of the Spectrophotometer?
The projected CAGR is approximately 3%.
2. Which companies are prominent players in the Spectrophotometer?
Key companies in the market include Agilent, Thermo Fisher, Hitachi, Shimadzu, PerkinElmer, Hach, Beckman Coulter, Xylem, VWR, Biochrom, Analytik Jena, JASCO, BioTek, Bibby Scientific, PG Instruments, B&W Tek, INESA, Spectrum, Shanghai Lab-Spectrum Instruments.
3. What are the main segments of the Spectrophotometer?
The market segments include Application, Types.
4. Can you provide details about the market size?
The market size is estimated to be USD 2482.3 million as of 2022.
5. What are some drivers contributing to market growth?
N/A
6. What are the notable trends driving market growth?
N/A
7. Are there any restraints impacting market growth?
N/A
8. Can you provide examples of recent developments in the market?
N/A
9. What pricing options are available for accessing the report?
Pricing options include single-user, multi-user, and enterprise licenses priced at USD 3950.00, USD 5925.00, and USD 7900.00 respectively.
10. Is the market size provided in terms of value or volume?
The market size is provided in terms of value, measured in million and volume, measured in K.
11. Are there any specific market keywords associated with the report?
Yes, the market keyword associated with the report is "Spectrophotometer," which aids in identifying and referencing the specific market segment covered.
12. How do I determine which pricing option suits my needs best?
The pricing options vary based on user requirements and access needs. Individual users may opt for single-user licenses, while businesses requiring broader access may choose multi-user or enterprise licenses for cost-effective access to the report.
13. Are there any additional resources or data provided in the Spectrophotometer report?
While the report offers comprehensive insights, it's advisable to review the specific contents or supplementary materials provided to ascertain if additional resources or data are available.
14. How can I stay updated on further developments or reports in the Spectrophotometer?
To stay informed about further developments, trends, and reports in the Spectrophotometer, consider subscribing to industry newsletters, following relevant companies and organizations, or regularly checking reputable industry news sources and publications.
Methodology
Step 1 - Identification of Relevant Samples Size from Population Database


Step 2 - Approaches for Defining Global Market Size (Value, Volume* & Price*)

Note*: In applicable scenarios
Step 3 - Data Sources
Primary Research
- Web Analytics
- Survey Reports
- Research Institute
- Latest Research Reports
- Opinion Leaders
Secondary Research
- Annual Reports
- White Paper
- Latest Press Release
- Industry Association
- Paid Database
- Investor Presentations

Step 4 - Data Triangulation
Involves using different sources of information in order to increase the validity of a study
These sources are likely to be stakeholders in a program - participants, other researchers, program staff, other community members, and so on.
Then we put all data in single framework & apply various statistical tools to find out the dynamic on the market.
During the analysis stage, feedback from the stakeholder groups would be compared to determine areas of agreement as well as areas of divergence