

Key Insights
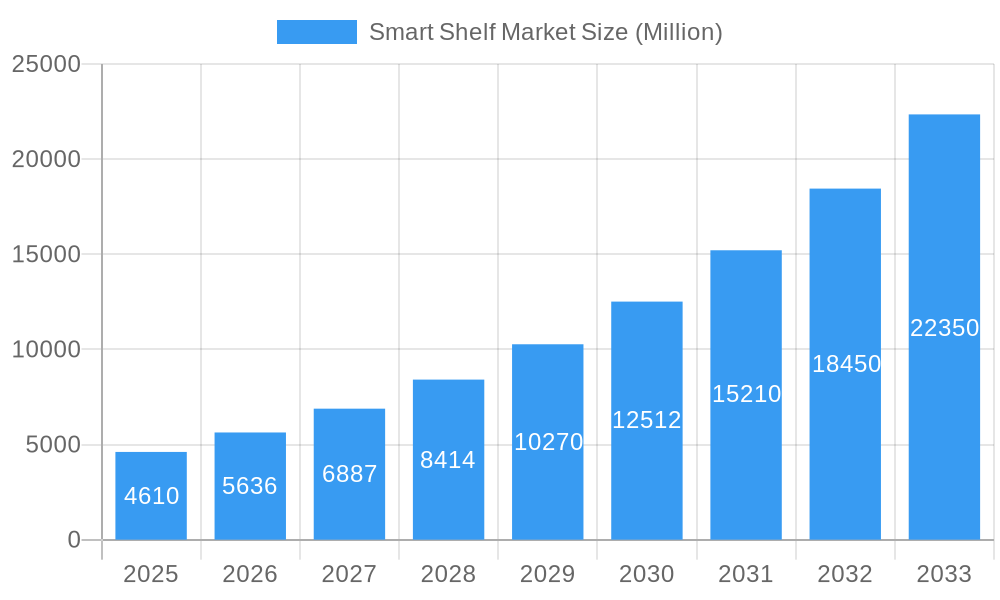
The smart shelf market is experiencing robust growth, projected to reach a market size of $4.61 billion in 2025 and exhibiting a Compound Annual Growth Rate (CAGR) of 22.26% from 2025 to 2033. This expansion is driven by several key factors. The increasing adoption of digital technologies across retail and supply chain management is a major catalyst. Retailers are leveraging smart shelf technology to optimize inventory management, pricing strategies, and shelf planograms, leading to improved efficiency and reduced waste. The integration of sensors, cameras, and advanced analytics provides real-time data on product availability, consumer behavior, and sales trends, allowing businesses to make informed decisions and enhance the overall customer experience. Furthermore, the growing need for enhanced supply chain visibility and predictive analytics is fueling market growth. The integration of smart shelves into existing infrastructure is relatively straightforward for many businesses, reducing implementation barriers and accelerating adoption rates. The rising demand for improved supply chain management across various industries, including grocery, pharmaceuticals, and electronics, is further contributing to the expansion of this market.
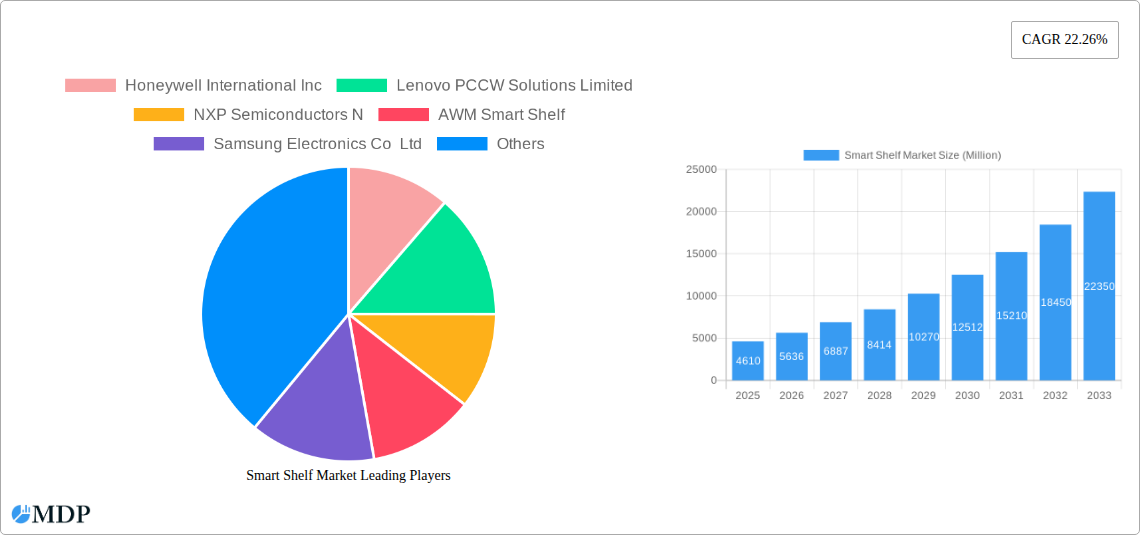
Smart Shelf Market Market Size (In Billion)
Significant regional variations exist within the global smart shelf market. North America currently holds a substantial market share due to the early adoption of advanced technologies and the presence of major technology companies. However, the Asia-Pacific region is poised for significant growth in the coming years, driven by expanding e-commerce markets and rising disposable incomes. Europe is also witnessing substantial growth, particularly in countries with well-established retail infrastructures. The competitive landscape is characterized by a mix of established technology giants like Honeywell and Samsung, alongside innovative startups and specialized solution providers. Future market growth will depend on the continued development of innovative features, such as improved sensor technology, enhanced analytics capabilities, and seamless integration with existing retail management systems. Moreover, factors such as the increasing cost of implementation and the need for robust data security protocols will influence the market's trajectory.
Smart Shelf Market Company Market Share
Smart Shelf Market Report: 2019-2033 Forecast
This comprehensive report provides a detailed analysis of the Smart Shelf Market, offering invaluable insights for industry stakeholders, investors, and strategic decision-makers. Covering the period from 2019 to 2033, with a base year of 2025 and a forecast period from 2025 to 2033, this report illuminates market dynamics, key trends, leading players, and future opportunities within this rapidly evolving sector. The global Smart Shelf Market is projected to reach xx Million by 2033, exhibiting a significant CAGR of xx% during the forecast period.
Smart Shelf Market Market Dynamics & Concentration
The Smart Shelf Market is characterized by a moderately concentrated landscape, with several key players vying for market share. Market concentration is influenced by factors such as technological advancements, regulatory compliance, and the increasing adoption of smart shelf solutions across various industries. The market share of the top five players accounts for approximately xx%, indicating a competitive yet consolidating landscape. Innovation is a key driver, with continuous advancements in sensor technology, AI-powered analytics, and cloud connectivity enhancing the capabilities and efficiency of smart shelves. Regulatory frameworks related to data privacy and security are shaping market practices. Product substitutes, such as traditional shelf systems and manual inventory management, are gradually being replaced as the advantages of smart shelves become more apparent. End-user trends point toward a growing preference for data-driven decision-making and streamlined operations, fueling demand for these solutions. Mergers and acquisitions (M&A) have played a role in market consolidation. Over the past five years, there have been approximately xx M&A deals in the smart shelf market, primarily focused on expanding technological capabilities and market reach.
- Market Share: Top 5 players: xx%
- M&A Activity (2019-2024): Approximately xx deals.
- Key Drivers: Technological innovation, regulatory changes, end-user demand for efficiency.
- Challenges: High initial investment, data security concerns, and competition from established players.
Smart Shelf Market Industry Trends & Analysis
The Smart Shelf Market is experiencing robust growth, driven by several factors. The increasing adoption of IoT technologies in retail and other sectors is a major catalyst, enabling real-time data collection and analysis. Technological disruptions, such as the integration of AI and machine learning, are enhancing the capabilities of smart shelves, leading to improved accuracy in inventory management, optimized pricing strategies, and personalized customer experiences. Consumer preferences are shifting toward seamless shopping experiences and personalized offers, further boosting demand for smart shelf solutions. The competitive dynamics are characterized by both established players and innovative startups, fostering innovation and driving down costs. The market penetration rate of smart shelves in the retail sector is estimated at xx% in 2025, with projections for substantial growth in the coming years. This growth is expected to be fueled by the increasing demand for efficient inventory management, reduced labor costs, and enhanced customer engagement. The market is witnessing a significant increase in the adoption of electronic shelf labels (ESLs) for dynamic pricing and promotional updates.
Leading Markets & Segments in Smart Shelf Market
North America currently holds the largest market share in the Smart Shelf Market, driven by strong technological advancements and a high adoption rate among retailers. Within the segments, Hardware accounts for the largest revenue share, followed by Software and Services. The Inventory Management application segment dominates the application-based market due to the critical need for real-time inventory tracking and efficient stock management.
Key Drivers for North American Dominance:
- Advanced Technological Infrastructure: Robust technological infrastructure facilitates the deployment and integration of smart shelf systems.
- High Retail Sector Adoption: The mature retail landscape demonstrates a significant adoption of smart technology.
- Favorable Regulatory Environment: A supportive regulatory environment encourages innovation and adoption.
Segment Analysis:
- By Component: Hardware (xx Million), Software (xx Million), Service (xx Million)
- By Application: Inventory Management (xx Million), Pricing Management (xx Million), Content Management (xx Million), Planogram Management (xx Million), Other Applications (xx Million)
Smart Shelf Market Product Developments
Recent product innovations focus on enhancing functionalities through AI-powered analytics, improved sensor integration for increased accuracy, and the development of more user-friendly interfaces. Smart shelves are increasingly integrated with other IoT devices to create a holistic ecosystem for data collection and analysis, offering retailers comprehensive insights into consumer behavior and supply chain efficiency. The integration of ESLs with dynamic pricing capabilities, coupled with seamless connectivity to cloud platforms, is transforming retail operations and driving the adoption of smart shelf technology. These developments offer significant competitive advantages to businesses seeking to optimize inventory, enhance operational efficiency and personalize customer experiences.
Key Drivers of Smart Shelf Market Growth
Several factors are driving the growth of the Smart Shelf Market. Technological advancements, such as AI-powered analytics and improved sensor technology, are enhancing the capabilities of smart shelves and increasing their appeal. Economic factors, such as the rising need for operational efficiency and cost reduction, are prompting businesses to adopt these solutions. Favorable regulatory environments in certain regions are supporting market growth by reducing barriers to adoption and fostering innovation. For example, government initiatives promoting digital transformation in the retail sector are driving wider adoption.
Challenges in the Smart Shelf Market Market
The Smart Shelf Market faces challenges such as high initial investment costs, concerns about data security and privacy, and potential integration complexities with existing systems. Supply chain disruptions can also affect the availability and cost of components. Intense competition from established players and emerging startups is also a factor, requiring continuous innovation and differentiation to maintain a competitive edge. These challenges can impact market growth if not effectively addressed.
Emerging Opportunities in Smart Shelf Market
The Smart Shelf Market presents numerous opportunities for growth. Technological breakthroughs, such as the development of more energy-efficient sensors and advanced analytics capabilities, will drive further adoption. Strategic partnerships between technology providers and retailers will create innovative solutions, extending the functionality of smart shelves and expanding market reach. The expansion of smart shelf applications into new sectors, such as healthcare and logistics, presents significant growth potential.
Leading Players in the Smart Shelf Market Sector
- Honeywell International Inc
- Lenovo PCCW Solutions Limited
- NXP Semiconductors N.V.
- AWM Smart Shelf
- Samsung Electronics Co Ltd
- Happiest Minds Technologies Limited
- Trax Technology Solutions
- Avery Dennison Corporation
- Huawei Technologies Co Ltd
- E Ink Holdings Inc
- Intel Corporation
Key Milestones in Smart Shelf Market Industry
- January 2024: Vestcom, a subsidiary of Avery Dennison, launched storeLink, a centralized cloud platform for in-store merchandising. This significantly enhances retailers' abilities to manage pricing and promotions across digital and print media.
- April 2024: E Ink collaborated with Realtek Semiconductor, Integrated Solutions Technology, and Chipbond Technology to develop System on Panel (SoP) architecture for next-generation electronic shelf labels (ESLs). This innovation aims to simplify ESL production, reduce material usage, and lower power consumption, promoting sustainability.
Strategic Outlook for Smart Shelf Market Market
The Smart Shelf Market is poised for significant growth, fueled by technological innovation, expanding applications, and increasing demand for efficient retail operations. Strategic partnerships, focusing on integrating smart shelves with other IoT devices and leveraging AI-powered analytics, will play a crucial role in shaping the market's future. The potential for market expansion into new sectors, coupled with ongoing advancements in sensor technology and data analytics, positions this market for sustained growth and innovation in the years to come.
Smart Shelf Market Segmentation
-
1. Component
-
1.1. Hardware
- 1.1.1. IoT Sensors
- 1.1.2. RFID Tags and Readers
- 1.1.3. Electronic Shelf Lables (ESL)
- 1.1.4. Cameras
- 1.2. Software
- 1.3. Service
-
1.1. Hardware
-
2. Application
- 2.1. Inventory Management
- 2.2. Pricing Management
- 2.3. Content Management
- 2.4. Planogram Management
- 2.5. Other Applications
Smart Shelf Market Segmentation By Geography
-
1. North America
- 1.1. United States
- 1.2. Canada
-
2. Europe
- 2.1. United Kingdom
- 2.2. Germany
- 2.3. Italy
- 2.4. France
-
3. Asia
- 3.1. China
- 3.2. India
- 3.3. Japan
- 3.4. South Korea
- 4. Australia and New Zealand
-
5. Latin America
- 5.1. Brazil
- 5.2. Mexico
- 6. Middle East and Africa
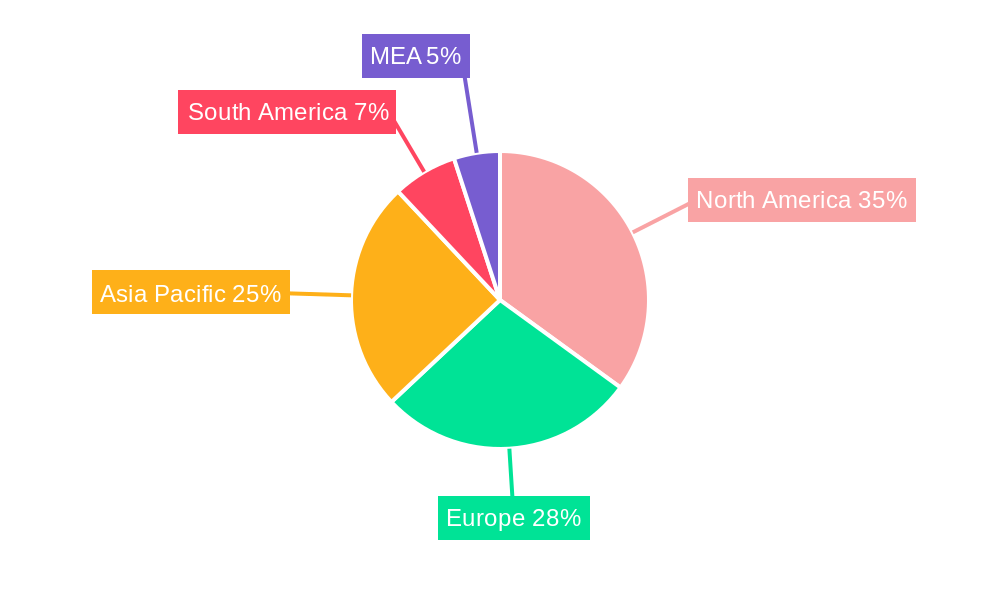
Smart Shelf Market Regional Market Share
Geographic Coverage of Smart Shelf Market
Smart Shelf Market REPORT HIGHLIGHTS
| Aspects | Details |
|---|---|
| Study Period | 2020-2034 |
| Base Year | 2025 |
| Estimated Year | 2026 |
| Forecast Period | 2026-2034 |
| Historical Period | 2020-2025 |
| Growth Rate | CAGR of 22.26% from 2020-2034 |
| Segmentation |
|
Table of Contents
- 1. Introduction
- 1.1. Research Scope
- 1.2. Market Segmentation
- 1.3. Research Methodology
- 1.4. Definitions and Assumptions
- 2. Executive Summary
- 2.1. Introduction
- 3. Market Dynamics
- 3.1. Introduction
- 3.2. Market Drivers
- 3.2.1. Adoption of Enhanced Inventory Management; Growing Demand for Real-Time Stock Information and Inventory Management in the Retail Sector
- 3.3. Market Restrains
- 3.3.1. High Designing and Development Cost
- 3.4. Market Trends
- 3.4.1. Adoption of Enhanced Inventory Management is Expected to Drive the Market
- 4. Market Factor Analysis
- 4.1. Porters Five Forces
- 4.2. Supply/Value Chain
- 4.3. PESTEL analysis
- 4.4. Market Entropy
- 4.5. Patent/Trademark Analysis
- 5. Global Smart Shelf Market Analysis, Insights and Forecast, 2020-2032
- 5.1. Market Analysis, Insights and Forecast - by Component
- 5.1.1. Hardware
- 5.1.1.1. IoT Sensors
- 5.1.1.2. RFID Tags and Readers
- 5.1.1.3. Electronic Shelf Lables (ESL)
- 5.1.1.4. Cameras
- 5.1.2. Software
- 5.1.3. Service
- 5.1.1. Hardware
- 5.2. Market Analysis, Insights and Forecast - by Application
- 5.2.1. Inventory Management
- 5.2.2. Pricing Management
- 5.2.3. Content Management
- 5.2.4. Planogram Management
- 5.2.5. Other Applications
- 5.3. Market Analysis, Insights and Forecast - by Region
- 5.3.1. North America
- 5.3.2. Europe
- 5.3.3. Asia
- 5.3.4. Australia and New Zealand
- 5.3.5. Latin America
- 5.3.6. Middle East and Africa
- 5.1. Market Analysis, Insights and Forecast - by Component
- 6. North America Smart Shelf Market Analysis, Insights and Forecast, 2020-2032
- 6.1. Market Analysis, Insights and Forecast - by Component
- 6.1.1. Hardware
- 6.1.1.1. IoT Sensors
- 6.1.1.2. RFID Tags and Readers
- 6.1.1.3. Electronic Shelf Lables (ESL)
- 6.1.1.4. Cameras
- 6.1.2. Software
- 6.1.3. Service
- 6.1.1. Hardware
- 6.2. Market Analysis, Insights and Forecast - by Application
- 6.2.1. Inventory Management
- 6.2.2. Pricing Management
- 6.2.3. Content Management
- 6.2.4. Planogram Management
- 6.2.5. Other Applications
- 6.1. Market Analysis, Insights and Forecast - by Component
- 7. Europe Smart Shelf Market Analysis, Insights and Forecast, 2020-2032
- 7.1. Market Analysis, Insights and Forecast - by Component
- 7.1.1. Hardware
- 7.1.1.1. IoT Sensors
- 7.1.1.2. RFID Tags and Readers
- 7.1.1.3. Electronic Shelf Lables (ESL)
- 7.1.1.4. Cameras
- 7.1.2. Software
- 7.1.3. Service
- 7.1.1. Hardware
- 7.2. Market Analysis, Insights and Forecast - by Application
- 7.2.1. Inventory Management
- 7.2.2. Pricing Management
- 7.2.3. Content Management
- 7.2.4. Planogram Management
- 7.2.5. Other Applications
- 7.1. Market Analysis, Insights and Forecast - by Component
- 8. Asia Smart Shelf Market Analysis, Insights and Forecast, 2020-2032
- 8.1. Market Analysis, Insights and Forecast - by Component
- 8.1.1. Hardware
- 8.1.1.1. IoT Sensors
- 8.1.1.2. RFID Tags and Readers
- 8.1.1.3. Electronic Shelf Lables (ESL)
- 8.1.1.4. Cameras
- 8.1.2. Software
- 8.1.3. Service
- 8.1.1. Hardware
- 8.2. Market Analysis, Insights and Forecast - by Application
- 8.2.1. Inventory Management
- 8.2.2. Pricing Management
- 8.2.3. Content Management
- 8.2.4. Planogram Management
- 8.2.5. Other Applications
- 8.1. Market Analysis, Insights and Forecast - by Component
- 9. Australia and New Zealand Smart Shelf Market Analysis, Insights and Forecast, 2020-2032
- 9.1. Market Analysis, Insights and Forecast - by Component
- 9.1.1. Hardware
- 9.1.1.1. IoT Sensors
- 9.1.1.2. RFID Tags and Readers
- 9.1.1.3. Electronic Shelf Lables (ESL)
- 9.1.1.4. Cameras
- 9.1.2. Software
- 9.1.3. Service
- 9.1.1. Hardware
- 9.2. Market Analysis, Insights and Forecast - by Application
- 9.2.1. Inventory Management
- 9.2.2. Pricing Management
- 9.2.3. Content Management
- 9.2.4. Planogram Management
- 9.2.5. Other Applications
- 9.1. Market Analysis, Insights and Forecast - by Component
- 10. Latin America Smart Shelf Market Analysis, Insights and Forecast, 2020-2032
- 10.1. Market Analysis, Insights and Forecast - by Component
- 10.1.1. Hardware
- 10.1.1.1. IoT Sensors
- 10.1.1.2. RFID Tags and Readers
- 10.1.1.3. Electronic Shelf Lables (ESL)
- 10.1.1.4. Cameras
- 10.1.2. Software
- 10.1.3. Service
- 10.1.1. Hardware
- 10.2. Market Analysis, Insights and Forecast - by Application
- 10.2.1. Inventory Management
- 10.2.2. Pricing Management
- 10.2.3. Content Management
- 10.2.4. Planogram Management
- 10.2.5. Other Applications
- 10.1. Market Analysis, Insights and Forecast - by Component
- 11. Middle East and Africa Smart Shelf Market Analysis, Insights and Forecast, 2020-2032
- 11.1. Market Analysis, Insights and Forecast - by Component
- 11.1.1. Hardware
- 11.1.1.1. IoT Sensors
- 11.1.1.2. RFID Tags and Readers
- 11.1.1.3. Electronic Shelf Lables (ESL)
- 11.1.1.4. Cameras
- 11.1.2. Software
- 11.1.3. Service
- 11.1.1. Hardware
- 11.2. Market Analysis, Insights and Forecast - by Application
- 11.2.1. Inventory Management
- 11.2.2. Pricing Management
- 11.2.3. Content Management
- 11.2.4. Planogram Management
- 11.2.5. Other Applications
- 11.1. Market Analysis, Insights and Forecast - by Component
- 12. Competitive Analysis
- 12.1. Global Market Share Analysis 2025
- 12.2. Company Profiles
- 12.2.1 Honeywell International Inc
- 12.2.1.1. Overview
- 12.2.1.2. Products
- 12.2.1.3. SWOT Analysis
- 12.2.1.4. Recent Developments
- 12.2.1.5. Financials (Based on Availability)
- 12.2.2 Lenovo PCCW Solutions Limited
- 12.2.2.1. Overview
- 12.2.2.2. Products
- 12.2.2.3. SWOT Analysis
- 12.2.2.4. Recent Developments
- 12.2.2.5. Financials (Based on Availability)
- 12.2.3 NXP Semiconductors N
- 12.2.3.1. Overview
- 12.2.3.2. Products
- 12.2.3.3. SWOT Analysis
- 12.2.3.4. Recent Developments
- 12.2.3.5. Financials (Based on Availability)
- 12.2.4 AWM Smart Shelf
- 12.2.4.1. Overview
- 12.2.4.2. Products
- 12.2.4.3. SWOT Analysis
- 12.2.4.4. Recent Developments
- 12.2.4.5. Financials (Based on Availability)
- 12.2.5 Samsung Electronics Co Ltd
- 12.2.5.1. Overview
- 12.2.5.2. Products
- 12.2.5.3. SWOT Analysis
- 12.2.5.4. Recent Developments
- 12.2.5.5. Financials (Based on Availability)
- 12.2.6 Happiest Minds Technologies Limited
- 12.2.6.1. Overview
- 12.2.6.2. Products
- 12.2.6.3. SWOT Analysis
- 12.2.6.4. Recent Developments
- 12.2.6.5. Financials (Based on Availability)
- 12.2.7 Trax Technology Solutions
- 12.2.7.1. Overview
- 12.2.7.2. Products
- 12.2.7.3. SWOT Analysis
- 12.2.7.4. Recent Developments
- 12.2.7.5. Financials (Based on Availability)
- 12.2.8 Avery Dennison Corporation
- 12.2.8.1. Overview
- 12.2.8.2. Products
- 12.2.8.3. SWOT Analysis
- 12.2.8.4. Recent Developments
- 12.2.8.5. Financials (Based on Availability)
- 12.2.9 Huawei Technologies Co Ltd
- 12.2.9.1. Overview
- 12.2.9.2. Products
- 12.2.9.3. SWOT Analysis
- 12.2.9.4. Recent Developments
- 12.2.9.5. Financials (Based on Availability)
- 12.2.10 E Ink Holdings Inc
- 12.2.10.1. Overview
- 12.2.10.2. Products
- 12.2.10.3. SWOT Analysis
- 12.2.10.4. Recent Developments
- 12.2.10.5. Financials (Based on Availability)
- 12.2.11 Intel Corporation
- 12.2.11.1. Overview
- 12.2.11.2. Products
- 12.2.11.3. SWOT Analysis
- 12.2.11.4. Recent Developments
- 12.2.11.5. Financials (Based on Availability)
- 12.2.1 Honeywell International Inc
List of Figures
- Figure 1: Global Smart Shelf Market Revenue Breakdown (Million, %) by Region 2025 & 2033
- Figure 2: North America Smart Shelf Market Revenue (Million), by Component 2025 & 2033
- Figure 3: North America Smart Shelf Market Revenue Share (%), by Component 2025 & 2033
- Figure 4: North America Smart Shelf Market Revenue (Million), by Application 2025 & 2033
- Figure 5: North America Smart Shelf Market Revenue Share (%), by Application 2025 & 2033
- Figure 6: North America Smart Shelf Market Revenue (Million), by Country 2025 & 2033
- Figure 7: North America Smart Shelf Market Revenue Share (%), by Country 2025 & 2033
- Figure 8: Europe Smart Shelf Market Revenue (Million), by Component 2025 & 2033
- Figure 9: Europe Smart Shelf Market Revenue Share (%), by Component 2025 & 2033
- Figure 10: Europe Smart Shelf Market Revenue (Million), by Application 2025 & 2033
- Figure 11: Europe Smart Shelf Market Revenue Share (%), by Application 2025 & 2033
- Figure 12: Europe Smart Shelf Market Revenue (Million), by Country 2025 & 2033
- Figure 13: Europe Smart Shelf Market Revenue Share (%), by Country 2025 & 2033
- Figure 14: Asia Smart Shelf Market Revenue (Million), by Component 2025 & 2033
- Figure 15: Asia Smart Shelf Market Revenue Share (%), by Component 2025 & 2033
- Figure 16: Asia Smart Shelf Market Revenue (Million), by Application 2025 & 2033
- Figure 17: Asia Smart Shelf Market Revenue Share (%), by Application 2025 & 2033
- Figure 18: Asia Smart Shelf Market Revenue (Million), by Country 2025 & 2033
- Figure 19: Asia Smart Shelf Market Revenue Share (%), by Country 2025 & 2033
- Figure 20: Australia and New Zealand Smart Shelf Market Revenue (Million), by Component 2025 & 2033
- Figure 21: Australia and New Zealand Smart Shelf Market Revenue Share (%), by Component 2025 & 2033
- Figure 22: Australia and New Zealand Smart Shelf Market Revenue (Million), by Application 2025 & 2033
- Figure 23: Australia and New Zealand Smart Shelf Market Revenue Share (%), by Application 2025 & 2033
- Figure 24: Australia and New Zealand Smart Shelf Market Revenue (Million), by Country 2025 & 2033
- Figure 25: Australia and New Zealand Smart Shelf Market Revenue Share (%), by Country 2025 & 2033
- Figure 26: Latin America Smart Shelf Market Revenue (Million), by Component 2025 & 2033
- Figure 27: Latin America Smart Shelf Market Revenue Share (%), by Component 2025 & 2033
- Figure 28: Latin America Smart Shelf Market Revenue (Million), by Application 2025 & 2033
- Figure 29: Latin America Smart Shelf Market Revenue Share (%), by Application 2025 & 2033
- Figure 30: Latin America Smart Shelf Market Revenue (Million), by Country 2025 & 2033
- Figure 31: Latin America Smart Shelf Market Revenue Share (%), by Country 2025 & 2033
- Figure 32: Middle East and Africa Smart Shelf Market Revenue (Million), by Component 2025 & 2033
- Figure 33: Middle East and Africa Smart Shelf Market Revenue Share (%), by Component 2025 & 2033
- Figure 34: Middle East and Africa Smart Shelf Market Revenue (Million), by Application 2025 & 2033
- Figure 35: Middle East and Africa Smart Shelf Market Revenue Share (%), by Application 2025 & 2033
- Figure 36: Middle East and Africa Smart Shelf Market Revenue (Million), by Country 2025 & 2033
- Figure 37: Middle East and Africa Smart Shelf Market Revenue Share (%), by Country 2025 & 2033
List of Tables
- Table 1: Global Smart Shelf Market Revenue Million Forecast, by Component 2020 & 2033
- Table 2: Global Smart Shelf Market Revenue Million Forecast, by Application 2020 & 2033
- Table 3: Global Smart Shelf Market Revenue Million Forecast, by Region 2020 & 2033
- Table 4: Global Smart Shelf Market Revenue Million Forecast, by Component 2020 & 2033
- Table 5: Global Smart Shelf Market Revenue Million Forecast, by Application 2020 & 2033
- Table 6: Global Smart Shelf Market Revenue Million Forecast, by Country 2020 & 2033
- Table 7: United States Smart Shelf Market Revenue (Million) Forecast, by Application 2020 & 2033
- Table 8: Canada Smart Shelf Market Revenue (Million) Forecast, by Application 2020 & 2033
- Table 9: Global Smart Shelf Market Revenue Million Forecast, by Component 2020 & 2033
- Table 10: Global Smart Shelf Market Revenue Million Forecast, by Application 2020 & 2033
- Table 11: Global Smart Shelf Market Revenue Million Forecast, by Country 2020 & 2033
- Table 12: United Kingdom Smart Shelf Market Revenue (Million) Forecast, by Application 2020 & 2033
- Table 13: Germany Smart Shelf Market Revenue (Million) Forecast, by Application 2020 & 2033
- Table 14: Italy Smart Shelf Market Revenue (Million) Forecast, by Application 2020 & 2033
- Table 15: France Smart Shelf Market Revenue (Million) Forecast, by Application 2020 & 2033
- Table 16: Global Smart Shelf Market Revenue Million Forecast, by Component 2020 & 2033
- Table 17: Global Smart Shelf Market Revenue Million Forecast, by Application 2020 & 2033
- Table 18: Global Smart Shelf Market Revenue Million Forecast, by Country 2020 & 2033
- Table 19: China Smart Shelf Market Revenue (Million) Forecast, by Application 2020 & 2033
- Table 20: India Smart Shelf Market Revenue (Million) Forecast, by Application 2020 & 2033
- Table 21: Japan Smart Shelf Market Revenue (Million) Forecast, by Application 2020 & 2033
- Table 22: South Korea Smart Shelf Market Revenue (Million) Forecast, by Application 2020 & 2033
- Table 23: Global Smart Shelf Market Revenue Million Forecast, by Component 2020 & 2033
- Table 24: Global Smart Shelf Market Revenue Million Forecast, by Application 2020 & 2033
- Table 25: Global Smart Shelf Market Revenue Million Forecast, by Country 2020 & 2033
- Table 26: Global Smart Shelf Market Revenue Million Forecast, by Component 2020 & 2033
- Table 27: Global Smart Shelf Market Revenue Million Forecast, by Application 2020 & 2033
- Table 28: Global Smart Shelf Market Revenue Million Forecast, by Country 2020 & 2033
- Table 29: Brazil Smart Shelf Market Revenue (Million) Forecast, by Application 2020 & 2033
- Table 30: Mexico Smart Shelf Market Revenue (Million) Forecast, by Application 2020 & 2033
- Table 31: Global Smart Shelf Market Revenue Million Forecast, by Component 2020 & 2033
- Table 32: Global Smart Shelf Market Revenue Million Forecast, by Application 2020 & 2033
- Table 33: Global Smart Shelf Market Revenue Million Forecast, by Country 2020 & 2033
Frequently Asked Questions
1. What is the projected Compound Annual Growth Rate (CAGR) of the Smart Shelf Market?
The projected CAGR is approximately 22.26%.
2. Which companies are prominent players in the Smart Shelf Market?
Key companies in the market include Honeywell International Inc, Lenovo PCCW Solutions Limited, NXP Semiconductors N, AWM Smart Shelf, Samsung Electronics Co Ltd, Happiest Minds Technologies Limited, Trax Technology Solutions, Avery Dennison Corporation, Huawei Technologies Co Ltd, E Ink Holdings Inc, Intel Corporation.
3. What are the main segments of the Smart Shelf Market?
The market segments include Component, Application.
4. Can you provide details about the market size?
The market size is estimated to be USD 4.61 Million as of 2022.
5. What are some drivers contributing to market growth?
Adoption of Enhanced Inventory Management; Growing Demand for Real-Time Stock Information and Inventory Management in the Retail Sector.
6. What are the notable trends driving market growth?
Adoption of Enhanced Inventory Management is Expected to Drive the Market.
7. Are there any restraints impacting market growth?
High Designing and Development Cost.
8. Can you provide examples of recent developments in the market?
April 2024 - E Ink (8069.TW) has announced it is collaborating with ecosystem partners Realtek Semiconductor (Realtek), Integrated Solutions Technology (IST), and Chipbond Technology Corporation (Chipbond) to develop the System on Panel (SoP) architecture. This technology will be integrated into the next-generation electronic shelf label (ESL) jointly developed with the system integrator, SOLUM. In order to simplify the material structure of ESL, this collaboration aims to bring a sustainable solution via reduced material usage, lower power consumption and simplified production processes.
9. What pricing options are available for accessing the report?
Pricing options include single-user, multi-user, and enterprise licenses priced at USD 4750, USD 5250, and USD 8750 respectively.
10. Is the market size provided in terms of value or volume?
The market size is provided in terms of value, measured in Million.
11. Are there any specific market keywords associated with the report?
Yes, the market keyword associated with the report is "Smart Shelf Market," which aids in identifying and referencing the specific market segment covered.
12. How do I determine which pricing option suits my needs best?
The pricing options vary based on user requirements and access needs. Individual users may opt for single-user licenses, while businesses requiring broader access may choose multi-user or enterprise licenses for cost-effective access to the report.
13. Are there any additional resources or data provided in the Smart Shelf Market report?
While the report offers comprehensive insights, it's advisable to review the specific contents or supplementary materials provided to ascertain if additional resources or data are available.
14. How can I stay updated on further developments or reports in the Smart Shelf Market?
To stay informed about further developments, trends, and reports in the Smart Shelf Market, consider subscribing to industry newsletters, following relevant companies and organizations, or regularly checking reputable industry news sources and publications.
Methodology
Step 1 - Identification of Relevant Samples Size from Population Database


Step 2 - Approaches for Defining Global Market Size (Value, Volume* & Price*)

Note*: In applicable scenarios
Step 3 - Data Sources
Primary Research
- Web Analytics
- Survey Reports
- Research Institute
- Latest Research Reports
- Opinion Leaders
Secondary Research
- Annual Reports
- White Paper
- Latest Press Release
- Industry Association
- Paid Database
- Investor Presentations

Step 4 - Data Triangulation
Involves using different sources of information in order to increase the validity of a study
These sources are likely to be stakeholders in a program - participants, other researchers, program staff, other community members, and so on.
Then we put all data in single framework & apply various statistical tools to find out the dynamic on the market.
During the analysis stage, feedback from the stakeholder groups would be compared to determine areas of agreement as well as areas of divergence