

Key Insights
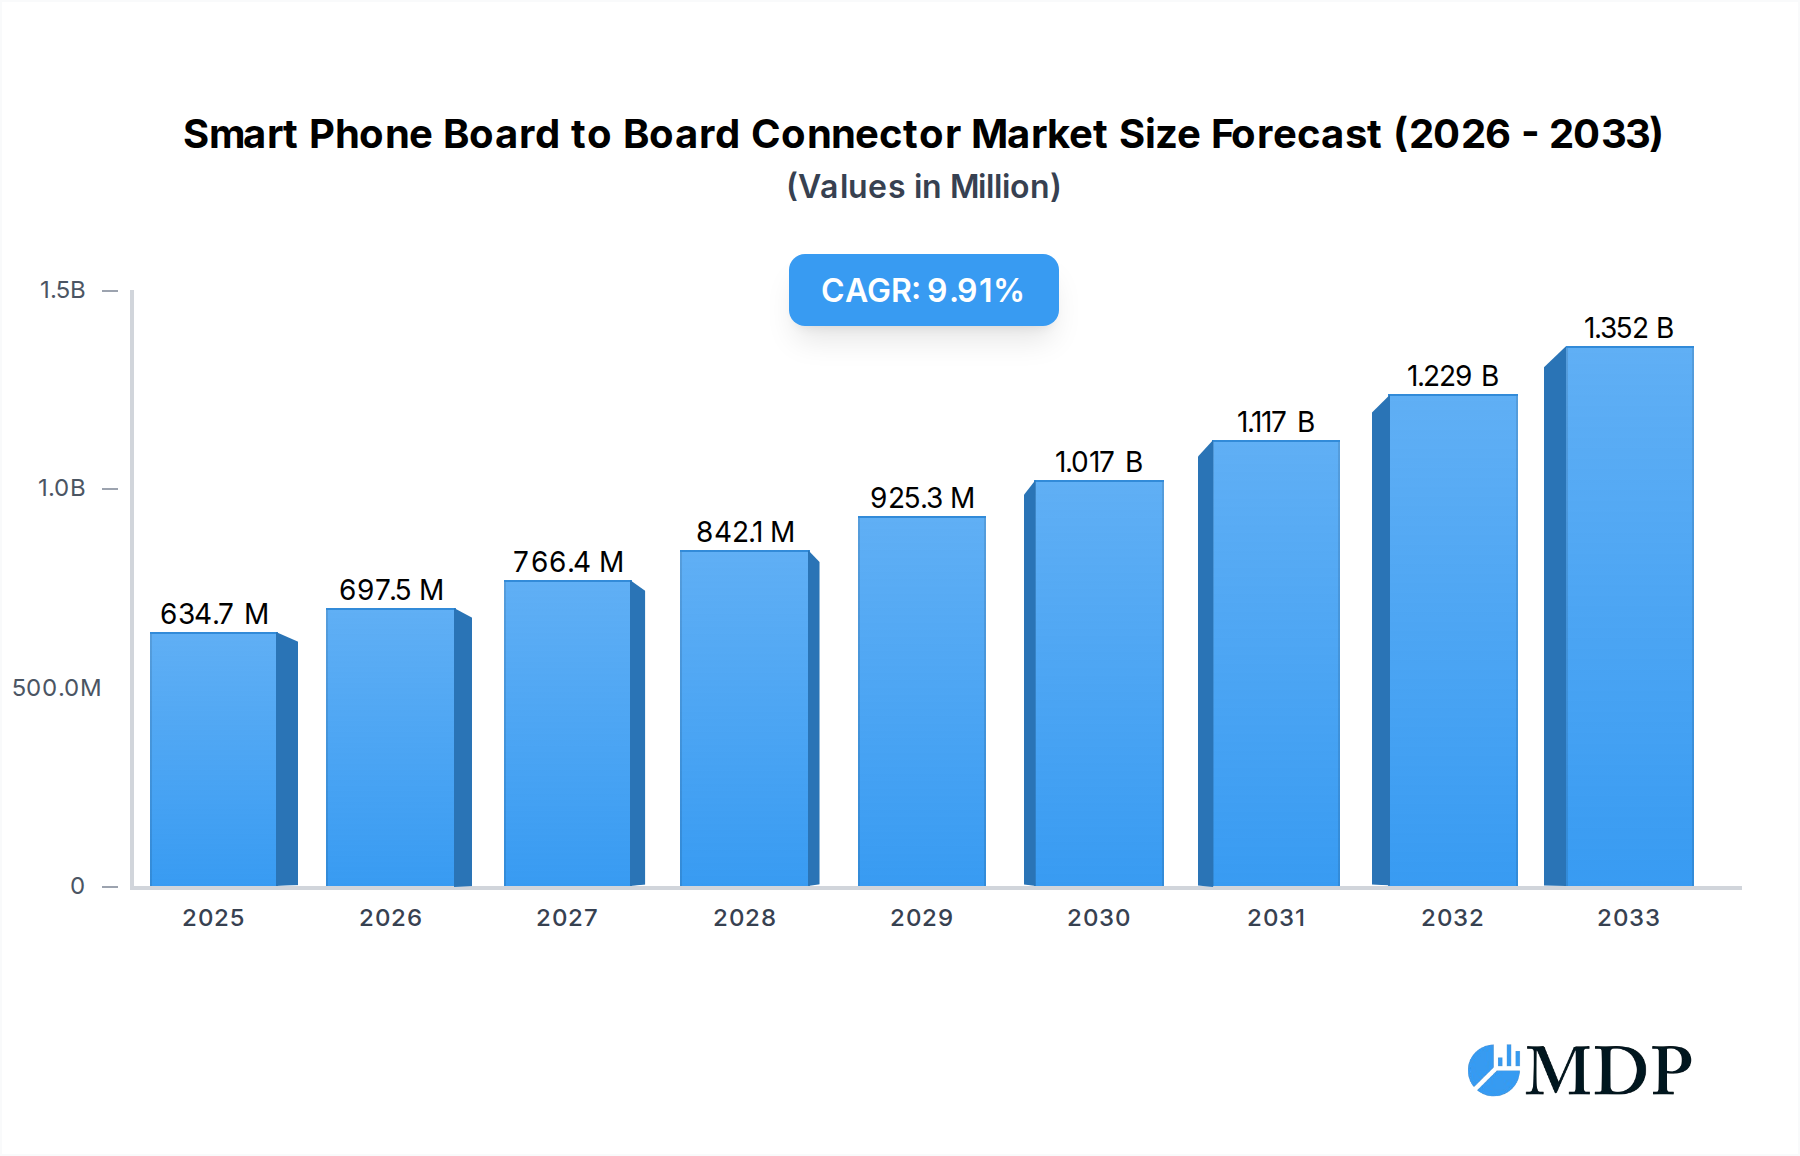
The global Smart Phone Board to Board Connector market is poised for robust expansion, driven by the increasing sophistication and miniaturization of smartphone components. With a projected market size of 634.7 million in 2025, the industry is set to experience a Compound Annual Growth Rate (CAGR) of 9.9% over the forecast period of 2025-2033. This sustained growth is largely attributable to the relentless demand for advanced smartphone features, including higher resolution cameras, more powerful processors, and enhanced battery capabilities, all of which necessitate increasingly compact and efficient interconnectivity solutions. The continuous evolution of 5G technology and the integration of AI at the device level further amplify this need for high-performance, space-saving connectors. Emerging trends such as the adoption of flexible PCBs and foldable display technologies are also spurring innovation in board-to-board connector designs, pushing for smaller form factors and improved signal integrity.

Smart Phone Board to Board Connector Market Size (In Million)
While the market demonstrates significant growth potential, certain factors present challenges. The high cost associated with developing and manufacturing these highly specialized connectors can be a restraint for some manufacturers. Furthermore, the increasing complexity of smartphone designs can lead to longer development cycles and potential supply chain disruptions. However, the dominant application segments, namely IOS Phone and Android Phone, are expected to continue their strong uptake of these connectors, reflecting the sheer volume of smartphone production globally. Within the types, connectors with stacking heights below 0.7mm are likely to see the highest demand due to the ever-present pressure for ultra-thin smartphone designs. Key players like TE Connectivity, Amphenol, and Molex are actively investing in research and development to address these challenges and capitalize on the burgeoning opportunities within this dynamic market.
Smart Phone Board to Board Connector Company Market Share
Smart Phone Board to Board Connector Market: In-Depth Analysis and Future Projections (2019–2033)
This comprehensive report delivers an exhaustive analysis of the global Smart Phone Board to Board Connector market, meticulously examining its dynamics, trends, and future trajectory from 2019 to 2033. With a study period spanning 2019-2033, a base year of 2025, and a forecast period from 2025-2033, this report provides actionable insights for industry stakeholders seeking to navigate this rapidly evolving sector. The report covers critical aspects including market concentration, innovation drivers, regulatory landscapes, product substitutes, end-user preferences, and mergers and acquisitions. It delves into industry trends, key market segments within iOS and Android phones, and product types based on stacking heights (below 0.7mm, 0.7-0.8mm, and above 0.8mm). Furthermore, it highlights leading markets, product developments, growth drivers, challenges, emerging opportunities, key players, and significant industry milestones, culminating in a strategic outlook for sustained growth. The estimated market size is projected to reach $XX million by 2025.
Smart Phone Board to Board Connector Market Dynamics & Concentration
The Smart Phone Board to Board Connector market exhibits a moderate level of concentration, with key players such as TE Connectivity, Amphenol, Molex, Panasonic, Kyocera, HRS, LCN, JAE, ECT, OCN, Sunway Communication, YXT, Acon, and CSCNN holding significant market share. Innovation is a primary driver, fueled by the relentless pursuit of miniaturization, higher data transfer speeds, and enhanced power delivery capabilities essential for next-generation smartphones. Regulatory frameworks, while not overly restrictive, focus on material compliance (e.g., RoHS, REACH) and safety standards, indirectly influencing product design and manufacturing processes. Product substitutes, though limited in direct application, include flexible printed circuits and alternative interconnect solutions that may offer some overlap in niche applications. End-user trends are dominated by the demand for sleeker, thinner, and more powerful smartphones, necessitating smaller and more efficient board-to-board connectors. Mergers and acquisition activities are relatively moderate, with strategic partnerships and technological collaborations being more prevalent. For instance, the market has witnessed approximately X M&A deals in the historical period. The estimated market share of the top 5 players is around XX% as of 2025.
Smart Phone Board to Board Connector Industry Trends & Analysis
The Smart Phone Board to Board Connector industry is experiencing robust growth, propelled by several interconnected trends. The insatiable demand for advanced smartphone features, such as enhanced camera systems, 5G connectivity, and immersive display technologies, directly translates into a need for sophisticated and compact interconnect solutions. The compound annual growth rate (CAGR) for the market is projected at XX% over the forecast period. Technological disruptions, including the advent of micro-miniaturization techniques, advanced plating materials for improved conductivity and durability, and innovative stacking technologies, are continuously reshaping the product landscape. Consumer preferences are leaning towards devices with superior performance, extended battery life, and seamless user experiences, all of which are underpinned by efficient internal connectivity. The competitive dynamics are characterized by intense innovation, price sensitivity, and a strong emphasis on supply chain reliability. Market penetration is high, driven by the ubiquity of smartphones globally. The increasing adoption of high-density interconnect (HDI) PCBs in smartphones further fuels the demand for miniature board-to-board connectors. Moreover, the integration of artificial intelligence (AI) and machine learning (ML) within smartphones necessitates higher bandwidth connectors for efficient data processing and communication between various internal modules. The growing trend of foldable and flexible smartphones is also creating new opportunities for specialized board-to-board connectors capable of withstanding repeated flexing and bending. The overall market size is projected to reach $XX million by the end of the forecast period. The market penetration for high-density board-to-board connectors in flagship smartphones is estimated to be over XX%.
Leading Markets & Segments in Smart Phone Board to Board Connector
The global Smart Phone Board to Board Connector market is segmented by application into iOS Phone and Android Phone, and by type into Stacking Height Below 0.7mm, Stacking Height 0.7-0.8mm, and Stacking Height Above 0.8mm. The Android Phone segment currently dominates the market due to its larger global market share and the diverse range of manufacturers and device tiers within this ecosystem. Key drivers for this dominance include the affordability and accessibility of Android devices across various economic strata, particularly in emerging economies. Furthermore, the open-source nature of the Android platform encourages a wider array of hardware innovations and customization, leading to greater demand for a variety of connector solutions.
Within the product types, Stacking Height Below 0.7mm connectors are experiencing the fastest growth, driven by the relentless pursuit of ultra-thin smartphone designs. Manufacturers are constantly pushing the boundaries of miniaturization to create sleeker devices, making these low-profile connectors indispensable.
Dominance Drivers for Android Phones:
- Global Market Share: Android commands a significant majority of the global smartphone market, directly correlating to higher demand for components.
- Manufacturer Diversity: A wide array of manufacturers, from major global players to regional brands, produce Android devices, creating a broad customer base.
- Price Point Versatility: The availability of Android devices across all price segments ensures widespread adoption and sustained demand.
- Innovation Ecosystem: The open nature of Android fosters continuous hardware and software innovation, requiring advanced internal interconnects.
Dominance Drivers for Stacking Height Below 0.7mm:
- Miniaturization Trend: The primary driver for ultra-thin smartphone designs.
- Advanced Manufacturing: Enabled by improvements in precision manufacturing and material science.
- Performance Integration: Allows for denser component placement without compromising functionality.
The iOS Phone segment, while smaller in unit volume compared to Android, represents a high-value segment characterized by premium pricing and a focus on cutting-edge technology, leading to consistent demand for high-performance connectors. The Stacking Height 0.7-0.8mm segment remains crucial, offering a balance between space-saving and ease of assembly for mid-range and flagship devices.
Smart Phone Board to Board Connector Product Developments
Product developments in the Smart Phone Board to Board Connector market are primarily focused on achieving unprecedented miniaturization, higher signal integrity, and enhanced power delivery. Innovations include the introduction of connectors with extremely fine pitches (e.g., 0.3mm and below), advanced shielding techniques to mitigate electromagnetic interference (EMI) in high-speed data transmission, and improved contact resistance for greater efficiency. Manufacturers are also developing connectors with higher mating cycles for increased durability and incorporating materials that offer superior thermal management. These advancements are critical for supporting the integration of 5G modems, advanced processors, and multiple camera sensors within increasingly compact smartphone form factors. Competitive advantages are gained through proprietary designs that offer unique combinations of size, performance, and reliability.
Key Drivers of Smart Phone Board to Board Connector Growth
The growth of the Smart Phone Board to Board Connector market is propelled by several key factors. The relentless demand for thinner and more powerful smartphones is a primary driver, pushing manufacturers to adopt ultra-miniature connectors. The widespread adoption of 5G technology, which requires more complex internal architectures and higher data throughput, directly fuels the need for high-performance connectors. The increasing number of sensors and modules integrated into smartphones, such as advanced camera systems, biometric sensors, and AI accelerators, further necessitates robust and compact interconnect solutions. Furthermore, the growing trend of foldable and flexible smartphones presents new design challenges and opportunities, driving innovation in flexible and robust board-to-board connectors.
Challenges in the Smart Phone Board to Board Connector Market
Despite the promising growth, the Smart Phone Board to Board Connector market faces several challenges. The extremely tight tolerances and complex manufacturing processes required for miniaturized connectors can lead to higher production costs and potential yield issues. Supply chain disruptions, particularly concerning rare earth metals and specialized materials, can impact the availability and price of components. Intense competition among numerous players can lead to price erosion, squeezing profit margins. Additionally, the rapid pace of technological advancement means that connectors can quickly become obsolete, requiring continuous investment in research and development. The estimated impact of supply chain volatility on market growth is approximately XX%.
Emerging Opportunities in Smart Phone Board to Board Connector
Emerging opportunities in the Smart Phone Board to Board Connector market are driven by several catalysts. The ongoing miniaturization trend in consumer electronics, extending beyond smartphones to wearables and IoT devices, presents a significant growth avenue. The development of next-generation communication technologies, such as 6G, will demand even higher bandwidth and lower latency connectors. The increasing focus on advanced driver-assistance systems (ADAS) in automotive applications, often leveraging smartphone-like processing, could also create new markets for similar connector technologies. Strategic partnerships between connector manufacturers and smartphone OEMs are crucial for co-developing bespoke solutions tailored to future device architectures, offering substantial long-term growth potential.
Leading Players in the Smart Phone Board to Board Connector Sector
- TE Connectivity
- Amphenol
- Molex
- Panasonic
- Kyocera
- HRS
- LCN
- JAE
- ECT
- OCN
- Sunway Communication
- YXT
- Acon
- CSCONN
Key Milestones in Smart Phone Board to Board Connector Industry
- 2019: Introduction of 0.3mm pitch connectors, enabling further device miniaturization.
- 2020: Increased adoption of high-speed signal connectors supporting 5G integration.
- 2021: Development of connectors with enhanced EMI shielding for improved signal integrity.
- 2022: Focus on high-mating cycle connectors for foldable and flexible smartphone designs.
- 2023: Advancements in material science leading to improved thermal management capabilities.
- 2024: Innovations in self-aligning connectors for easier assembly in high-volume production.
Strategic Outlook for Smart Phone Board to Board Connector Market
The strategic outlook for the Smart Phone Board to Board Connector market remains exceptionally strong, fueled by continuous innovation and the ever-growing demand for sophisticated mobile devices. Future growth will be accelerated by the integration of advanced AI capabilities within smartphones, necessitating connectors that can handle higher data traffic and processing power. The burgeoning market for foldable and rollable displays will create substantial opportunities for flexible and highly durable interconnect solutions. Furthermore, the expansion of the smartphone ecosystem into related areas like augmented reality (AR) and virtual reality (VR) headsets will drive the need for compact, high-performance board-to-board connectors. Strategic partnerships and vertical integration within the supply chain will be critical for manufacturers to maintain a competitive edge and capture the evolving demands of the smartphone industry. The market is poised for continued expansion, with an estimated growth of XX% by 2033.
Smart Phone Board to Board Connector Segmentation
-
1. Application
- 1.1. IOS Phone
- 1.2. Android Phone
-
2. Types
- 2.1. Stacking Height Below 0.7mm
- 2.2. Stacking Height 0.7-0.8mm
- 2.3. Stacking Height Above 0.8mm
Smart Phone Board to Board Connector Segmentation By Geography
-
1. North America
- 1.1. United States
- 1.2. Canada
- 1.3. Mexico
-
2. South America
- 2.1. Brazil
- 2.2. Argentina
- 2.3. Rest of South America
-
3. Europe
- 3.1. United Kingdom
- 3.2. Germany
- 3.3. France
- 3.4. Italy
- 3.5. Spain
- 3.6. Russia
- 3.7. Benelux
- 3.8. Nordics
- 3.9. Rest of Europe
-
4. Middle East & Africa
- 4.1. Turkey
- 4.2. Israel
- 4.3. GCC
- 4.4. North Africa
- 4.5. South Africa
- 4.6. Rest of Middle East & Africa
-
5. Asia Pacific
- 5.1. China
- 5.2. India
- 5.3. Japan
- 5.4. South Korea
- 5.5. ASEAN
- 5.6. Oceania
- 5.7. Rest of Asia Pacific
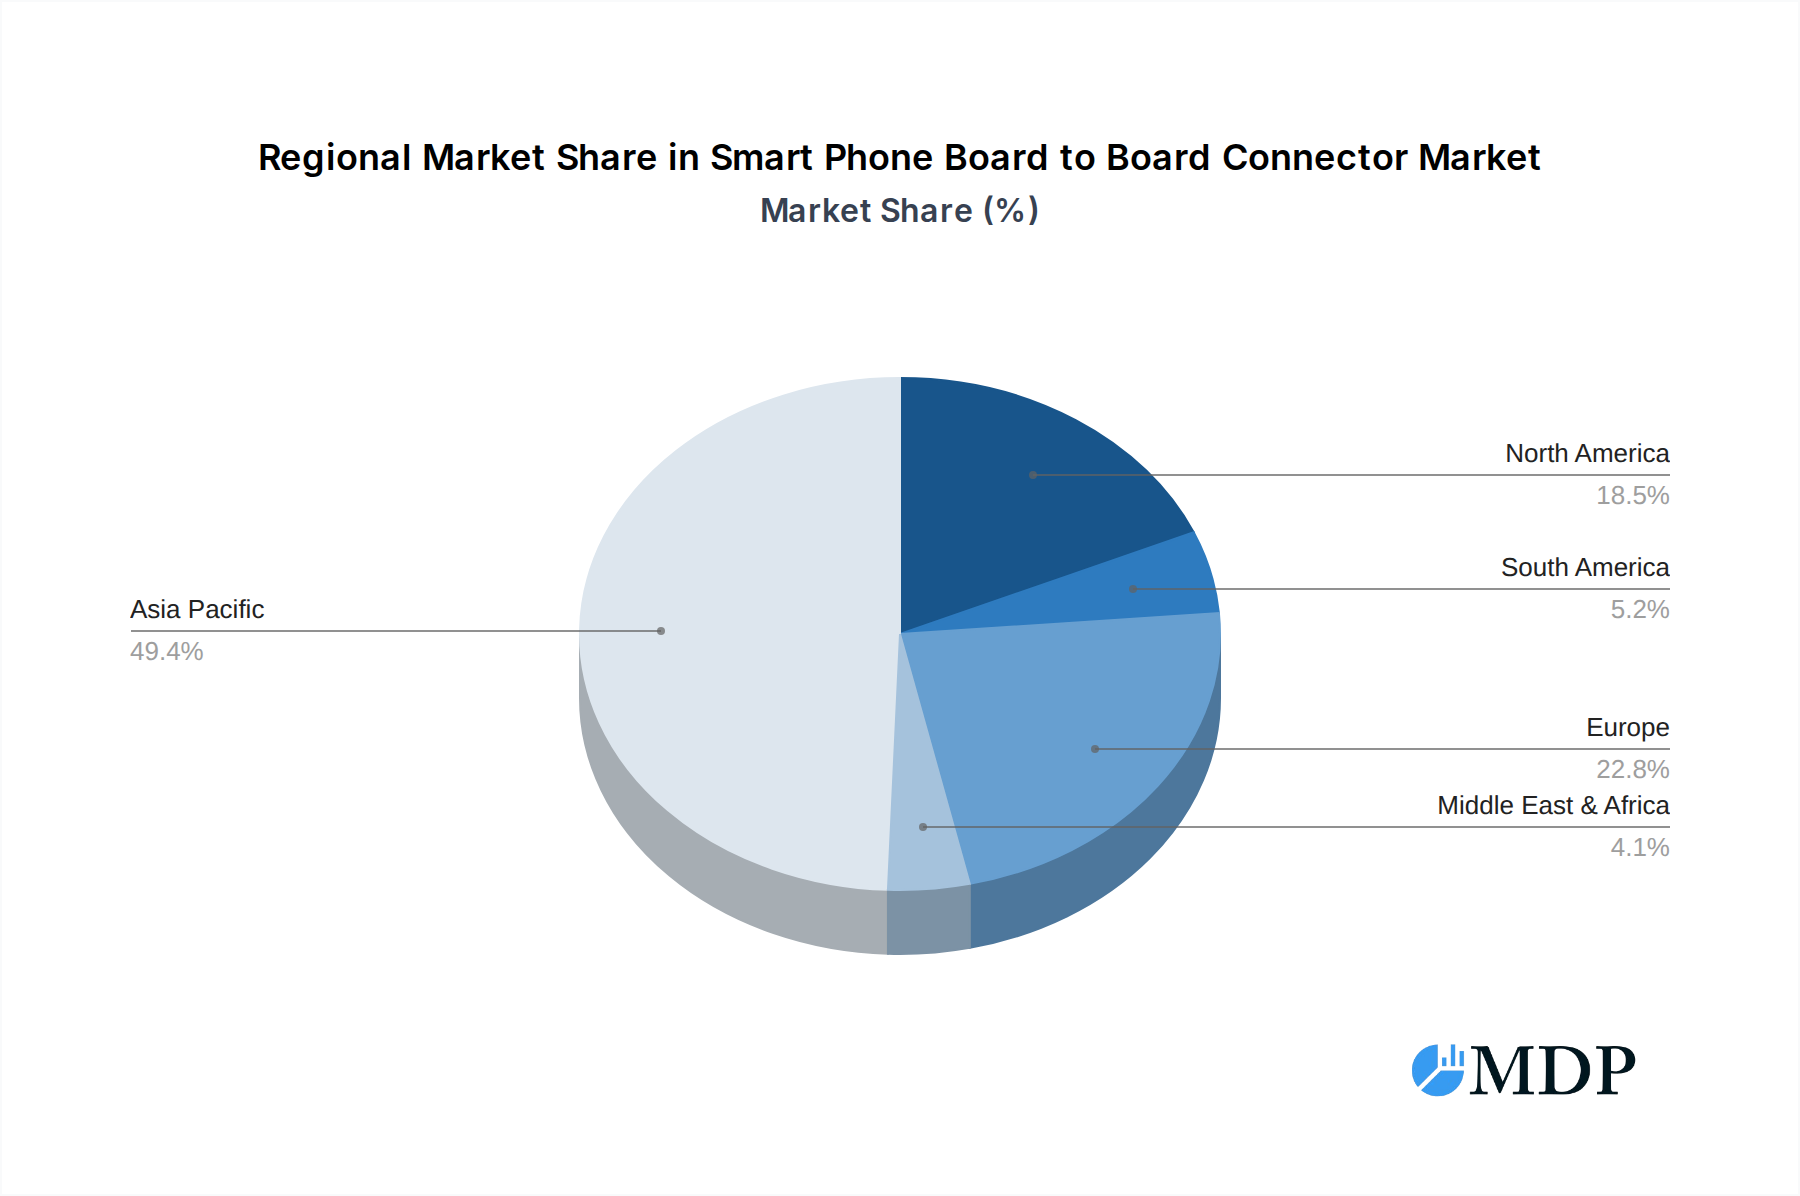
Smart Phone Board to Board Connector Regional Market Share
Geographic Coverage of Smart Phone Board to Board Connector
Smart Phone Board to Board Connector REPORT HIGHLIGHTS
| Aspects | Details |
|---|---|
| Study Period | 2020-2034 |
| Base Year | 2025 |
| Estimated Year | 2026 |
| Forecast Period | 2026-2034 |
| Historical Period | 2020-2025 |
| Growth Rate | CAGR of 9.9% from 2020-2034 |
| Segmentation |
|
Table of Contents
- 1. Introduction
- 1.1. Research Scope
- 1.2. Market Segmentation
- 1.3. Research Methodology
- 1.4. Definitions and Assumptions
- 2. Executive Summary
- 2.1. Introduction
- 3. Market Dynamics
- 3.1. Introduction
- 3.2. Market Drivers
- 3.3. Market Restrains
- 3.4. Market Trends
- 4. Market Factor Analysis
- 4.1. Porters Five Forces
- 4.2. Supply/Value Chain
- 4.3. PESTEL analysis
- 4.4. Market Entropy
- 4.5. Patent/Trademark Analysis
- 5. Global Smart Phone Board to Board Connector Analysis, Insights and Forecast, 2020-2032
- 5.1. Market Analysis, Insights and Forecast - by Application
- 5.1.1. IOS Phone
- 5.1.2. Android Phone
- 5.2. Market Analysis, Insights and Forecast - by Types
- 5.2.1. Stacking Height Below 0.7mm
- 5.2.2. Stacking Height 0.7-0.8mm
- 5.2.3. Stacking Height Above 0.8mm
- 5.3. Market Analysis, Insights and Forecast - by Region
- 5.3.1. North America
- 5.3.2. South America
- 5.3.3. Europe
- 5.3.4. Middle East & Africa
- 5.3.5. Asia Pacific
- 5.1. Market Analysis, Insights and Forecast - by Application
- 6. North America Smart Phone Board to Board Connector Analysis, Insights and Forecast, 2020-2032
- 6.1. Market Analysis, Insights and Forecast - by Application
- 6.1.1. IOS Phone
- 6.1.2. Android Phone
- 6.2. Market Analysis, Insights and Forecast - by Types
- 6.2.1. Stacking Height Below 0.7mm
- 6.2.2. Stacking Height 0.7-0.8mm
- 6.2.3. Stacking Height Above 0.8mm
- 6.1. Market Analysis, Insights and Forecast - by Application
- 7. South America Smart Phone Board to Board Connector Analysis, Insights and Forecast, 2020-2032
- 7.1. Market Analysis, Insights and Forecast - by Application
- 7.1.1. IOS Phone
- 7.1.2. Android Phone
- 7.2. Market Analysis, Insights and Forecast - by Types
- 7.2.1. Stacking Height Below 0.7mm
- 7.2.2. Stacking Height 0.7-0.8mm
- 7.2.3. Stacking Height Above 0.8mm
- 7.1. Market Analysis, Insights and Forecast - by Application
- 8. Europe Smart Phone Board to Board Connector Analysis, Insights and Forecast, 2020-2032
- 8.1. Market Analysis, Insights and Forecast - by Application
- 8.1.1. IOS Phone
- 8.1.2. Android Phone
- 8.2. Market Analysis, Insights and Forecast - by Types
- 8.2.1. Stacking Height Below 0.7mm
- 8.2.2. Stacking Height 0.7-0.8mm
- 8.2.3. Stacking Height Above 0.8mm
- 8.1. Market Analysis, Insights and Forecast - by Application
- 9. Middle East & Africa Smart Phone Board to Board Connector Analysis, Insights and Forecast, 2020-2032
- 9.1. Market Analysis, Insights and Forecast - by Application
- 9.1.1. IOS Phone
- 9.1.2. Android Phone
- 9.2. Market Analysis, Insights and Forecast - by Types
- 9.2.1. Stacking Height Below 0.7mm
- 9.2.2. Stacking Height 0.7-0.8mm
- 9.2.3. Stacking Height Above 0.8mm
- 9.1. Market Analysis, Insights and Forecast - by Application
- 10. Asia Pacific Smart Phone Board to Board Connector Analysis, Insights and Forecast, 2020-2032
- 10.1. Market Analysis, Insights and Forecast - by Application
- 10.1.1. IOS Phone
- 10.1.2. Android Phone
- 10.2. Market Analysis, Insights and Forecast - by Types
- 10.2.1. Stacking Height Below 0.7mm
- 10.2.2. Stacking Height 0.7-0.8mm
- 10.2.3. Stacking Height Above 0.8mm
- 10.1. Market Analysis, Insights and Forecast - by Application
- 11. Competitive Analysis
- 11.1. Global Market Share Analysis 2025
- 11.2. Company Profiles
- 11.2.1 TE Connectivity
- 11.2.1.1. Overview
- 11.2.1.2. Products
- 11.2.1.3. SWOT Analysis
- 11.2.1.4. Recent Developments
- 11.2.1.5. Financials (Based on Availability)
- 11.2.2 Amphenol
- 11.2.2.1. Overview
- 11.2.2.2. Products
- 11.2.2.3. SWOT Analysis
- 11.2.2.4. Recent Developments
- 11.2.2.5. Financials (Based on Availability)
- 11.2.3 Molex
- 11.2.3.1. Overview
- 11.2.3.2. Products
- 11.2.3.3. SWOT Analysis
- 11.2.3.4. Recent Developments
- 11.2.3.5. Financials (Based on Availability)
- 11.2.4 Panasonic
- 11.2.4.1. Overview
- 11.2.4.2. Products
- 11.2.4.3. SWOT Analysis
- 11.2.4.4. Recent Developments
- 11.2.4.5. Financials (Based on Availability)
- 11.2.5 Kyosera
- 11.2.5.1. Overview
- 11.2.5.2. Products
- 11.2.5.3. SWOT Analysis
- 11.2.5.4. Recent Developments
- 11.2.5.5. Financials (Based on Availability)
- 11.2.6 HRS
- 11.2.6.1. Overview
- 11.2.6.2. Products
- 11.2.6.3. SWOT Analysis
- 11.2.6.4. Recent Developments
- 11.2.6.5. Financials (Based on Availability)
- 11.2.7 LCN
- 11.2.7.1. Overview
- 11.2.7.2. Products
- 11.2.7.3. SWOT Analysis
- 11.2.7.4. Recent Developments
- 11.2.7.5. Financials (Based on Availability)
- 11.2.8 JAE
- 11.2.8.1. Overview
- 11.2.8.2. Products
- 11.2.8.3. SWOT Analysis
- 11.2.8.4. Recent Developments
- 11.2.8.5. Financials (Based on Availability)
- 11.2.9 ECT
- 11.2.9.1. Overview
- 11.2.9.2. Products
- 11.2.9.3. SWOT Analysis
- 11.2.9.4. Recent Developments
- 11.2.9.5. Financials (Based on Availability)
- 11.2.10 OCN
- 11.2.10.1. Overview
- 11.2.10.2. Products
- 11.2.10.3. SWOT Analysis
- 11.2.10.4. Recent Developments
- 11.2.10.5. Financials (Based on Availability)
- 11.2.11 Sunway Communication
- 11.2.11.1. Overview
- 11.2.11.2. Products
- 11.2.11.3. SWOT Analysis
- 11.2.11.4. Recent Developments
- 11.2.11.5. Financials (Based on Availability)
- 11.2.12 YXT
- 11.2.12.1. Overview
- 11.2.12.2. Products
- 11.2.12.3. SWOT Analysis
- 11.2.12.4. Recent Developments
- 11.2.12.5. Financials (Based on Availability)
- 11.2.13 Acon
- 11.2.13.1. Overview
- 11.2.13.2. Products
- 11.2.13.3. SWOT Analysis
- 11.2.13.4. Recent Developments
- 11.2.13.5. Financials (Based on Availability)
- 11.2.14 CSCONN
- 11.2.14.1. Overview
- 11.2.14.2. Products
- 11.2.14.3. SWOT Analysis
- 11.2.14.4. Recent Developments
- 11.2.14.5. Financials (Based on Availability)
- 11.2.1 TE Connectivity
List of Figures
- Figure 1: Global Smart Phone Board to Board Connector Revenue Breakdown (million, %) by Region 2025 & 2033
- Figure 2: Global Smart Phone Board to Board Connector Volume Breakdown (K, %) by Region 2025 & 2033
- Figure 3: North America Smart Phone Board to Board Connector Revenue (million), by Application 2025 & 2033
- Figure 4: North America Smart Phone Board to Board Connector Volume (K), by Application 2025 & 2033
- Figure 5: North America Smart Phone Board to Board Connector Revenue Share (%), by Application 2025 & 2033
- Figure 6: North America Smart Phone Board to Board Connector Volume Share (%), by Application 2025 & 2033
- Figure 7: North America Smart Phone Board to Board Connector Revenue (million), by Types 2025 & 2033
- Figure 8: North America Smart Phone Board to Board Connector Volume (K), by Types 2025 & 2033
- Figure 9: North America Smart Phone Board to Board Connector Revenue Share (%), by Types 2025 & 2033
- Figure 10: North America Smart Phone Board to Board Connector Volume Share (%), by Types 2025 & 2033
- Figure 11: North America Smart Phone Board to Board Connector Revenue (million), by Country 2025 & 2033
- Figure 12: North America Smart Phone Board to Board Connector Volume (K), by Country 2025 & 2033
- Figure 13: North America Smart Phone Board to Board Connector Revenue Share (%), by Country 2025 & 2033
- Figure 14: North America Smart Phone Board to Board Connector Volume Share (%), by Country 2025 & 2033
- Figure 15: South America Smart Phone Board to Board Connector Revenue (million), by Application 2025 & 2033
- Figure 16: South America Smart Phone Board to Board Connector Volume (K), by Application 2025 & 2033
- Figure 17: South America Smart Phone Board to Board Connector Revenue Share (%), by Application 2025 & 2033
- Figure 18: South America Smart Phone Board to Board Connector Volume Share (%), by Application 2025 & 2033
- Figure 19: South America Smart Phone Board to Board Connector Revenue (million), by Types 2025 & 2033
- Figure 20: South America Smart Phone Board to Board Connector Volume (K), by Types 2025 & 2033
- Figure 21: South America Smart Phone Board to Board Connector Revenue Share (%), by Types 2025 & 2033
- Figure 22: South America Smart Phone Board to Board Connector Volume Share (%), by Types 2025 & 2033
- Figure 23: South America Smart Phone Board to Board Connector Revenue (million), by Country 2025 & 2033
- Figure 24: South America Smart Phone Board to Board Connector Volume (K), by Country 2025 & 2033
- Figure 25: South America Smart Phone Board to Board Connector Revenue Share (%), by Country 2025 & 2033
- Figure 26: South America Smart Phone Board to Board Connector Volume Share (%), by Country 2025 & 2033
- Figure 27: Europe Smart Phone Board to Board Connector Revenue (million), by Application 2025 & 2033
- Figure 28: Europe Smart Phone Board to Board Connector Volume (K), by Application 2025 & 2033
- Figure 29: Europe Smart Phone Board to Board Connector Revenue Share (%), by Application 2025 & 2033
- Figure 30: Europe Smart Phone Board to Board Connector Volume Share (%), by Application 2025 & 2033
- Figure 31: Europe Smart Phone Board to Board Connector Revenue (million), by Types 2025 & 2033
- Figure 32: Europe Smart Phone Board to Board Connector Volume (K), by Types 2025 & 2033
- Figure 33: Europe Smart Phone Board to Board Connector Revenue Share (%), by Types 2025 & 2033
- Figure 34: Europe Smart Phone Board to Board Connector Volume Share (%), by Types 2025 & 2033
- Figure 35: Europe Smart Phone Board to Board Connector Revenue (million), by Country 2025 & 2033
- Figure 36: Europe Smart Phone Board to Board Connector Volume (K), by Country 2025 & 2033
- Figure 37: Europe Smart Phone Board to Board Connector Revenue Share (%), by Country 2025 & 2033
- Figure 38: Europe Smart Phone Board to Board Connector Volume Share (%), by Country 2025 & 2033
- Figure 39: Middle East & Africa Smart Phone Board to Board Connector Revenue (million), by Application 2025 & 2033
- Figure 40: Middle East & Africa Smart Phone Board to Board Connector Volume (K), by Application 2025 & 2033
- Figure 41: Middle East & Africa Smart Phone Board to Board Connector Revenue Share (%), by Application 2025 & 2033
- Figure 42: Middle East & Africa Smart Phone Board to Board Connector Volume Share (%), by Application 2025 & 2033
- Figure 43: Middle East & Africa Smart Phone Board to Board Connector Revenue (million), by Types 2025 & 2033
- Figure 44: Middle East & Africa Smart Phone Board to Board Connector Volume (K), by Types 2025 & 2033
- Figure 45: Middle East & Africa Smart Phone Board to Board Connector Revenue Share (%), by Types 2025 & 2033
- Figure 46: Middle East & Africa Smart Phone Board to Board Connector Volume Share (%), by Types 2025 & 2033
- Figure 47: Middle East & Africa Smart Phone Board to Board Connector Revenue (million), by Country 2025 & 2033
- Figure 48: Middle East & Africa Smart Phone Board to Board Connector Volume (K), by Country 2025 & 2033
- Figure 49: Middle East & Africa Smart Phone Board to Board Connector Revenue Share (%), by Country 2025 & 2033
- Figure 50: Middle East & Africa Smart Phone Board to Board Connector Volume Share (%), by Country 2025 & 2033
- Figure 51: Asia Pacific Smart Phone Board to Board Connector Revenue (million), by Application 2025 & 2033
- Figure 52: Asia Pacific Smart Phone Board to Board Connector Volume (K), by Application 2025 & 2033
- Figure 53: Asia Pacific Smart Phone Board to Board Connector Revenue Share (%), by Application 2025 & 2033
- Figure 54: Asia Pacific Smart Phone Board to Board Connector Volume Share (%), by Application 2025 & 2033
- Figure 55: Asia Pacific Smart Phone Board to Board Connector Revenue (million), by Types 2025 & 2033
- Figure 56: Asia Pacific Smart Phone Board to Board Connector Volume (K), by Types 2025 & 2033
- Figure 57: Asia Pacific Smart Phone Board to Board Connector Revenue Share (%), by Types 2025 & 2033
- Figure 58: Asia Pacific Smart Phone Board to Board Connector Volume Share (%), by Types 2025 & 2033
- Figure 59: Asia Pacific Smart Phone Board to Board Connector Revenue (million), by Country 2025 & 2033
- Figure 60: Asia Pacific Smart Phone Board to Board Connector Volume (K), by Country 2025 & 2033
- Figure 61: Asia Pacific Smart Phone Board to Board Connector Revenue Share (%), by Country 2025 & 2033
- Figure 62: Asia Pacific Smart Phone Board to Board Connector Volume Share (%), by Country 2025 & 2033
List of Tables
- Table 1: Global Smart Phone Board to Board Connector Revenue million Forecast, by Application 2020 & 2033
- Table 2: Global Smart Phone Board to Board Connector Volume K Forecast, by Application 2020 & 2033
- Table 3: Global Smart Phone Board to Board Connector Revenue million Forecast, by Types 2020 & 2033
- Table 4: Global Smart Phone Board to Board Connector Volume K Forecast, by Types 2020 & 2033
- Table 5: Global Smart Phone Board to Board Connector Revenue million Forecast, by Region 2020 & 2033
- Table 6: Global Smart Phone Board to Board Connector Volume K Forecast, by Region 2020 & 2033
- Table 7: Global Smart Phone Board to Board Connector Revenue million Forecast, by Application 2020 & 2033
- Table 8: Global Smart Phone Board to Board Connector Volume K Forecast, by Application 2020 & 2033
- Table 9: Global Smart Phone Board to Board Connector Revenue million Forecast, by Types 2020 & 2033
- Table 10: Global Smart Phone Board to Board Connector Volume K Forecast, by Types 2020 & 2033
- Table 11: Global Smart Phone Board to Board Connector Revenue million Forecast, by Country 2020 & 2033
- Table 12: Global Smart Phone Board to Board Connector Volume K Forecast, by Country 2020 & 2033
- Table 13: United States Smart Phone Board to Board Connector Revenue (million) Forecast, by Application 2020 & 2033
- Table 14: United States Smart Phone Board to Board Connector Volume (K) Forecast, by Application 2020 & 2033
- Table 15: Canada Smart Phone Board to Board Connector Revenue (million) Forecast, by Application 2020 & 2033
- Table 16: Canada Smart Phone Board to Board Connector Volume (K) Forecast, by Application 2020 & 2033
- Table 17: Mexico Smart Phone Board to Board Connector Revenue (million) Forecast, by Application 2020 & 2033
- Table 18: Mexico Smart Phone Board to Board Connector Volume (K) Forecast, by Application 2020 & 2033
- Table 19: Global Smart Phone Board to Board Connector Revenue million Forecast, by Application 2020 & 2033
- Table 20: Global Smart Phone Board to Board Connector Volume K Forecast, by Application 2020 & 2033
- Table 21: Global Smart Phone Board to Board Connector Revenue million Forecast, by Types 2020 & 2033
- Table 22: Global Smart Phone Board to Board Connector Volume K Forecast, by Types 2020 & 2033
- Table 23: Global Smart Phone Board to Board Connector Revenue million Forecast, by Country 2020 & 2033
- Table 24: Global Smart Phone Board to Board Connector Volume K Forecast, by Country 2020 & 2033
- Table 25: Brazil Smart Phone Board to Board Connector Revenue (million) Forecast, by Application 2020 & 2033
- Table 26: Brazil Smart Phone Board to Board Connector Volume (K) Forecast, by Application 2020 & 2033
- Table 27: Argentina Smart Phone Board to Board Connector Revenue (million) Forecast, by Application 2020 & 2033
- Table 28: Argentina Smart Phone Board to Board Connector Volume (K) Forecast, by Application 2020 & 2033
- Table 29: Rest of South America Smart Phone Board to Board Connector Revenue (million) Forecast, by Application 2020 & 2033
- Table 30: Rest of South America Smart Phone Board to Board Connector Volume (K) Forecast, by Application 2020 & 2033
- Table 31: Global Smart Phone Board to Board Connector Revenue million Forecast, by Application 2020 & 2033
- Table 32: Global Smart Phone Board to Board Connector Volume K Forecast, by Application 2020 & 2033
- Table 33: Global Smart Phone Board to Board Connector Revenue million Forecast, by Types 2020 & 2033
- Table 34: Global Smart Phone Board to Board Connector Volume K Forecast, by Types 2020 & 2033
- Table 35: Global Smart Phone Board to Board Connector Revenue million Forecast, by Country 2020 & 2033
- Table 36: Global Smart Phone Board to Board Connector Volume K Forecast, by Country 2020 & 2033
- Table 37: United Kingdom Smart Phone Board to Board Connector Revenue (million) Forecast, by Application 2020 & 2033
- Table 38: United Kingdom Smart Phone Board to Board Connector Volume (K) Forecast, by Application 2020 & 2033
- Table 39: Germany Smart Phone Board to Board Connector Revenue (million) Forecast, by Application 2020 & 2033
- Table 40: Germany Smart Phone Board to Board Connector Volume (K) Forecast, by Application 2020 & 2033
- Table 41: France Smart Phone Board to Board Connector Revenue (million) Forecast, by Application 2020 & 2033
- Table 42: France Smart Phone Board to Board Connector Volume (K) Forecast, by Application 2020 & 2033
- Table 43: Italy Smart Phone Board to Board Connector Revenue (million) Forecast, by Application 2020 & 2033
- Table 44: Italy Smart Phone Board to Board Connector Volume (K) Forecast, by Application 2020 & 2033
- Table 45: Spain Smart Phone Board to Board Connector Revenue (million) Forecast, by Application 2020 & 2033
- Table 46: Spain Smart Phone Board to Board Connector Volume (K) Forecast, by Application 2020 & 2033
- Table 47: Russia Smart Phone Board to Board Connector Revenue (million) Forecast, by Application 2020 & 2033
- Table 48: Russia Smart Phone Board to Board Connector Volume (K) Forecast, by Application 2020 & 2033
- Table 49: Benelux Smart Phone Board to Board Connector Revenue (million) Forecast, by Application 2020 & 2033
- Table 50: Benelux Smart Phone Board to Board Connector Volume (K) Forecast, by Application 2020 & 2033
- Table 51: Nordics Smart Phone Board to Board Connector Revenue (million) Forecast, by Application 2020 & 2033
- Table 52: Nordics Smart Phone Board to Board Connector Volume (K) Forecast, by Application 2020 & 2033
- Table 53: Rest of Europe Smart Phone Board to Board Connector Revenue (million) Forecast, by Application 2020 & 2033
- Table 54: Rest of Europe Smart Phone Board to Board Connector Volume (K) Forecast, by Application 2020 & 2033
- Table 55: Global Smart Phone Board to Board Connector Revenue million Forecast, by Application 2020 & 2033
- Table 56: Global Smart Phone Board to Board Connector Volume K Forecast, by Application 2020 & 2033
- Table 57: Global Smart Phone Board to Board Connector Revenue million Forecast, by Types 2020 & 2033
- Table 58: Global Smart Phone Board to Board Connector Volume K Forecast, by Types 2020 & 2033
- Table 59: Global Smart Phone Board to Board Connector Revenue million Forecast, by Country 2020 & 2033
- Table 60: Global Smart Phone Board to Board Connector Volume K Forecast, by Country 2020 & 2033
- Table 61: Turkey Smart Phone Board to Board Connector Revenue (million) Forecast, by Application 2020 & 2033
- Table 62: Turkey Smart Phone Board to Board Connector Volume (K) Forecast, by Application 2020 & 2033
- Table 63: Israel Smart Phone Board to Board Connector Revenue (million) Forecast, by Application 2020 & 2033
- Table 64: Israel Smart Phone Board to Board Connector Volume (K) Forecast, by Application 2020 & 2033
- Table 65: GCC Smart Phone Board to Board Connector Revenue (million) Forecast, by Application 2020 & 2033
- Table 66: GCC Smart Phone Board to Board Connector Volume (K) Forecast, by Application 2020 & 2033
- Table 67: North Africa Smart Phone Board to Board Connector Revenue (million) Forecast, by Application 2020 & 2033
- Table 68: North Africa Smart Phone Board to Board Connector Volume (K) Forecast, by Application 2020 & 2033
- Table 69: South Africa Smart Phone Board to Board Connector Revenue (million) Forecast, by Application 2020 & 2033
- Table 70: South Africa Smart Phone Board to Board Connector Volume (K) Forecast, by Application 2020 & 2033
- Table 71: Rest of Middle East & Africa Smart Phone Board to Board Connector Revenue (million) Forecast, by Application 2020 & 2033
- Table 72: Rest of Middle East & Africa Smart Phone Board to Board Connector Volume (K) Forecast, by Application 2020 & 2033
- Table 73: Global Smart Phone Board to Board Connector Revenue million Forecast, by Application 2020 & 2033
- Table 74: Global Smart Phone Board to Board Connector Volume K Forecast, by Application 2020 & 2033
- Table 75: Global Smart Phone Board to Board Connector Revenue million Forecast, by Types 2020 & 2033
- Table 76: Global Smart Phone Board to Board Connector Volume K Forecast, by Types 2020 & 2033
- Table 77: Global Smart Phone Board to Board Connector Revenue million Forecast, by Country 2020 & 2033
- Table 78: Global Smart Phone Board to Board Connector Volume K Forecast, by Country 2020 & 2033
- Table 79: China Smart Phone Board to Board Connector Revenue (million) Forecast, by Application 2020 & 2033
- Table 80: China Smart Phone Board to Board Connector Volume (K) Forecast, by Application 2020 & 2033
- Table 81: India Smart Phone Board to Board Connector Revenue (million) Forecast, by Application 2020 & 2033
- Table 82: India Smart Phone Board to Board Connector Volume (K) Forecast, by Application 2020 & 2033
- Table 83: Japan Smart Phone Board to Board Connector Revenue (million) Forecast, by Application 2020 & 2033
- Table 84: Japan Smart Phone Board to Board Connector Volume (K) Forecast, by Application 2020 & 2033
- Table 85: South Korea Smart Phone Board to Board Connector Revenue (million) Forecast, by Application 2020 & 2033
- Table 86: South Korea Smart Phone Board to Board Connector Volume (K) Forecast, by Application 2020 & 2033
- Table 87: ASEAN Smart Phone Board to Board Connector Revenue (million) Forecast, by Application 2020 & 2033
- Table 88: ASEAN Smart Phone Board to Board Connector Volume (K) Forecast, by Application 2020 & 2033
- Table 89: Oceania Smart Phone Board to Board Connector Revenue (million) Forecast, by Application 2020 & 2033
- Table 90: Oceania Smart Phone Board to Board Connector Volume (K) Forecast, by Application 2020 & 2033
- Table 91: Rest of Asia Pacific Smart Phone Board to Board Connector Revenue (million) Forecast, by Application 2020 & 2033
- Table 92: Rest of Asia Pacific Smart Phone Board to Board Connector Volume (K) Forecast, by Application 2020 & 2033
Frequently Asked Questions
1. What is the projected Compound Annual Growth Rate (CAGR) of the Smart Phone Board to Board Connector?
The projected CAGR is approximately 9.9%.
2. Which companies are prominent players in the Smart Phone Board to Board Connector?
Key companies in the market include TE Connectivity, Amphenol, Molex, Panasonic, Kyosera, HRS, LCN, JAE, ECT, OCN, Sunway Communication, YXT, Acon, CSCONN.
3. What are the main segments of the Smart Phone Board to Board Connector?
The market segments include Application, Types.
4. Can you provide details about the market size?
The market size is estimated to be USD 634.7 million as of 2022.
5. What are some drivers contributing to market growth?
N/A
6. What are the notable trends driving market growth?
N/A
7. Are there any restraints impacting market growth?
N/A
8. Can you provide examples of recent developments in the market?
N/A
9. What pricing options are available for accessing the report?
Pricing options include single-user, multi-user, and enterprise licenses priced at USD 3350.00, USD 5025.00, and USD 6700.00 respectively.
10. Is the market size provided in terms of value or volume?
The market size is provided in terms of value, measured in million and volume, measured in K.
11. Are there any specific market keywords associated with the report?
Yes, the market keyword associated with the report is "Smart Phone Board to Board Connector," which aids in identifying and referencing the specific market segment covered.
12. How do I determine which pricing option suits my needs best?
The pricing options vary based on user requirements and access needs. Individual users may opt for single-user licenses, while businesses requiring broader access may choose multi-user or enterprise licenses for cost-effective access to the report.
13. Are there any additional resources or data provided in the Smart Phone Board to Board Connector report?
While the report offers comprehensive insights, it's advisable to review the specific contents or supplementary materials provided to ascertain if additional resources or data are available.
14. How can I stay updated on further developments or reports in the Smart Phone Board to Board Connector?
To stay informed about further developments, trends, and reports in the Smart Phone Board to Board Connector, consider subscribing to industry newsletters, following relevant companies and organizations, or regularly checking reputable industry news sources and publications.
Methodology
Step 1 - Identification of Relevant Samples Size from Population Database


Step 2 - Approaches for Defining Global Market Size (Value, Volume* & Price*)

Note*: In applicable scenarios
Step 3 - Data Sources
Primary Research
- Web Analytics
- Survey Reports
- Research Institute
- Latest Research Reports
- Opinion Leaders
Secondary Research
- Annual Reports
- White Paper
- Latest Press Release
- Industry Association
- Paid Database
- Investor Presentations

Step 4 - Data Triangulation
Involves using different sources of information in order to increase the validity of a study
These sources are likely to be stakeholders in a program - participants, other researchers, program staff, other community members, and so on.
Then we put all data in single framework & apply various statistical tools to find out the dynamic on the market.
During the analysis stage, feedback from the stakeholder groups would be compared to determine areas of agreement as well as areas of divergence