

Key Insights
The small animal imaging equipment market is experiencing robust expansion, propelled by escalating pet ownership, increased veterinary healthcare spending, and significant advancements in imaging technologies that enhance diagnostic precision. Growing demand for sophisticated tools for early disease detection and management, crucial for improved treatment outcomes and animal welfare, further fuels market growth. While North America and Europe lead in adoption due to established veterinary infrastructure, emerging economies in Asia-Pacific and Latin America are showing considerable growth owing to rising disposable incomes and heightened awareness of pet health. The competitive landscape features established companies like IDEXX, Esaote, and Agfa Healthcare, alongside emerging innovators. Continuous advancements in ultrasound, X-ray, and MRI technologies are driving market evolution, with manufacturers focusing on superior image quality, portability, and user-centric designs.
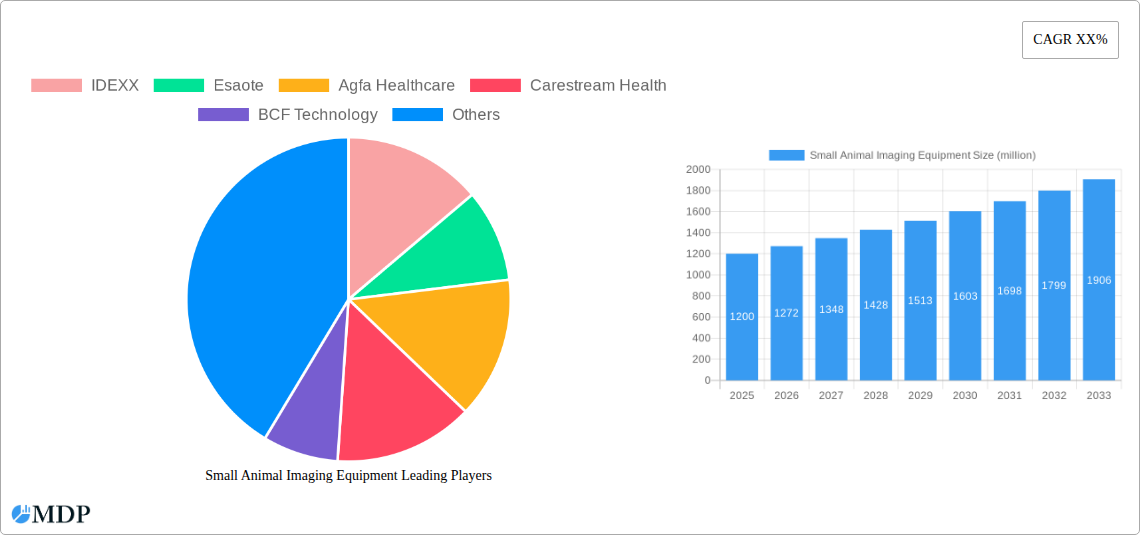
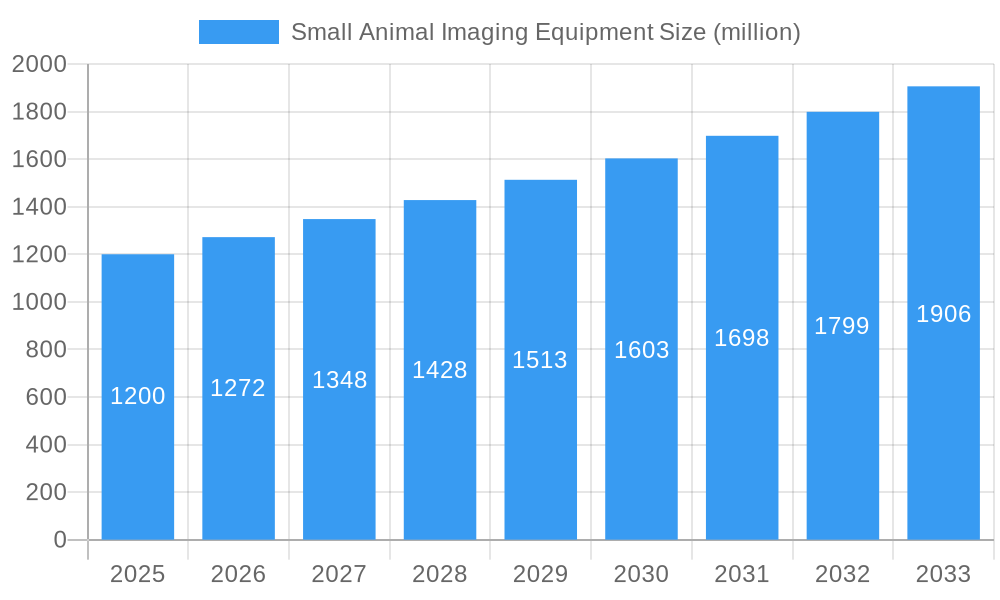
Small Animal Imaging Equipment Market Size (In Million)
Key market restraints include the high acquisition cost of advanced imaging equipment, posing a challenge for smaller veterinary practices, particularly in developing regions. Regulatory complexities and reimbursement policies also present hurdles. Nevertheless, the long-term forecast for the small animal imaging equipment market remains highly optimistic, driven by ongoing technological innovation, expanded access to veterinary care, and a sustained focus on companion animal well-being. Market segmentation is anticipated across equipment types (ultrasound, X-ray, MRI, CT), applications (diagnostic imaging, surgical guidance), and animal categories (canine, feline, avian, etc.). The market is projected to achieve a Compound Annual Growth Rate (CAGR) of 7.93%, with an estimated market size of $842 million in the base year of 2025, and is expected to reach substantial figures by future projections.
Small Animal Imaging Equipment Company Market Share
Small Animal Imaging Equipment Market Report: 2019-2033
This comprehensive report provides an in-depth analysis of the global small animal imaging equipment market, projecting a market value exceeding $XX million by 2033. The study period covers 2019-2033, with 2025 serving as the base and estimated year. This report offers actionable insights for industry stakeholders, investors, and researchers seeking to navigate this dynamic market. Key players analyzed include IDEXX, Esaote, Agfa Healthcare, Carestream Health, BCF Technology, Mindray, Hallmarq, Heska, Sedecal, Kaixin Electric, Chison, MinXray, Diagnostic Imaging Systems, and Bruker Corporation.
Small Animal Imaging Equipment Market Dynamics & Concentration
The global small animal imaging equipment market is characterized by moderate concentration, with the top five players holding an estimated XX% market share in 2025. Innovation drives market growth, particularly advancements in image resolution, portability, and AI-powered diagnostic tools. Stringent regulatory frameworks, varying across regions, significantly influence market entry and product approvals. The market witnesses continuous development of substitute technologies, such as advanced ultrasound systems, posing challenges to established players. End-user trends, including a growing preference for minimally invasive procedures and improved diagnostic accuracy, are key growth drivers. The historical period (2019-2024) witnessed approximately XX M&A deals, indicating a consolidation trend within the industry. The forecast period (2025-2033) is expected to see a similar level of M&A activity driven by the need for enhanced technological capabilities and expanded market reach.
Small Animal Imaging Equipment Industry Trends & Analysis
The small animal imaging equipment market is projected to experience a CAGR of XX% during the forecast period (2025-2033), driven by several factors. Technological advancements, including the integration of artificial intelligence (AI) for automated image analysis and improved image quality, are significantly impacting market growth. This is further fueled by increasing adoption of advanced imaging modalities, such as digital X-ray, ultrasound, and MRI, in veterinary clinics. The market penetration of these advanced technologies is expected to reach XX% by 2033. Consumer preferences are shifting towards high-resolution imaging for enhanced diagnostic accuracy and minimally invasive procedures, creating a strong demand for sophisticated imaging equipment. Competitive dynamics are intensified by ongoing product innovation, price competition, and strategic partnerships among key players.
Leading Markets & Segments in Small Animal Imaging Equipment
The North American market currently dominates the global small animal imaging equipment market, accounting for approximately XX% of the total revenue in 2025. This dominance is attributed to factors such as:
- High veterinary healthcare expenditure: High disposable income and pet ownership rates contribute to substantial investment in advanced veterinary care.
- Advanced healthcare infrastructure: Well-established veterinary infrastructure and a high concentration of specialized veterinary clinics drive demand for sophisticated imaging technologies.
- Strong regulatory support: Supportive regulatory frameworks promote innovation and adoption of new imaging technologies.
Other regions, including Europe and Asia-Pacific, are witnessing significant growth, fueled by rising pet ownership, improving veterinary infrastructure, and increased awareness of the benefits of advanced imaging. However, the North American market's established infrastructure and high spending power maintain its leading position.
Small Animal Imaging Equipment Product Developments
Recent product innovations focus on enhancing image quality, portability, and user-friendliness. Manufacturers are integrating advanced features like AI-powered image analysis, wireless connectivity, and improved workflow efficiency to meet the evolving needs of veterinary professionals. These innovations offer improved diagnostic accuracy, reduced examination time, and enhanced operational efficiency, providing a strong competitive advantage in the market. The market is also seeing the development of specialized imaging systems tailored for specific animal species and clinical applications.
Key Drivers of Small Animal Imaging Equipment Growth
Technological advancements, particularly in AI-powered image analysis and miniaturization of imaging systems, are key growth drivers. Economic factors, such as increasing pet ownership and higher disposable incomes in developed and developing countries, fuel market expansion. Supportive regulatory frameworks that encourage the adoption of advanced veterinary technologies also contribute to growth. For example, government initiatives promoting animal welfare and investments in veterinary infrastructure are positively impacting market expansion.
Challenges in the Small Animal Imaging Equipment Market
High initial investment costs for advanced imaging equipment can be a barrier to entry for smaller veterinary clinics. Supply chain disruptions, particularly for critical components, can impact production and availability. Intense competition among established players and the emergence of new technologies pose challenges to market profitability. The impact of these challenges on market growth is estimated to be around XX% in 2025.
Emerging Opportunities in Small Animal Imaging Equipment
The integration of telemedicine and remote diagnostics opens exciting opportunities for market expansion, enabling access to advanced imaging services for remote veterinary clinics. Strategic partnerships between imaging equipment manufacturers and veterinary software providers can create integrated solutions improving workflow efficiency and diagnostic accuracy. Expansion into emerging markets with growing pet ownership and veterinary infrastructure offers substantial untapped potential.
Leading Players in the Small Animal Imaging Equipment Sector
- IDEXX
- Esaote
- Agfa Healthcare
- Carestream Health
- BCF Technology
- Mindray
- Hallmarq
- Heska
- Sedecal
- Kaixin Electric
- Chison
- MinXray
- Diagnostic Imaging Systems
- Bruker Corporation
Key Milestones in Small Animal Imaging Equipment Industry
- 2020: IDEXX launched a new portable ultrasound system.
- 2021: Esaote introduced AI-powered image analysis capabilities in its veterinary ultrasound systems.
- 2022: A major merger between two small animal imaging companies resulted in increased market consolidation.
- 2023: Several companies announced new partnerships to develop integrated veterinary imaging and software solutions.
- 2024: Significant advancements in digital X-ray technology improved image quality and reduced radiation exposure.
Strategic Outlook for Small Animal Imaging Equipment Market
The future of the small animal imaging equipment market is promising, driven by continued technological innovation, increasing adoption of advanced imaging modalities, and expansion into new markets. Strategic partnerships, focused on developing integrated solutions and expanding market access, will play a key role in shaping future market growth. The market is poised for substantial growth, exceeding $XX million by 2033, fueled by these positive trends and strategic initiatives.
Small Animal Imaging Equipment Segmentation
-
1. Application
- 1.1. Cancer and Anti-cancer Drug Research
- 1.2. Immunology and Stem Cell Research
- 1.3. Pathological Mechanism and Virus Research
- 1.4. Gene Expression and Protein
- 1.5. Biophotonic Detection
- 1.6. Food Supervision and Environmental Supervision
-
2. Types
- 2.1. Optical Imaging
- 2.2. Radionuclide Imaging
- 2.3. MRI
- 2.4. Computed Tomography Imaging
- 2.5. Ultrasound Imaging
Small Animal Imaging Equipment Segmentation By Geography
-
1. North America
- 1.1. United States
- 1.2. Canada
- 1.3. Mexico
-
2. South America
- 2.1. Brazil
- 2.2. Argentina
- 2.3. Rest of South America
-
3. Europe
- 3.1. United Kingdom
- 3.2. Germany
- 3.3. France
- 3.4. Italy
- 3.5. Spain
- 3.6. Russia
- 3.7. Benelux
- 3.8. Nordics
- 3.9. Rest of Europe
-
4. Middle East & Africa
- 4.1. Turkey
- 4.2. Israel
- 4.3. GCC
- 4.4. North Africa
- 4.5. South Africa
- 4.6. Rest of Middle East & Africa
-
5. Asia Pacific
- 5.1. China
- 5.2. India
- 5.3. Japan
- 5.4. South Korea
- 5.5. ASEAN
- 5.6. Oceania
- 5.7. Rest of Asia Pacific
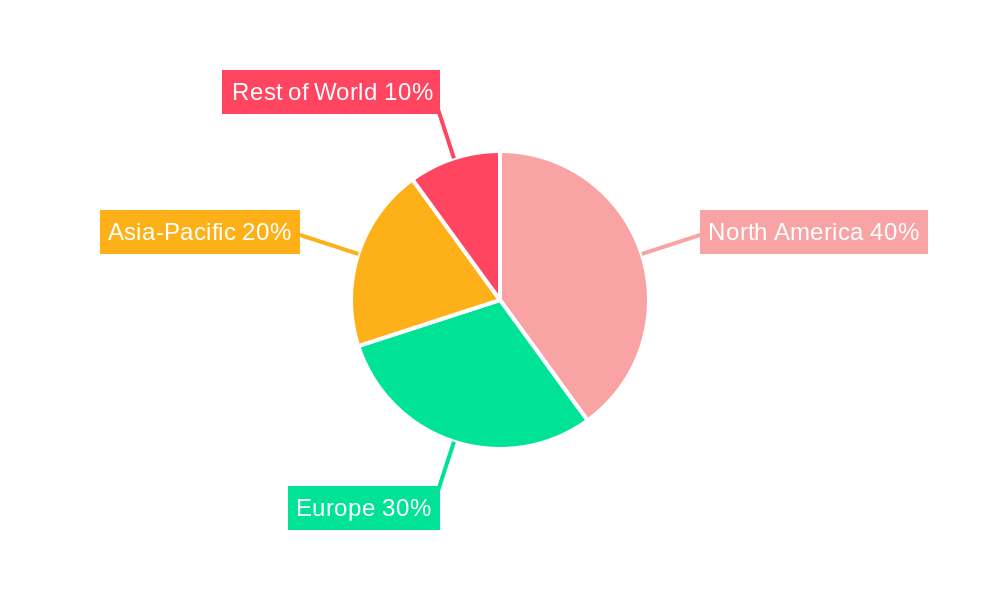
Small Animal Imaging Equipment Regional Market Share
Geographic Coverage of Small Animal Imaging Equipment
Small Animal Imaging Equipment REPORT HIGHLIGHTS
| Aspects | Details |
|---|---|
| Study Period | 2020-2034 |
| Base Year | 2025 |
| Estimated Year | 2026 |
| Forecast Period | 2026-2034 |
| Historical Period | 2020-2025 |
| Growth Rate | CAGR of 7.93% from 2020-2034 |
| Segmentation |
|
Table of Contents
- 1. Introduction
- 1.1. Research Scope
- 1.2. Market Segmentation
- 1.3. Research Objective
- 1.4. Definitions and Assumptions
- 2. Executive Summary
- 2.1. Market Snapshot
- 3. Market Dynamics
- 3.1. Market Drivers
- 3.2. Market Restrains
- 3.3. Market Trends
- 3.4. Market Opportunities
- 4. Market Factor Analysis
- 4.1. Porters Five Forces
- 4.1.1. Bargaining Power of Suppliers
- 4.1.2. Bargaining Power of Buyers
- 4.1.3. Threat of New Entrants
- 4.1.4. Threat of Substitutes
- 4.1.5. Competitive Rivalry
- 4.2. PESTEL analysis
- 4.3. BCG Analysis
- 4.3.1. Stars (High Growth, High Market Share)
- 4.3.2. Cash Cows (Low Growth, High Market Share)
- 4.3.3. Question Mark (High Growth, Low Market Share)
- 4.3.4. Dogs (Low Growth, Low Market Share)
- 4.4. Ansoff Matrix Analysis
- 4.5. Supply Chain Analysis
- 4.6. Regulatory Landscape
- 4.7. Current Market Potential and Opportunity Assessment (TAM–SAM–SOM Framework)
- 4.8. MDP Analyst Note
- 4.1. Porters Five Forces
- 5. Market Analysis, Insights and Forecast 2021-2033
- 5.1. Market Analysis, Insights and Forecast - by Application
- 5.1.1. Cancer and Anti-cancer Drug Research
- 5.1.2. Immunology and Stem Cell Research
- 5.1.3. Pathological Mechanism and Virus Research
- 5.1.4. Gene Expression and Protein
- 5.1.5. Biophotonic Detection
- 5.1.6. Food Supervision and Environmental Supervision
- 5.2. Market Analysis, Insights and Forecast - by Types
- 5.2.1. Optical Imaging
- 5.2.2. Radionuclide Imaging
- 5.2.3. MRI
- 5.2.4. Computed Tomography Imaging
- 5.2.5. Ultrasound Imaging
- 5.3. Market Analysis, Insights and Forecast - by Region
- 5.3.1. North America
- 5.3.2. South America
- 5.3.3. Europe
- 5.3.4. Middle East & Africa
- 5.3.5. Asia Pacific
- 5.1. Market Analysis, Insights and Forecast - by Application
- 6. Global Small Animal Imaging Equipment Analysis, Insights and Forecast, 2021-2033
- 6.1. Market Analysis, Insights and Forecast - by Application
- 6.1.1. Cancer and Anti-cancer Drug Research
- 6.1.2. Immunology and Stem Cell Research
- 6.1.3. Pathological Mechanism and Virus Research
- 6.1.4. Gene Expression and Protein
- 6.1.5. Biophotonic Detection
- 6.1.6. Food Supervision and Environmental Supervision
- 6.2. Market Analysis, Insights and Forecast - by Types
- 6.2.1. Optical Imaging
- 6.2.2. Radionuclide Imaging
- 6.2.3. MRI
- 6.2.4. Computed Tomography Imaging
- 6.2.5. Ultrasound Imaging
- 6.1. Market Analysis, Insights and Forecast - by Application
- 7. North America Small Animal Imaging Equipment Analysis, Insights and Forecast, 2020-2032
- 7.1. Market Analysis, Insights and Forecast - by Application
- 7.1.1. Cancer and Anti-cancer Drug Research
- 7.1.2. Immunology and Stem Cell Research
- 7.1.3. Pathological Mechanism and Virus Research
- 7.1.4. Gene Expression and Protein
- 7.1.5. Biophotonic Detection
- 7.1.6. Food Supervision and Environmental Supervision
- 7.2. Market Analysis, Insights and Forecast - by Types
- 7.2.1. Optical Imaging
- 7.2.2. Radionuclide Imaging
- 7.2.3. MRI
- 7.2.4. Computed Tomography Imaging
- 7.2.5. Ultrasound Imaging
- 7.1. Market Analysis, Insights and Forecast - by Application
- 8. South America Small Animal Imaging Equipment Analysis, Insights and Forecast, 2020-2032
- 8.1. Market Analysis, Insights and Forecast - by Application
- 8.1.1. Cancer and Anti-cancer Drug Research
- 8.1.2. Immunology and Stem Cell Research
- 8.1.3. Pathological Mechanism and Virus Research
- 8.1.4. Gene Expression and Protein
- 8.1.5. Biophotonic Detection
- 8.1.6. Food Supervision and Environmental Supervision
- 8.2. Market Analysis, Insights and Forecast - by Types
- 8.2.1. Optical Imaging
- 8.2.2. Radionuclide Imaging
- 8.2.3. MRI
- 8.2.4. Computed Tomography Imaging
- 8.2.5. Ultrasound Imaging
- 8.1. Market Analysis, Insights and Forecast - by Application
- 9. Europe Small Animal Imaging Equipment Analysis, Insights and Forecast, 2020-2032
- 9.1. Market Analysis, Insights and Forecast - by Application
- 9.1.1. Cancer and Anti-cancer Drug Research
- 9.1.2. Immunology and Stem Cell Research
- 9.1.3. Pathological Mechanism and Virus Research
- 9.1.4. Gene Expression and Protein
- 9.1.5. Biophotonic Detection
- 9.1.6. Food Supervision and Environmental Supervision
- 9.2. Market Analysis, Insights and Forecast - by Types
- 9.2.1. Optical Imaging
- 9.2.2. Radionuclide Imaging
- 9.2.3. MRI
- 9.2.4. Computed Tomography Imaging
- 9.2.5. Ultrasound Imaging
- 9.1. Market Analysis, Insights and Forecast - by Application
- 10. Middle East & Africa Small Animal Imaging Equipment Analysis, Insights and Forecast, 2020-2032
- 10.1. Market Analysis, Insights and Forecast - by Application
- 10.1.1. Cancer and Anti-cancer Drug Research
- 10.1.2. Immunology and Stem Cell Research
- 10.1.3. Pathological Mechanism and Virus Research
- 10.1.4. Gene Expression and Protein
- 10.1.5. Biophotonic Detection
- 10.1.6. Food Supervision and Environmental Supervision
- 10.2. Market Analysis, Insights and Forecast - by Types
- 10.2.1. Optical Imaging
- 10.2.2. Radionuclide Imaging
- 10.2.3. MRI
- 10.2.4. Computed Tomography Imaging
- 10.2.5. Ultrasound Imaging
- 10.1. Market Analysis, Insights and Forecast - by Application
- 11. Asia Pacific Small Animal Imaging Equipment Analysis, Insights and Forecast, 2020-2032
- 11.1. Market Analysis, Insights and Forecast - by Application
- 11.1.1. Cancer and Anti-cancer Drug Research
- 11.1.2. Immunology and Stem Cell Research
- 11.1.3. Pathological Mechanism and Virus Research
- 11.1.4. Gene Expression and Protein
- 11.1.5. Biophotonic Detection
- 11.1.6. Food Supervision and Environmental Supervision
- 11.2. Market Analysis, Insights and Forecast - by Types
- 11.2.1. Optical Imaging
- 11.2.2. Radionuclide Imaging
- 11.2.3. MRI
- 11.2.4. Computed Tomography Imaging
- 11.2.5. Ultrasound Imaging
- 11.1. Market Analysis, Insights and Forecast - by Application
- 12. Competitive Analysis
- 12.1. Company Profiles
- 12.1.1 IDEXX
- 12.1.1.1. Company Overview
- 12.1.1.2. Products
- 12.1.1.3. Company Financials
- 12.1.1.4. SWOT Analysis
- 12.1.2 Esaote
- 12.1.2.1. Company Overview
- 12.1.2.2. Products
- 12.1.2.3. Company Financials
- 12.1.2.4. SWOT Analysis
- 12.1.3 Agfa Healthcare
- 12.1.3.1. Company Overview
- 12.1.3.2. Products
- 12.1.3.3. Company Financials
- 12.1.3.4. SWOT Analysis
- 12.1.4 Carestream Health
- 12.1.4.1. Company Overview
- 12.1.4.2. Products
- 12.1.4.3. Company Financials
- 12.1.4.4. SWOT Analysis
- 12.1.5 BCF Technology
- 12.1.5.1. Company Overview
- 12.1.5.2. Products
- 12.1.5.3. Company Financials
- 12.1.5.4. SWOT Analysis
- 12.1.6 Mindray
- 12.1.6.1. Company Overview
- 12.1.6.2. Products
- 12.1.6.3. Company Financials
- 12.1.6.4. SWOT Analysis
- 12.1.7 Hallmarq
- 12.1.7.1. Company Overview
- 12.1.7.2. Products
- 12.1.7.3. Company Financials
- 12.1.7.4. SWOT Analysis
- 12.1.8 Heska
- 12.1.8.1. Company Overview
- 12.1.8.2. Products
- 12.1.8.3. Company Financials
- 12.1.8.4. SWOT Analysis
- 12.1.9 Sedecal
- 12.1.9.1. Company Overview
- 12.1.9.2. Products
- 12.1.9.3. Company Financials
- 12.1.9.4. SWOT Analysis
- 12.1.10 Kaixin Electric
- 12.1.10.1. Company Overview
- 12.1.10.2. Products
- 12.1.10.3. Company Financials
- 12.1.10.4. SWOT Analysis
- 12.1.11 Chison
- 12.1.11.1. Company Overview
- 12.1.11.2. Products
- 12.1.11.3. Company Financials
- 12.1.11.4. SWOT Analysis
- 12.1.12 MinXray
- 12.1.12.1. Company Overview
- 12.1.12.2. Products
- 12.1.12.3. Company Financials
- 12.1.12.4. SWOT Analysis
- 12.1.13 Diagnostic Imaging Systems
- 12.1.13.1. Company Overview
- 12.1.13.2. Products
- 12.1.13.3. Company Financials
- 12.1.13.4. SWOT Analysis
- 12.1.14 Bruker Corporation
- 12.1.14.1. Company Overview
- 12.1.14.2. Products
- 12.1.14.3. Company Financials
- 12.1.14.4. SWOT Analysis
- 12.1.1 IDEXX
- 12.2. Market Entropy
- 12.2.1 Company's Key Areas Served
- 12.2.2 Recent Developments
- 12.3. Company Market Share Analysis 2025
- 12.3.1 Top 5 Companies Market Share Analysis
- 12.3.2 Top 3 Companies Market Share Analysis
- 12.4. List of Potential Customers
- 13. Research Methodology
List of Figures
- Figure 1: Global Small Animal Imaging Equipment Revenue Breakdown (million, %) by Region 2025 & 2033
- Figure 2: North America Small Animal Imaging Equipment Revenue (million), by Application 2025 & 2033
- Figure 3: North America Small Animal Imaging Equipment Revenue Share (%), by Application 2025 & 2033
- Figure 4: North America Small Animal Imaging Equipment Revenue (million), by Types 2025 & 2033
- Figure 5: North America Small Animal Imaging Equipment Revenue Share (%), by Types 2025 & 2033
- Figure 6: North America Small Animal Imaging Equipment Revenue (million), by Country 2025 & 2033
- Figure 7: North America Small Animal Imaging Equipment Revenue Share (%), by Country 2025 & 2033
- Figure 8: South America Small Animal Imaging Equipment Revenue (million), by Application 2025 & 2033
- Figure 9: South America Small Animal Imaging Equipment Revenue Share (%), by Application 2025 & 2033
- Figure 10: South America Small Animal Imaging Equipment Revenue (million), by Types 2025 & 2033
- Figure 11: South America Small Animal Imaging Equipment Revenue Share (%), by Types 2025 & 2033
- Figure 12: South America Small Animal Imaging Equipment Revenue (million), by Country 2025 & 2033
- Figure 13: South America Small Animal Imaging Equipment Revenue Share (%), by Country 2025 & 2033
- Figure 14: Europe Small Animal Imaging Equipment Revenue (million), by Application 2025 & 2033
- Figure 15: Europe Small Animal Imaging Equipment Revenue Share (%), by Application 2025 & 2033
- Figure 16: Europe Small Animal Imaging Equipment Revenue (million), by Types 2025 & 2033
- Figure 17: Europe Small Animal Imaging Equipment Revenue Share (%), by Types 2025 & 2033
- Figure 18: Europe Small Animal Imaging Equipment Revenue (million), by Country 2025 & 2033
- Figure 19: Europe Small Animal Imaging Equipment Revenue Share (%), by Country 2025 & 2033
- Figure 20: Middle East & Africa Small Animal Imaging Equipment Revenue (million), by Application 2025 & 2033
- Figure 21: Middle East & Africa Small Animal Imaging Equipment Revenue Share (%), by Application 2025 & 2033
- Figure 22: Middle East & Africa Small Animal Imaging Equipment Revenue (million), by Types 2025 & 2033
- Figure 23: Middle East & Africa Small Animal Imaging Equipment Revenue Share (%), by Types 2025 & 2033
- Figure 24: Middle East & Africa Small Animal Imaging Equipment Revenue (million), by Country 2025 & 2033
- Figure 25: Middle East & Africa Small Animal Imaging Equipment Revenue Share (%), by Country 2025 & 2033
- Figure 26: Asia Pacific Small Animal Imaging Equipment Revenue (million), by Application 2025 & 2033
- Figure 27: Asia Pacific Small Animal Imaging Equipment Revenue Share (%), by Application 2025 & 2033
- Figure 28: Asia Pacific Small Animal Imaging Equipment Revenue (million), by Types 2025 & 2033
- Figure 29: Asia Pacific Small Animal Imaging Equipment Revenue Share (%), by Types 2025 & 2033
- Figure 30: Asia Pacific Small Animal Imaging Equipment Revenue (million), by Country 2025 & 2033
- Figure 31: Asia Pacific Small Animal Imaging Equipment Revenue Share (%), by Country 2025 & 2033
List of Tables
- Table 1: Global Small Animal Imaging Equipment Revenue million Forecast, by Application 2020 & 2033
- Table 2: Global Small Animal Imaging Equipment Revenue million Forecast, by Types 2020 & 2033
- Table 3: Global Small Animal Imaging Equipment Revenue million Forecast, by Region 2020 & 2033
- Table 4: Global Small Animal Imaging Equipment Revenue million Forecast, by Application 2020 & 2033
- Table 5: Global Small Animal Imaging Equipment Revenue million Forecast, by Types 2020 & 2033
- Table 6: Global Small Animal Imaging Equipment Revenue million Forecast, by Country 2020 & 2033
- Table 7: United States Small Animal Imaging Equipment Revenue (million) Forecast, by Application 2020 & 2033
- Table 8: Canada Small Animal Imaging Equipment Revenue (million) Forecast, by Application 2020 & 2033
- Table 9: Mexico Small Animal Imaging Equipment Revenue (million) Forecast, by Application 2020 & 2033
- Table 10: Global Small Animal Imaging Equipment Revenue million Forecast, by Application 2020 & 2033
- Table 11: Global Small Animal Imaging Equipment Revenue million Forecast, by Types 2020 & 2033
- Table 12: Global Small Animal Imaging Equipment Revenue million Forecast, by Country 2020 & 2033
- Table 13: Brazil Small Animal Imaging Equipment Revenue (million) Forecast, by Application 2020 & 2033
- Table 14: Argentina Small Animal Imaging Equipment Revenue (million) Forecast, by Application 2020 & 2033
- Table 15: Rest of South America Small Animal Imaging Equipment Revenue (million) Forecast, by Application 2020 & 2033
- Table 16: Global Small Animal Imaging Equipment Revenue million Forecast, by Application 2020 & 2033
- Table 17: Global Small Animal Imaging Equipment Revenue million Forecast, by Types 2020 & 2033
- Table 18: Global Small Animal Imaging Equipment Revenue million Forecast, by Country 2020 & 2033
- Table 19: United Kingdom Small Animal Imaging Equipment Revenue (million) Forecast, by Application 2020 & 2033
- Table 20: Germany Small Animal Imaging Equipment Revenue (million) Forecast, by Application 2020 & 2033
- Table 21: France Small Animal Imaging Equipment Revenue (million) Forecast, by Application 2020 & 2033
- Table 22: Italy Small Animal Imaging Equipment Revenue (million) Forecast, by Application 2020 & 2033
- Table 23: Spain Small Animal Imaging Equipment Revenue (million) Forecast, by Application 2020 & 2033
- Table 24: Russia Small Animal Imaging Equipment Revenue (million) Forecast, by Application 2020 & 2033
- Table 25: Benelux Small Animal Imaging Equipment Revenue (million) Forecast, by Application 2020 & 2033
- Table 26: Nordics Small Animal Imaging Equipment Revenue (million) Forecast, by Application 2020 & 2033
- Table 27: Rest of Europe Small Animal Imaging Equipment Revenue (million) Forecast, by Application 2020 & 2033
- Table 28: Global Small Animal Imaging Equipment Revenue million Forecast, by Application 2020 & 2033
- Table 29: Global Small Animal Imaging Equipment Revenue million Forecast, by Types 2020 & 2033
- Table 30: Global Small Animal Imaging Equipment Revenue million Forecast, by Country 2020 & 2033
- Table 31: Turkey Small Animal Imaging Equipment Revenue (million) Forecast, by Application 2020 & 2033
- Table 32: Israel Small Animal Imaging Equipment Revenue (million) Forecast, by Application 2020 & 2033
- Table 33: GCC Small Animal Imaging Equipment Revenue (million) Forecast, by Application 2020 & 2033
- Table 34: North Africa Small Animal Imaging Equipment Revenue (million) Forecast, by Application 2020 & 2033
- Table 35: South Africa Small Animal Imaging Equipment Revenue (million) Forecast, by Application 2020 & 2033
- Table 36: Rest of Middle East & Africa Small Animal Imaging Equipment Revenue (million) Forecast, by Application 2020 & 2033
- Table 37: Global Small Animal Imaging Equipment Revenue million Forecast, by Application 2020 & 2033
- Table 38: Global Small Animal Imaging Equipment Revenue million Forecast, by Types 2020 & 2033
- Table 39: Global Small Animal Imaging Equipment Revenue million Forecast, by Country 2020 & 2033
- Table 40: China Small Animal Imaging Equipment Revenue (million) Forecast, by Application 2020 & 2033
- Table 41: India Small Animal Imaging Equipment Revenue (million) Forecast, by Application 2020 & 2033
- Table 42: Japan Small Animal Imaging Equipment Revenue (million) Forecast, by Application 2020 & 2033
- Table 43: South Korea Small Animal Imaging Equipment Revenue (million) Forecast, by Application 2020 & 2033
- Table 44: ASEAN Small Animal Imaging Equipment Revenue (million) Forecast, by Application 2020 & 2033
- Table 45: Oceania Small Animal Imaging Equipment Revenue (million) Forecast, by Application 2020 & 2033
- Table 46: Rest of Asia Pacific Small Animal Imaging Equipment Revenue (million) Forecast, by Application 2020 & 2033
Frequently Asked Questions
1. What is the projected Compound Annual Growth Rate (CAGR) of the Small Animal Imaging Equipment?
The projected CAGR is approximately 7.93%.
2. Which companies are prominent players in the Small Animal Imaging Equipment?
Key companies in the market include IDEXX, Esaote, Agfa Healthcare, Carestream Health, BCF Technology, Mindray, Hallmarq, Heska, Sedecal, Kaixin Electric, Chison, MinXray, Diagnostic Imaging Systems, Bruker Corporation.
3. What are the main segments of the Small Animal Imaging Equipment?
The market segments include Application, Types.
4. Can you provide details about the market size?
The market size is estimated to be USD 842 million as of 2022.
5. What are some drivers contributing to market growth?
N/A
6. What are the notable trends driving market growth?
N/A
7. Are there any restraints impacting market growth?
N/A
8. Can you provide examples of recent developments in the market?
N/A
9. What pricing options are available for accessing the report?
Pricing options include single-user, multi-user, and enterprise licenses priced at USD 2900.00, USD 4350.00, and USD 5800.00 respectively.
10. Is the market size provided in terms of value or volume?
The market size is provided in terms of value, measured in million.
11. Are there any specific market keywords associated with the report?
Yes, the market keyword associated with the report is "Small Animal Imaging Equipment," which aids in identifying and referencing the specific market segment covered.
12. How do I determine which pricing option suits my needs best?
The pricing options vary based on user requirements and access needs. Individual users may opt for single-user licenses, while businesses requiring broader access may choose multi-user or enterprise licenses for cost-effective access to the report.
13. Are there any additional resources or data provided in the Small Animal Imaging Equipment report?
While the report offers comprehensive insights, it's advisable to review the specific contents or supplementary materials provided to ascertain if additional resources or data are available.
14. How can I stay updated on further developments or reports in the Small Animal Imaging Equipment?
To stay informed about further developments, trends, and reports in the Small Animal Imaging Equipment, consider subscribing to industry newsletters, following relevant companies and organizations, or regularly checking reputable industry news sources and publications.
Methodology
Step 1 - Identification of Relevant Samples Size from Population Database


Step 2 - Approaches for Defining Global Market Size (Value, Volume* & Price*)

Note*: In applicable scenarios
Step 3 - Data Sources
Primary Research
- Web Analytics
- Survey Reports
- Research Institute
- Latest Research Reports
- Opinion Leaders
Secondary Research
- Annual Reports
- White Paper
- Latest Press Release
- Industry Association
- Paid Database
- Investor Presentations

Step 4 - Data Triangulation
Involves using different sources of information in order to increase the validity of a study
These sources are likely to be stakeholders in a program - participants, other researchers, program staff, other community members, and so on.
Then we put all data in single framework & apply various statistical tools to find out the dynamic on the market.
During the analysis stage, feedback from the stakeholder groups would be compared to determine areas of agreement as well as areas of divergence